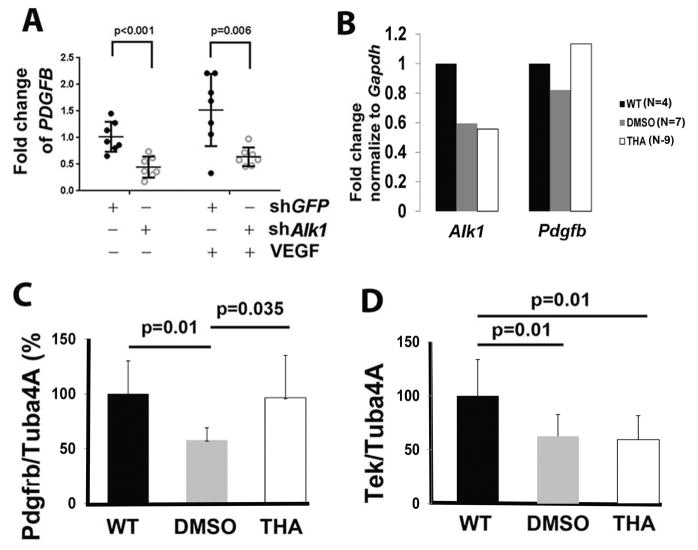
Figure 4. Thalidomide treatment upregulated Pdgfb and Pdgfrβ expression.
A. PDGFB expression was reduced in ALK1 knockdown HBMECs. The Y axis is fold changes compared to the mean of Lenti-GFP (shGFP) treated controls without VEGF treatment. N=7. P values were determined by one-way ANOVA analysis followed by Sidak’s multiple comparisons. B. Quantification of Alk1 and Pdgfb expression in bAVM microvessels. In order to obtained enough RNA for the analysis. microvessels from mice in same group were pooled: 4 wild type (WT) mice, 7 DMSO treated mice and 9 thalidomide (THA) treated mice. C & D. Quantification of western blot results. Tuba4a was used as an internal control for normalization of protein load. Data was shown by percentage (%) normalized to the WT group. N=6. P values were determined by one-way ANOVA followed by Sidak’s multiple comparisons.

