

Abstract
The transcription factor STAT3 is activated inappropriately in 70% of breast cancers, most commonly in triple negative breast cancer (TNBC). Although the transcriptional function of STAT3 is essential for tumorigenesis, the key target genes regulated by STAT3 in driving tumor pathogenesis have remained unclear. To identify critical STAT3 target genes, we treated TNBC cell lines with two different compounds that block STAT3 transcriptional function, pyrimethamine and PMPTP. We then performed gene expression analysis to identify genes whose expression is strongly down-regulated by both STAT3 inhibitors. Foremost among the down-regulated genes was TNFRSF1A, which encodes a transmembrane receptor for TNFα. We showed that STAT3 binds directly to a regulatory region within the TNFRSF1A gene, and that TNFRSF1A levels are dependent on STAT3 function in both constitutive and cytokine-induced models of STAT3 activation. Furthermore, TNFRSF1A is a major mediator of both basal and TNFα-induced NF-κB activity in breast cancer cells. We extended these findings to primary human breast cancers, in which we found that high TNFRSF1A transcript levels correlated with STAT3 activation. In addition, and consistent with a causal role, increased TNFRSF1A expression was associated with an NF-κB gene expression in signature in breast cancers. Thus, TNFRSF1A is a STAT3 target gene that regulates the NF-κB pathway. These findings reveal a novel functional crosstalk between STAT3 and NF-κB signaling in breast cancer. Furthermore, elevated TNFRSF1A levels may predict a subset of breast tumors that are sensitive to STAT3 transcriptional inhibitors, and may be a biomarker for response to inhibition of this pathway.
Introduction
Breast cancer is the most common cancer among women, and the second leading cause of cancer deaths in women, accounting for over 230,000 new cases and 40,000 deaths per year in the US, and for 517,000 deaths in 2015 worldwide [1], [2]. One approach to developing novel therapies for cancer is to identify molecular pathways that are activated inappropriately in this disease. The transcription factor STAT3, which regulates genes controlling proliferation, survival, and pluripotency, is normally activated rapidly and transiently in response to hormones and growth factors [3], [4]. However, in approximately 70% of primary breast cancers, STAT3 is activated constitutively, and directly contributes to the pathogenesis of this disease [5], [6].
Under basal conditions, STAT3 resides in the cytoplasm in an inactive conformation. It becomes activated by phosphorylation on a critical tyrosine residue, tyrosine 705, by cytokine-receptor-associated tyrosine kinases, like Janus kinases (JAKs), growth factor receptors with intrinsic tyrosine-kinase activity, or non-receptor protein tyrosine kinases. Upon activation by tyrosine phosphorylation, STAT3 forms active dimers that translocate into the nucleus and bind to DNA at cognate binding sites in the regulatory region of target genes. STAT3 then regulates the expression of key target genes involved in a variety of cellular processes, including proliferation, differentiation, migration, survival, and angiogenesis [7], [8].
Since STAT3 is largely dispensable in normal cells but essential for the survival of malignant cells, STAT3 inhibition can have a high therapeutic index. A number of approaches have been taken to inhibit STAT3 therapeutically, including kinase inhibitors and dimerization antagonists, though these may display off-target or non-specific effects [9], [10], [11], [12], [13]. Using transcription-based screening assays, it has been possible to identify a number of novel inhibitors of STAT3 function [14]. As STAT3 inhibitors are now being introduced into clinical trials (https://clinicaltrials.gov/ct2/show/NCT01066663), an emerging question is how to identify those cancers most likely to respond to STAT3 inhibition. One approach would be to identify direct STAT3 target genes whose expression is reproducibly inhibited by STAT3 transcriptional inhibitors. Such a gene product might also serve as a pharmacodynamic marker to monitor response to STAT3-directed therapy, and might reveal important novel aspects of STAT3 signaling in cancer cells.
To address this question, we began by identifying STAT3 target genes whose expression is inhibited by two different compounds that specifically block STAT3-dependent gene expression. We then focused on one of these STAT3 targets, which is also unique in that it links STAT3 signaling with another oncogenic transcription factor, NF-κB, in both breast cancer cell lines and primary human breast cancers.
Materials and Methods
Cell Lines
MDA-MB-468 cells (from Myles Brown, Dana-Farber Cancer Institute) and BT549 cells (from Kornelia Polyak, Dana-Farber Cancer Institute) were maintained in Dulbecco's modified Eagle's medium (DMEM) with 10% fetal bovine serum. SK-BR-3 cells (received from Lyndsay Harris, Dana-Farber Cancer Institute) were maintained in RPMI containing 10% fetal bovine serum. Cells were passaged for less than 3 months after thawing. All cells were maintained in a humidified incubator at 37°C with 5% CO2, and were authenticated by short tandem repeat DNA profiling.
Microarray
SK-BR-3 cells were pre-treated with PMPTP (4-[4-(phenylmethyl)piperidin-1-yl] thieno[2,3-d]pyrimidine; 5 μM), pyrimethamine (5 μM), or DMSO vehicle for 1 hour then stimulated with 10 ng/mL of LIF for 90 minutes. Total cellular RNA was isolated using Trizol, and then further purified using a Qiagen RNeasy Mini kit (Valencia, CA). RNA quality was evaluated on a NanoDrop 8000 spectrophotometer (Thermo Fisher Scientific). 1.5 μg of total RNA was submitted for gene expression profiling on the Human Gene ST 2.0 array (21,094 genes; Affymetrix) by the Dana-Farber Cancer Institute Molecular Biology Core Facilities. Raw data expressed as CEL files were normalized using Expression Console software (Affymetrix) and differential gene expression between drug-treated and control samples investigated using Transcriptome Analysis Console software (Affymetrix). Genes exhibiting ≥1.2-fold change were considered up-regulated by LIF compared to unstimulated cells.
Cytokine Stimulation
Cells were stimulated with 10 ng/mL interleukin (IL)-6 (Peprotech, Rocky Hill, NJ), 10 ng/mL TNFα (Peprotech), or 10 ng/mL LIF (EMD Millipore, Billerica, MA). Cells were stimulated for 15 minutes for whole protein analyses (immunoblotting), 30 minutes for cellular fraction protein analysis and ChIP analysis, 90 minutes for mRNA analyses, and 6 hours for luciferase reporter assays.
Chromatin Immunoprecipitation (ChIP)
ChIP was performed as previously described [15]. Briefly, cells (1.5 x 10⁷) were fixed in 1% formaldehyde for 10 minutes, sonicated in 15 second pulses using a Fisher Scientific Sonic Dismembranator Model 500 PDQ on setting 15, and lysates were immunoprecipitated overnight at 4 °C with an antibody for STAT3 (sc-482, Santa Cruz Biotechnology). Quantitative PCR was performed using the indicated primers (Supplementary Table 1), and signal detected was normalized to input and compared to a non-binding region.
Transfection of Expression Constructs
Cells (5 × 10⁵ cells per well in a 6-well plate) were seeded, and the following day were transfected using Lipofectamine 2000 (Invitrogen) with 1 μg of TNFR1 (pBMNZ-neo-Flag-TNFR1 L380A (from Martin Kluger), Addgene plasmid # 43949), or an empty vector as a control. 48 hours after transfection, the cells were stimulated with TNFα as described above and total protein lysates were obtained.
RNA Interference
Cells (5 × 10⁵ cells per well in a 6-well plate) were transfected using Lipofectamine RNAiMAX (Invitrogen) with 10 nM of small interfering RNA (siRNA) targeting TNFRSF1A#1, TNFRSF1A#2 or TNFRSF1A#3 (D-005197-01-0002, D-005197-02-0002 or D-005197-03-0002, respectively; Dharmacon, GE, Lafayette, CO), STAT3 (D-003544-02-0010, Dharmacon, GE), or non-targeting siRNA control (D-001210-03-05, Dharmacon, GE). Cells were transfected with siRNA for 48 hours prior to biological experiments.
Immunoblot Analyses and Nuclear Fractionation
Cells (5 × 10⁵ cells per well in a 6-well plate) were lysed on ice for 15 minutes in RIPA lysis buffer (Boston BioProducts, Boston, MA) with phosphatase and complete protease inhibitors (Roche). Immunoblots were probed with antibodies to TNFR1 (21574–1-AP, Proteintech, Rosemont, IL), p65 (3033, Cell Signaling Technology Inc., Danvers, MA), PARP (9542, Cell Signaling), and tubulin (T5168, Sigma-Aldrich). Cellular fractionation was performed according to the manufacturer's protocol (Active Motif Nuclear Extract Kit Cat. No. 40010; Carlsbad, CA). Band intensity was quantitated using ImageJ software (National Institutes of Health).
Luciferase Reporter Assays
Cells (5 × 10⁴ cells per well in a 24-well plate) were reverse transfected using Lipofectamine RNAiMAX (Invitrogen) with 10 nM of small interfering RNA (siRNA) targeting TNFRSF1A#1, TNFRSF1A#2 or TNFRSF1A#3, or non-targeting siRNA Control. The following day, 1 μg of an NF-κB-dependent luciferase reporter (Stratagene) was transfected into the cells in combination with 0.1 μg Renilla luciferase transfection control (Promega) using Lipofectamine 2000 (Invitrogen). 24 hours after transfection, the cells were stimulated for 6 hours with TNFα, then lysed and quantitated by a dual-luciferase assay (Promega), and read on a Luminoskan Ascent luminometer (ThermoLab Systems, Helsinki, Finland). NF-κB-dependent luciferase production was normalized to Renilla luciferase values.
In the case of ectopic TNFRSF1A expression, cells (5 × 10⁴) were seeded, and the following day were transfected (using Lipofectamine 2000; Invitrogen) with 0.5 μg TNFR1 plasmid (pBMNZ-neo-TNFR1 L380A, Addgene, Boston, MA), or an empty vector control, and 0.5 μg of an NF-κB-dependent reporter (NF-κB-luciferase) in combination with 0.05 μg Renilla luciferase transfection control (phRL-TK-luc; Promega). 24 hours after transfection, the cells were stimulated for 6 hours with TNFα, and analyzed as described above.
mRNA Expression Analyses (RT-PCR)
Total cellular RNA was isolated using Qiagen RNeasy Mini kits. RNA quality was evaluated on a NanoDrop 8000 spectrophotometer (Thermo Fisher Scientific), and reverse transcribed with TaqMan (Applied Biosystems, Foster City, CA) to generate cDNA. Quantitative polymerase chain reaction (qPCR) was performed in quadruplicate using Power SYBR master mix (Applied Biosystems) on a QuantStudio 6 Flex Real-Time PCR System (Applied Biosystems). Specificity of amplification was confirmed by melt curve analysis. Cycle threshold (Cτ) values for target genes were normalized to the endogenous reference gene GAPDH, and the fold change was determined by dividing the expression in each sample by that of the unstimulated control sample. Primer sequences (Supplementary Table 1) were designed from the UCSC genome browser reference mRNA sequences using Primer3.
Analysis of Primary Breast Cancer Data
Data on the phosphorylation of STAT3 on tyrosine 705 (STAT3_PY705) and gene expression were downloaded from the Cancer Genome Atlas (TCGA) breast invasive carcinoma dataset from cBioportal on December 12, 2016. Two other breast cancer microarray datasets were downloaded from the Gene Expression Omnibus (GSE5460 [5] and GSE6861). Phosphorylation of STAT3 on tyrosine 705 (STAT3_PY705) on dataset GSE5460 was published previously [5].
Gene-set enrichment analysis on datasets GSE5460 and GSE6861 was performed using xapps.gsea.Main from the Broad Institute of MIT and Harvard (http://software.broadinstitute.org) [16], [17], based on STAT3 [9], [18] and NF-κB [19] expression signatures, as well as Hallmarks gene sets collection (v6.1) from the Broad Institute of MIT and Harvard (http://software.broadinstitute.org) [16], [17].
Statistical Analyses
Results are presented as ±SD. Two-tailed Student t tests for paired samples were performed with GraphPad Prism 6 software (La Jolla, CA). Values of P < .05 were considered significant (*, P < .05; **, P < .01; ***, P < .001; ****, P < .0001).
Results
TNFRSF1A is Down-Regulated by STAT3 Transcriptional Inhibitors in Breast Cancer Cells
We initially focused on identifying key target genes of STAT3 that mediate its oncogenic effects and could serve as biomarkers for therapy targeting STAT3. To do this, we utilized two pharmacological inhibitors of STAT3 transcriptional function, pyrimethamine and PMPTP, that do not disrupt upstream events such as phosphorylation or nuclear localization at the low concentration used in the current study (5 μM) [14], [20], [21]. While these compounds are specific for STAT3, in that they do not block the transcriptional activity of highly related transcription factors, they may not bind directly to STAT3, and their precise mechanism of action is still being determined. We reasoned that gene expression changes occurring in response to both of these compounds were most likely due to effects on STAT3 transcription rather than to effects on unrelated pathways.
To optimize the dynamic range of gene expression, we initially used SK-BR-3 breast cancer cells, which lack constitutive STAT3 phosphorylation, but show robust induction of STAT3 phosphorylation in response to the cytokine leukemia inhibitory factor (LIF) [3]. We first used gene expression profiling to identify genes induced after 90 minutes of LIF stimulation. We identified 3227 LIF-up-regulated genes, defined as those whose mRNA levels were induced by at least 1.2-fold in LIF-stimulated versus unstimulated, vehicle-treated cells. We then compared the induction of these genes in cells pre-treated for one hour with PMPTP or pyrimethamine, defining genes reduced by STAT3 inhibitors as those showing a decreased induction of at least 20% compared to control cells. PMPTP reduced the induction of 1924 LIF-up-regulated genes while pyrimethamine reduced the induction of 1714 LIF-up-regulated genes, with an overlap of 1140 genes whose induction was reduced by both drugs (Figure 1A).
Figure 1.

STAT3 regulates the expression of TNFRSF1A in breast cancer cells. (A) Two STAT3 inhibitors, PMPTP and pyrimethamine, both decrease expression of 1140 genes in SK-BR-3 cells stimulated with LIF, of which 196 genes, including TNFRSF1A, show direct STAT3 binding by ChIP-seq. (B) SK-BR-3 cells were unstimulated or stimulated with LIF to activate STAT3, and ChIP was performed for the STAT3 binding site in the TNFRSF1A gene. (C) MDA-MB-468 and BT549 cells, which display constitutive STAT3 activation, were transfected with siRNA targeting STAT3 or a non-targeting control. They were then analyzed by qRT-PCR for expression of TNFRSF1A mRNA (top; n = 3) and by immunoblot for TNFRSF1A protein (images, middle; quantitation, bottom. Representative of 3). (D) SK-BR-3 cells were transfected with siRNA targeting STAT3 or a non-targeting control. They were then stimulated with IL-6, after which RNA was harvested and analyzed by qRT-PCR for expression of TNFRSF1A (top; n = 3). Immunoblotting was used to assess the degree of knockdown of STAT3 (and phosphorylated STAT3; bottom).
To restrict our analysis to the LIF-up-regulated genes most likely to be directly regulated by STAT3, we intersected the LIF-up-regulated genes with genes demonstrating direct STAT3 DNA binding by ChIP-Seq. This yielded 196 genes, from which we focused on the gene that showed the maximal repression with both inhibitors, TNFRSF1A (Tumor Necrosis Factor Receptor Superfamily Member 1A, TNFR1), which was inhibited by greater than 95% by both compounds.
STAT3 Regulates the Expression of TNFRSF1A in Breast Cancer Cells
Given the identification of TNFRSF1A as a STAT3 target gene that is down-regulated by STAT3 transcriptional inhibitors, we wished to validate and further elucidate the relationship between STAT3 and TNFRSF1A. ChIP-seq identified a peak of STAT3 binding within the first intron of this gene (Supplementary Figure 1A), and subsequent sequence analysis revealed three canonical STAT3 binding sites within approximately 1 kb in this region (Supplementary Figure 1B). This proximity of STAT3 binding sites is significant, given the cooperativity of STAT3 DNA binding at tandem sites [22]. We next wished to confirm that STAT3 could bind to this regulatory region of TNFRSF1A in an inducible manner. We performed directed ChIP to determine the binding of STAT3 to this region in SK-BR-3 cells in the presence or absence of LIF treatment. Treating cells with LIF for 30 minutes led to a 20-fold increase of STAT3 binding (Figure 1B), suggesting that this is a functional site.
We next focused on the regulation of TNFRSF1A mRNA by STAT3. Triple negative breast cancers (TNBCs) characteristically display constitutive phosphorylation of STAT3, and the viability of these cells is inhibited by STAT3 inhibitors [4], [9]. To determine the functional interaction between STAT3 and TNFRSF1A in triple negative breast cancer cells, we used RNA interference to silence STAT3 in MDA-MB-468 and BT549 cell lines, which have constitutive activation of STAT3. Knockdown of STAT3 reduced the expression of TNFRSF1A mRNA and protein by greater than 50% in both cell lines (Figure 1C).
We next considered the possibility that STAT3 regulates TNFRSF1A expression in breast cancer cells that do not display constitutively active STAT3, but in which STAT3 activation can be induced by cytokine stimulation. We examined the breast cancer cell line SK-BR-3, which lack constitutive STAT3 phosphorylation, but in which STAT3 can be specifically activated by cytokine stimulation, as may occur in the tumor microenvironment. Treatment with IL-6 induced approximately a two-fold increase in TNFRSF1A expression in these cells. However, this effect was completely abrogated when STAT3 was depleted by RNA interference (Figure 1D). Taken together, these findings indicate that TNFRSF1A is a direct transcriptional target of STAT3 in both constitutive and cytokine-activated breast cancer systems.
STAT3-Modulated TNFRSF1A Expression Regulates NF-κB Activity
Having identified TNFRSF1A as a key target gene of STAT3 in breast cancer cells that is down-regulated by STAT3 transcriptional inhibitors, we next focused on the biological function of this protein. TNFRSF1A is the key cell surface receptor for the cytokine TNFα. When TNFα binds to TNFRSF1A, it induces activation of the transcription factor NF-κB, which also promotes survival and proliferation in breast cancer [23], [24]. Furthermore, malignant cells themselves can produce TNFα, thereby enhancing the activation of NF-κB pathway [7], and TNFα in the breast cancer microenvironment can enhance tumorigenesis [25]. To prevent excessive signaling through both of these pathways, cells have negative feedback mechanisms to minimize co-activation of STAT3 and NF-κB, although these processes can be subverted in breast cancer pathogenesis [26]. Given this association of TNFα with NF-κΒ activation, we hypothesized that STAT3-driven TNFRSF1A expression regulates NF-κB transcriptional activity in TNBC cells. To test this hypothesis, we transfected MDA-MB-468 or BT549 TNBC cells with a luciferase reporter gene under the control of an NF-κB-regulated promoter. When the cells were treated with any one of three distinct siRNAs targeting TNFRSF1A, there was a decrease in basal NF-κB activity (Figure 2A). Even more significantly, the increase in NF-κB activity induced by TNFα was completely abrogated by knockdown of TNFRSF1A (Figure 2A). To determine whether this role for TNFRSF1A extended to endogenous NF-κB-regulated genes, we assessed the mRNA expression of well-annotated NF-κB target genes, including IL-8, A20, BIRC3 and IL-6. Knockdown of TNFRSF1A completely suppressed the TNFα-induced expression of each of these genes in both TNBC cell lines (Figure 2B and C).
Figure 2.

TNFRSF1A expression modulates NF-κB activity. (A) MDA-MB-468 and BT549 cells were transfected with the indicated siRNA targeting TNFRSF1A or a non-targeting control. Cells were left untreated or stimulated with TNFα, and were then analyzed by a luciferase reporter assay for NF-κB-dependent transcriptional activity (n = 3). MDA-MB-468 (B) and BT549 (C) cells were transfected with siRNA targeting TNFRSF1A or a non-targeting control. Cells were then stimulated with TNFα and analyzed by qRT-PCR for expression of endogenous NF-κB target genes (n = 3).
TNFRSF1A ultimately controls NF-κB activity by regulating the release of transcriptional NF-κB subunits from inactive complexes in the cytoplasm, to allow nuclear translocation and DNA binding. The p65 subunit of NF-κB (RelA) is the most abundant transcriptionally active form of NF-κB in breast cancer cells. Therefore, we analyzed the effect of TNFRSF1A expression on the nuclear localization of p65 in TNBC cells. Knockdown of TNFRSF1A led to a prominent decrease of TNFα-induced p65 nuclear localization in both cell lines, suggesting that TNFRSF1A regulates NF-κB transcriptional activity through regulation of nuclear accumulation of p65 (Figure 3).
Figure 3.
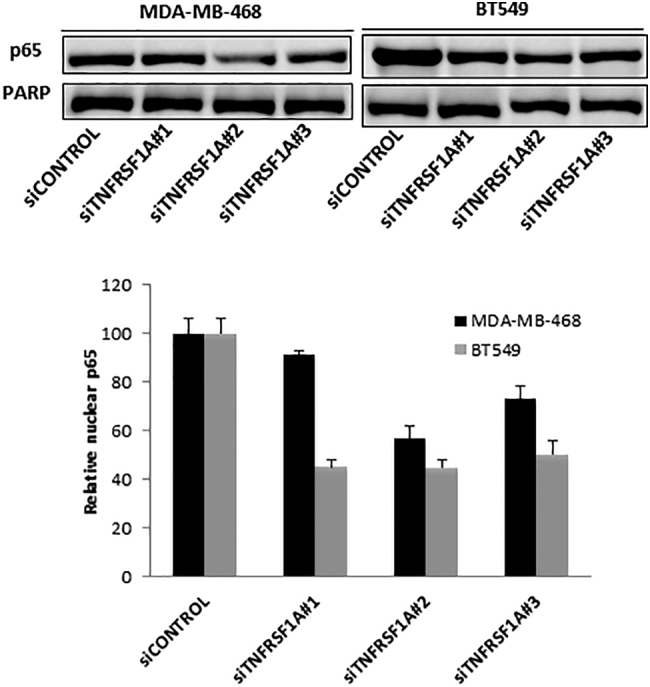
TNFRSF1A depletion decreases nuclear NF-κB (p65) localization. MDA-MB-468 and BT549 cells were transfected with siRNA targeting TNFRSF1A or a non-targeting control, and then stimulated with TNFα. Nuclei were isolated, and p65 (RelA) was quantitated by immunoblot and normalized to PARP, which served as a loading control for nuclear protein.
To further elucidate how modulation of TNFRSF1A expression affects NF-κB activity, we increased expression of this protein by transfecting an expression construct (TNFR1) into MDA-MB-468 and BT549 cells [27]. We first verified that increased TNFRSF1A protein levels could be detected in MDA-MB468 and BT549 whole cell lysates 24 h and 48 h after transfection, relative to the empty vector (Figure 4A). We then analyzed integrated NF-κB transcriptional activity using an NF-κB-dependent luciferase reporter construct. Increased expression of TNFRSF1A led to an increase in both basal NF-κB activity, as well as that detected after stimulation with TNFα (Figure 4B). To determine whether increased TNFRSF1A expression also affected expression of endogenous NF-κB-regulated genes, we used RT-PCR to quantitate the mRNA of well-annotated NF-κB target genes, including IL-8, A20, BIRC3 and IL-6. TNFRSF1A overexpression led to an increased TNFα-induced expression of each of these genes in both TNBC cell lines (Figure 4C). Taken together, these findings suggest that modulation of TNFRSF1A expression is a major regulator of NF-κB transcriptional function in TNBC cells.
Figure 4.

TNFRSF1A expression modulates NF-κB activity. MDA-MB-468 and BT549 cells were transfected with TNFR1 plasmid (encoding TNFRSF1A) or an empty vector. They were then stimulated with TNFα and analyzed by (A) immunoblot for the expression of TNFR1 (TNFRSF1A) in whole cell lysates (with tubulin serving as a loading control), (B) luciferase reporter assay for NF-κB-dependent transcriptional activity (n = 3), and (C) qRT-PCR for expression of endogenous NF-κB target genes (normalized to GAPDH; n = 3).
TNFRSF1A Expression Correlates With STAT3 Activation in Primary Breast Cancers
Having identified TNFRSF1A as a STAT3-regulated gene that links STAT3 and NF-κB signaling in breast cancer cell lines, we next wished to determine if this relationship occurs in primary human breast tumors. Using data from The Cancer Genome Atlas (TCGA) and from the breast cancer microarray dataset GSE5460 [5], we first segregated breast cancers based on the activating tyrosine phosphorylation of STAT3. If TNFRSF1A is a key STAT3 target gene in primary breast cancers, we predicted that TNFRSF1A expression would be higher in tumors with activated STAT3. Indeed, we found significantly higher mRNA levels of TNFRSF1A in breast tumors with phosphorylated STAT3 (Figure 5A and B). As the phosphorylated-tyrosine epitope of STAT3 may be labile when analyzed from primary tumors, a STAT3 gene expression signature can be used as an independent measure of transcriptionally active STAT3. Thus, we used gene set enrichment analysis (GSEA) to determine the relationship between a STAT3 gene expression signature [9], [18] and TNFRSF1A levels. We found a strong correlation between the presence of a STAT3 gene expression signature and TNFRSF1A mRNA expression (Figure 5C and D), further suggesting that TNFRSF1A follows STAT3 activation in primary breast cancers.
Figure 5.

TNFRSF1A expression correlates with STAT3 activation in primary breast cancers. (A, B) TNFRSF1A mRNA levels in breast cancers were compared based on STAT3 phosphorylation in the samples. Differences were analyzed by Student's unpaired t-test with Welch's correction. The data in (A), where positive staining (pSTAT3+) was defined as a z score >0.5 (n = 70), and negative staining (pSTAT3-) was defined as a z score <−0.5 (n = 128), are from The Cancer Genome Atlas (TCGA) Breast Cancer provisional dataset (n = 403 patients). The data in (B) are from the breast cancer microarray dataset GSE5460 (129 patient samples). (C, D) Gene set enrichment analysis (GSEA) was performed on two breast cancer microarray datasets; GSE5460 (129 patient samples) (C) and GSE6861 (161 patient samples) (D). In both, the 50 samples with highest and lowest TNFRSF1A mRNA levels were compared for expression of a STAT3 gene expression signature. Statistical significance was defined as FDR q value <0.25 and normalized P value <.05.
If TNFRSF1A is a key mediator of NF-κB activity within primary breast tumors, then we would predict that higher expression of TNFRSF1A would correlate with increased NF-κB transcriptional activity. To test this hypothesis we examined the relationship between TNFRSF1A mRNA levels and an NF-κB gene expression signature using GSEA [19]. We found that an NF-κB gene expression signature was highly correlated with high TNFRSF1A expression (Figure 6A and B). Taken together, these data support the hypothesis that the STAT3-regulated gene TNFRSF1A links STAT3 activity and NF-κB activity in both breast cancer model systems and primary breast cancers.
Figure 6.

TNFRSF1A expression correlates with NF-κB activation in primary breast cancers. (A, B) GSEA was performed on two breast cancer microarray datasets; GSE5460 (129 patient samples) (A) and GSE6861 (161 patient samples) (B). In both, the 50 samples with highest and lowest TNFRSF1A mRNA levels were compared for expression of an NF-κB gene expression signature. Statistical significance was defined as FDR q value <0.25 and normalized P value <.05.
Discussion
Oncogenic transcription factors like STAT3 lie at the convergence points of many upstream pathways that may be activated by mutation in cancer cells. Since these transcription factors can often be inhibited in normal cells with minimal consequences, STAT3 inhibition holds the potential for having a high therapeutic index. However, because STAT3 regulates many genes simultaneously, it is critical to identify a cohort of STAT3-regulated genes that can serve as predictive markers for response to STAT3 inhibitors.
Since STAT3 is activated constitutively in approximately 70% of breast cancers [5], and particularly among TNBC tumors [9], we chose to focus on genes regulated by STAT3 in this tumor type. TNBCs are particularly aggressive tumors, which are more common in young women and among African-American women [28]. As TNBCs lack expression of estrogen receptor and progesterone receptor, they are not susceptible to endocrine-based therapeutic strategies, and chemotherapy remains the primary systemic treatment [29]. Thus, STAT3 inhibitors have significant potential for therapeutic benefit in this disease that is otherwise challenging to treat. To ensure examination of direct STAT3 targets, we identified genes with a proximal STAT3 binding site based on ChIP-seq and then focused on genes whose expression was inhibited by two different inhibitors of STAT3 transcriptional function in two different TNBC cell lines. From this integrated approach, we identified TNFRSF1A as a key STAT3-regulated gene.
TNFRSF1A is one of the major transmembrane receptors for TNFα. When TNFα binds to TNFRSF1A, it induces activation of NF-κB, a collective name for a family of transcription factors consisting of five proteins: RelA/p65, RelB, c-Rel, p50 and p52 [25], [30]. A heterodimer formed by p65 and p50 subunits is the most abundant form and comprises the majority of NF-κB transcriptional activity [31], [32]. NF-κB is a crucial regulator of the expression of genes involved in control of innate and adaptive immune responses, inflammation, and cancer progression [33]. Under basal conditions, NF-κB (p65-p50 heterodimer) is maintained in an inactive state in the cytoplasm, through interaction and binding to inhibitor of kappa B (IκB) proteins. TNFα binding to TNFRSF1A leads to a cascade of phosphorylation events culminating in the phosphorylation and subsequent proteasome-mediated degradation of IκBα [34]. This uncovers a nuclear localization signal (NLS) of NF-κB, which directs the transcription factor to the nucleus, where it binds to promoter regions to regulate the expression of target genes involved in cell survival, proliferation, migration, invasion, and epithelial-mesenchymal transition (EMT) (http://www.bu.edu/nf-kb/gene-resources/target-genes/) [35]. A negative feedback loop leads to re-synthesis of NF-κB-dependent IκBα proteins, leading to NF-κB export from the nucleus via CRMI-dependent nuclear export [36], [37].
Like STAT3, NF-κB is often aberrantly or constitutively active in many human malignancies, playing a role in the regulation of the apoptosis-proliferation balance in tumor cells [38], [39]. Continuous activation of NF-κB is caused either by mutational activation of upstream signaling molecules or in response to extracellular stimuli within the tumor microenvironment [40].
Under physiologic conditions, both STAT3 and NF-κB are tightly regulated, and are transcriptionally active for only minutes to hours after a cytokine stimulus. However, both of these transcription factors can be active constitutively in cancer, thereby driving gene expression underlying the malignant phenotype. The STAT3 and NF-κB pathways interact on multiple levels. A key NF-κB target gene mediating the acute phase response is IL-6, also a potent STAT3 stimulus. In addition, there is evidence that STAT3 and NF-κB cooperate via physical interactions at certain promoters [7], [41]. Finally, there are negative feedback loops preventing constitutive activation of both signaling pathways. For example, the microRNA miR-146b is a prominent STAT3-regulated gene that suppresses activation of NF-κB [26]. However, the miR-146b locus is frequently silenced by methylation in breast cancer, allowing for simultaneous activation of both pathways. Thus, the functional interaction between these pathways is complex and dynamic.
In this study, we identified TNFRSF1A as a STAT3-dependent gene both in constitutive and cytokine-induced systems of STAT3 activation. This adds an additional point of interaction between the STAT3 and NF-κB pathways, one that promotes simultaneous activation of both. Although this interaction was discovered in breast cancer cell lines, there is strong evidence from gene expression analyses that it holds true in primary breast cancers as well (Figure 5).
STAT3 represents a high value target in breast cancer and other tumors. A number of approaches have been taken to inhibit this transcription factor, including targeting the SH2, DNA binding, or N-terminal domains [4]. STAT3 inhibitors with novel mechanisms of action, like pyrimethamine, are now in clinical trials [42]. In this era of precision medicine, it is becoming more important to identify patients most likely to benefit from a STAT3 inhibitor. One approach is to use immunohistochemistry (IHC) to identify tumors with tyrosine-phosphorylated, and presumably nuclear, STAT3. However, phosphorylated epitopes may be labile. In addition, since the phosphorylated tyrosine of one STAT3 monomer is bound to the SH2 domain of its STAT3 binding partner, it is necessary to use antigen retrieval techniques to successfully detect this phosphorylation by IHC. Thus, elevated TNFRSF1A expression levels could serve as a more feasible biomarker for detecting functional STAT3 activation. Monitoring changes in TNFRSF1A expression in cancer patients receiving STAT3 inhibitor treatment could also serve as a useful pharmacodynamic marker to titrate the dose of inhibitor to optimal STAT3 inhibitory activity.
Conclusions
In summary, TNFRSF1A is a direct STAT3 target gene that also regulates NF-κB activity in TNBC cell lines. Evidence from primary breast cancers suggests that a similar relationship is present in human tumors as well. In addition to being a connecting node between these two oncogenic pathways, TNFRSF1A may be an important biomarker for novel drugs that are being developed to target STAT3.
Footnotes
This research was supported by the Basque Government, Departamento de Educación, Universidades e Investigación (S.P.E.); NIH grant R01-CA160979, a BCRF-AACR grant for Translational Breast Cancer Research, and the Brent Leahey Fund, (D.A.F.); and, NIH grants T32GM007226 and F30 CA180340 (J.E.Y.).
Supplementary data to this article can be found online at https://doi.org/10.1016/j.neo.2018.03.004.
Appendix A. Supplementary data
Supplementary material
References
- 1.American Cancer Society . 2017. Cancer Facts and Figures. [Google Scholar]
- 2.Organization WH Breast Cancer. 2015. http://www.who.int/cancer/detection/breastcancer/en/ Available from:
- 3.Walker SR, Nelson EA, Yeh JE, Pinello L, Yuan G-C, Frank DA. STAT5 Outcompetes STAT3 To Regulate the Expression of the Oncogenic Transcriptional Modulator BCL6. Mol Cell Biol. 2013;33(15):2879–2890. doi: 10.1128/MCB.01620-12. [DOI] [PMC free article] [PubMed] [Google Scholar]
- 4.Walker SR, Xiang M, Frank DA. Distinct roles of STAT3 and STAT5 in the pathogenesis and targeted therapy of breast cancer. Mol Cell Endocrinol. 2014;382(1):616–621. doi: 10.1016/j.mce.2013.03.010. [DOI] [PMC free article] [PubMed] [Google Scholar]
- 5.Alvarez JV, Febbo PG, Ramaswamy S, Loda M, Richardson A, Frank DA. Identification of a Genetic Signature of Activated Signal Transducer and Activator of Transcription 3 in Human Tumors. Cancer Res. 2005;65(12):5054–5062. doi: 10.1158/0008-5472.CAN-04-4281. [DOI] [PubMed] [Google Scholar]
- 6.Walker SR, Nelson EA, Zou L, Chaudhury M, Signoretti S, Richardson A, Frank DA. Reciprocal effects of STAT5 and STAT3 in breast cancer. Mol Cancer Res. 2009;7(6):966–976. doi: 10.1158/1541-7786.MCR-08-0238. [DOI] [PubMed] [Google Scholar]
- 7.Grivennikov SI, Karin M. Dangerous liaisons: STAT3 and NF-κB collaboration and crosstalk in cancer. Cytokine Growth Factor Rev. 2010;21(1):11–19. doi: 10.1016/j.cytogfr.2009.11.005. [DOI] [PMC free article] [PubMed] [Google Scholar]
- 8.Martincuks A, Andryka K, Küster A, Schmitz-Van de Leur H, Komorowski M, Müller-Newen G. Nuclear translocation of STAT3 and NF-κB are independent of each other but NF-κB supports expression and activation of STAT3. Cell Signal. 2017;32:36–47. doi: 10.1016/j.cellsig.2017.01.006. [DOI] [PubMed] [Google Scholar]
- 9.Marotta LLC, Almendro V, Marusyk A, Shipitsin M, Schemme J, Walker SR, Bloushtain-Qimron N, Kim JJ, Choudhury SA, Maruyama R. The JAK2/STAT3 signaling pathway is required for growth of CD44+CD24– stem cell–like breast cancer cells in human tumors. J Clin Invest. 2011;121(7):2723–2735. doi: 10.1172/JCI44745. [DOI] [PMC free article] [PubMed] [Google Scholar]
- 10.Hedvat M, Huszar D, Herrmann A, Gozgit JM, Schroeder A, Sheehy A, Buettner R, Proia D, Kowolik CK, Xin H. The JAK2 inhibitor AZD1480 potently blocks Stat3 signaling and oncogenesis in solid tumors. Cancer Cell. 2009;16(6):487–497. doi: 10.1016/j.ccr.2009.10.015. [DOI] [PMC free article] [PubMed] [Google Scholar]
- 11.Blaskovich MA, Sun J, Cantor A, Turkson J, Jove R, Sebti SM. Discovery of JSI-124 (Cucurbitacin I), a selective janus kinase/signal transducer and activator of transcription 3 signaling pathway inhibitor with potent antitumor activity against human and murine cancer cells in mice. Cancer Res. 2003;63(6):1270–1279. [PubMed] [Google Scholar]
- 12.Song H, Wang R, Wang S, Lin J. A low-molecular-weight compound discovered through virtual database screening inhibits Stat3 function in breast cancer cells. Proc Natl Acad Sci U S A. 2005;102(13):4700–4705. doi: 10.1073/pnas.0409894102. [DOI] [PMC free article] [PubMed] [Google Scholar]
- 13.Chen J, Bai L, Bernard D, Nikolovska-Coleska Z, Gomez C, Zhang J, Yi H, Wang S. Structure-based design of conformationally constrained, cell-permeable STAT3 inhibitors. ACS Med Chem Lett. 2010;1(2):85–89. doi: 10.1021/ml100010j. [DOI] [PMC free article] [PubMed] [Google Scholar]
- 14.Nelson EA, Sharma SV, Settleman J, Frank DA. A chemical biology approach to developing STAT inhibitors: molecular strategies for accelerating clinical translation. Oncotarget. 2011;2(6):518–524. doi: 10.18632/oncotarget.296. [DOI] [PMC free article] [PubMed] [Google Scholar]
- 15.Nelson EA, Walker SR, Alvarez JV, Frank DA. Isolation of unique STAT5 targets by chromatin immunoprecipitation-based gene identification. J Biol Chem. 2004;279(52):54724–54730. doi: 10.1074/jbc.M408464200. [DOI] [PubMed] [Google Scholar]
- 16.Subramanian A, Tamayo P, Mootha VK, Mukherjee S, Ebert BL, Gillette MA, Paulovich A, Pomeroy SL, Golub TR, Lander ES. Gene set enrichment analysis: A knowledge-based approach for interpreting genome-wide expression profiles. Proc Natl Acad Sci. 2005;102(43):15545–15550. doi: 10.1073/pnas.0506580102. [DOI] [PMC free article] [PubMed] [Google Scholar]
- 17.Mootha VK, Lindgren CM, Eriksson K-F, Subramanian A, Sihag S, Lehar J, Puigserver P, Carlsson E, Ridderstråle M, Laurila E. PGC-1[alpha]-responsive genes involved in oxidative phosphorylation are coordinately downregulated in human diabetes. Nat Genet. 2003;34(3):267–273. doi: 10.1038/ng1180. [DOI] [PubMed] [Google Scholar]
- 18.Walker S, Wang C, Walradt T, Hong BS, Tanner JR, Levinsohn JL, Goh G, Subtil A, Lessin SR, Heymann WR. Identification of a gain-of-function STAT3 mutation (p.Y640F) in lymphocytic variant hypereosinophilic syndrome. Blood. 2016;127(7):948–951. doi: 10.1182/blood-2015-06-654277. [DOI] [PMC free article] [PubMed] [Google Scholar]
- 19.Lerebours F, Vacher S, Andrieu C, Espie M, Marty M, Lidereau R, Bieche I. NF-kappa B genes have a major role in Inflammatory Breast Cancer. BMC Cancer. 2008;8(1):41–51. doi: 10.1186/1471-2407-8-41. [DOI] [PMC free article] [PubMed] [Google Scholar]
- 20.Takakura A, Nelson EA, Haque N, Humphreys BD, Zandi-Nejad K, Frank DA, Zhou J. Pyrimethamine inhibits adult polycystic kidney disease by modulating STAT signaling pathways. Hum Mol Genet. 2011;20(21):4143–4154. doi: 10.1093/hmg/ddr338. [DOI] [PMC free article] [PubMed] [Google Scholar]
- 21.Madoux F, Koenig M, Sessions H, Nelson E, Mercer BA, Cameron M, Roush W, Frank D, Hodder P. Probe Reports from the NIH Molecular Libraries Program [Internet] National Center for Biotechnology Information (US); Bethesda (MD): 2010. Modulators of STAT transcription factors for the targeted therapy of cancer (STAT3 Inhibitors) [PubMed] [Google Scholar]
- 22.Hu T, Yeh JE, Pinello L, Jacob J, Chakravarthy S, Yuan G-C, Chopra R, Frank DA. Impact of the N-terminal domain of STAT3 in STAT3-dependent transcriptional activity. Mol Cell Biol. 2015;35(19):3284–3300. doi: 10.1128/MCB.00060-15. [DOI] [PMC free article] [PubMed] [Google Scholar]
- 23.Matsumoto G, Namekawa J, Muta M, Nakamura T, Bando H, Tohyama K, Toi M, Umezawa K. Targeting of nuclear factor κB pathways by dehydroxymethylepoxyquinomicin, a novel inhibitor of breast carcinomas: antitumor and antiangiogenic potential in vivo. Clin Cancer Res. 2005;11(3):1287–1293. [PubMed] [Google Scholar]
- 24.Ndlovu MN, Van Lint C, Van Wesemael K, Callebert P, Chalbos D, Haegeman G, Vanden Berghe W. Hyperactivated NF-κB and AP-1 transcription factors promote highly accessible chromatin and constitutive transcription across the interleukin-6 gene promoter in metastatic breast cancer cells. Mol Cell Biol. 2009;29(20):5488–5504. doi: 10.1128/MCB.01657-08. [DOI] [PMC free article] [PubMed] [Google Scholar]
- 25.Van Horssen R, ten Hagen TLM, Eggermont AMM. TNF-α in cancer treatment: molecular insights, antitumor effects, and clinical utility. Oncologia. 2006;11(4):397–408. doi: 10.1634/theoncologist.11-4-397. [DOI] [PubMed] [Google Scholar]
- 26.Xiang M, Birkbak NJ, Vafaizadeh V, Walker SR, Yeh JE, Liu S, Kroll Y, Boldin M, Taganov K, Groner B. STAT3 Induction of miR-146b Forms a Feedback Loop to Inhibit the NF-κB to IL-6 Signaling Axis and STAT3-Driven Cancer Phenotypes. Sci Signal. 2014;7(310):ra1–ra11. doi: 10.1126/scisignal.2004497. [DOI] [PMC free article] [PubMed] [Google Scholar]
- 27.D'Alessio A, Kluger MS, Li JH, Al-Lamki R, Bradley JR, Pober JS. Targeting of tumor necrosis factor receptor 1 to low density plasma membrane domains in human endothelial cells. J Biol Chem. 2010;285(31):23868–23879. doi: 10.1074/jbc.M110.122853. [DOI] [PMC free article] [PubMed] [Google Scholar]
- 28.Dietze EC, Sistrunk C, Miranda-Carboni G, O'Regan R, Seewaldt VL. Triple-negative breast cancer in African-American women: disparities versus biology. Nat Rev Cancer. 2015;15(4):248–254. doi: 10.1038/nrc3896. [DOI] [PMC free article] [PubMed] [Google Scholar]
- 29.Bianchini G, Balko JM, Mayer IA, Sanders ME, Gianni L. Triple-negative breast cancer: challenges and opportunities of a heterogeneous disease. Nat Rev Clin Oncol. 2016;13(11):674–690. doi: 10.1038/nrclinonc.2016.66. [DOI] [PMC free article] [PubMed] [Google Scholar]
- 30.Oeckinghaus A, Ghosh S. The NF-κB family of transcription factors and its regulation. Cold Spring Harb Perspect Biol. 2009;1(4) doi: 10.1101/cshperspect.a000034. [DOI] [PMC free article] [PubMed] [Google Scholar]
- 31.Phelps CB, Sengchanthalangsy LL, Malek S, Ghosh G. Mechanism of κB DNA binding by Rel/NF-κB dimers. J Biol Chem. 2000;275(32):24392–24399. doi: 10.1074/jbc.M003784200. [DOI] [PubMed] [Google Scholar]
- 32.O'Dea E, Hoffmann A. The Regulatory Logic of the NF-κB Signaling System. Cold Spring Harb Perspect Biol. 2010;2(1) doi: 10.1101/cshperspect.a000216. [DOI] [PMC free article] [PubMed] [Google Scholar]
- 33.Vallabhapurapu S, Karin M. Regulation and function of NF-κB transcription factors in the immune system. Annu Rev Immunol. 2009;27(1):693–733. doi: 10.1146/annurev.immunol.021908.132641. [DOI] [PubMed] [Google Scholar]
- 34.Hayden MS, Ghosh S. Shared Principles in NF-κB Signaling. Cell. 2008;132(3):344–362. doi: 10.1016/j.cell.2008.01.020. [DOI] [PubMed] [Google Scholar]
- 35.Natoli G, De Santa F. Shaping alternative NF-kappaB-dependent gene expression programs: New clues to specificity. Cell Death Differ. 2006;13(5):693–696. doi: 10.1038/sj.cdd.4401880. [DOI] [PubMed] [Google Scholar]
- 36.Arenzana-Seisdedos F, Turpin P, Rodriguez M, Thomas D, Hay RT, Virelizier JL, Dargemont C. Nuclear localization of I kappa B alpha promotes active transport of NF-kappa B from the nucleus to the cytoplasm. J Cell Sci. 1997;110(3):369–378. doi: 10.1242/jcs.110.3.369. [DOI] [PubMed] [Google Scholar]
- 37.Chen L, Fischle W, Verdin E, Greene WC. Duration of nuclear NF-κB action regulated by reversible acetylation. Science. 2001;293(5535):1653–1657. doi: 10.1126/science.1062374. [DOI] [PubMed] [Google Scholar]
- 38.Lin A, Karin M. NF-κB in cancer: a marked target. Semin Cancer Biol. 2003;13(2):107–114. doi: 10.1016/s1044-579x(02)00128-1. [DOI] [PubMed] [Google Scholar]
- 39.Dolcet X, Llobet D, Pallares J, Matias-Guiu X. NF-kB in development and progression of human cancer. Virchows Arch. 2005;446(5):475–482. doi: 10.1007/s00428-005-1264-9. [DOI] [PubMed] [Google Scholar]
- 40.Karin M, Cao Y, Greten FR, Li Z-W. NF-[kappa]B in cancer: from innocent bystander to major culprit. Nat Rev Cancer. 2002;2(4):301–310. doi: 10.1038/nrc780. [DOI] [PubMed] [Google Scholar]
- 41.Bollrath J, Greten FR. IKK/NF-κB and STAT3 pathways: central signalling hubs in inflammation-mediated tumour promotion and metastasis. EMBO Rep. 2009;10(12):1314–1319. doi: 10.1038/embor.2009.243. [DOI] [PMC free article] [PubMed] [Google Scholar]
- 42.Clinical Trials.gov . 2017. Pyrimethamine for the treatment of relapsed chronic lymphocytic leukemia/small lymphocytic lymphoma. [cited 2017 Aug 28] [Google Scholar]
Associated Data
This section collects any data citations, data availability statements, or supplementary materials included in this article.
Supplementary Materials
Supplementary material