Abstract
Background
The objective of this study was to explore the role of SIX1 in paclitaxel (TAX) resistance of HepG2 cells via reactive oxygen species (ROS) and autophagy pathway.
Material/Methods
Hepatoma cell line HepG2 was treated with SIX1 knockdown or/and TAX. Cell growth was detected by MTT assay and colony formation assay. Cell apoptosis was evaluated with flow cytometry. ROS levels were detected using flow cytometry (stained with DCFH2-DA). Western blot was conducted to detect the expression of SIX1 and autophagy-related proteins.
Results
TAX suppressed the proliferation of HepG2 cells in a time/dose-dependent manner, and upregulated the expression of SIX1. SIX1 siRNA increased TAX sensitivity of HepG2 cells and upregulated cell ROS levels. SIX1 siRNA combined with TAX treatment activated autophagy of HepG2 cells. N-acetyl-L-cysteine (NAC) partially attenuated SIX1 siRNA-induced ROS level increases, and autophagy inhibitor 3-MA notably enhanced SIX1 siRNA-induced cell apoptosis.
Conclusions
Knockdown of SIX1 increased cell ROS levels and autophagy, promoted cell apoptosis, and enhanced TAX sensitivity of HepG2 cells.
MeSH Keywords: Apoptosis, Autophagy, Hep G2 Cells, Paclitaxel
Background
Hepatocellular carcinoma (HCC) is one of the most lethal diagnosed cancers among humans and the most common type of liver cancer in adults [1]. It is reported that about 40,000 cases are diagnosed and almost one million patients die every year [2]. Viral hepatitis infection (both B and C type) and cirrhosis are the most prevalent contributors to the development of HCC. HCC has a high rate of recurrence and metastasis, especially in non-surgical cases. Surgery is currently considered the best treatment for HCC, but a majority of patients with HCC are not suitable for surgery at the time of diagnosis because their liver function cannot withstand the damage caused by a major operation [3]. Other available clinical treatments include chemotherapy and radiotherapy, of which chemotherapy with anti-cancer reagents is the preferred option for prognosis [4].
Paclitaxel (Taxol, TAX), originally obtained from the yew tree Taxus brevifolia, is one of the most widely applied anticancer agents [5]. It is an effective chemotherapeutic agent for the treatment of solid tumors occurring in breast, ovarian, prostate, bladder, leukemia, human glioma, and other clinic cases [6–8]. Therefore, TAX combined with other drugs offers a promising method for the treatment of HCC. TAX can induce cell programmed death by affecting cell assembly and disassembly. Cell cycle is distorted as TAX stabilizes cellular microtubules and blocks mitosis progression, resulting in mitotic inhibition and cell apoptosis as well as restraint of cell division of mitotic cycle [9,10]. It has been shown that TAX has a close relation with the phosphorylation of Bcl-2, which can downregulate its anti-apoptotic ability [11]. However, acquired drug resistance happens in many patients, which is the core cause of chemotherapy failure [12]. Therapies which combine TAX with other methods have shown an increased effect in drug sensitivity of HCC patients, providing the potential possibility for TAX resistance [13]. Many scientists are still conducting research concerning cancer resistance to TAX and other chemotherapeutic drugs. However, the inner mechanism of HCC remains unclear, so profound genetic coding investigations are in urgent need [14–16].
The sineoculis homeobox homolog 1 (SIX1) gene is a member of the SIX class of homeodomain-containing transcription factor subfamily, and shares a lysine within the DNA-binding helix in the homeodomain [17]. Normally, SIX1 plays a role in different organs, including the brain, eyes, ears, and even the kidneys [18,19]. SIX1 can promote cell proliferation and survival rate, and the loss or overexpressing of this gene can cause abnormal cell growth [20–22]. Besides, S-T Fan et al. found the correlativity between the overexpression of SIX1 and metastasis of HCC cells [14].
All emerging evidences clarified that SIX1 is a potential target for the clinic treatment of HCC. However, the mechanism of SIX1 overexpression with malignant liver tumor has not been elaborated. In this investigation, we attempted to demonstrate how SIX1 regulates drug-resistance in HepG2 cells, and we expected a comprehensive vision of reactive oxygen species (ROS) and autophagy in this process.
Material and Methods
Cell culture and transfection
Human hepatocellular carcinoma cell line HepG2 was purchased from the Institute of Cell Biology, at the Chinese Academy of Sciences (Beijing, China). HepG2 cells were cultured in Dulbecco’s modified Eagles’s medium (DMEM) containing 10% fetal bovine serum (FBS) (Gibco, Garlabad, CA, USA) at 37°C with 5% CO2. Scramble-siRNA (sense: 5′-AGGTCCTCATTATGACCTGCACTTA-3′; antisense: 3′-UCGACCGUGCCUGUUUAU-5′) and SIX1 siRNA (sense: 5′-GGAGCUCACAAGGCAAUAU-3′; antisense: 3′-CCUCGAGUGUUCCGUUAUA-5′) were obtained from Shanghai Sangon Biotech Company (Shanghai, China).
The logarithmic growth phase of HepG2 cells were removed 24 hours before transfection. The cells were digested with trypsin and maintained in complete medium for resuspension, and cell suspension system was established. Cells were plated at a density of 5×10⁵ cells/well in 6-well plates for 24 hours. The original medium was discarded and substituted with fresh basal medium without serum and antibiotics three hours before transfection. Transfections were performed with scramble-siRNA or SIX1 siRNA at 37°C in 5% CO2 using Lipofectamine 2000 (Invitrogen, Carlsbad, CA, USA). The medium was replaced with complete medium after six-hour transfection.
MTT assay
Cell growth inhibition was determined using MTT (5 mg/mL, Sigma-Aldrich, Saint Louis, MO, USA) which evaluated the percentage of viable cells. The logarithmic growth phase of HepG2 cells were collected from a culture flask with 0.25% trypsin. Cells were counted and diluted into 105/mL single cell suspension. They were then seeded in 96-well plates at a density of 104/well. Cells were treated with increasing concentrations of TAX (0 nM, 1 nM, 5 nM, 10 nM, 50 nM, 100 nM). Medium (100 μL) and corresponding concentration reagents were added into the assay well, respectively, and the same volume of medium was added into the control well. The cells were incubated with different concentrations of TAX for 12, 24, 36, and 48 hours. All the groups were incubated at 37°C with 5% CO2. After treatment, the supernatant was removed and 20 μL of MTT was added to each well. The supernatant was discarded after two-hour incubation without light. Finally, the absorbance (490 nm) of 100 μL DMSO crystals was measured using an ELISA kit (Biotek, Winooski, VT, USA).
Colony formation assay
The logarithmic growth phase of HepG2 cells were collected and dispersed into single cell suspensions. Cells were seeded on a six-well plate at a density of 200 cells per well, and TAX was added after 24 hours. The incubation was conducted at 37°C and 5% CO2 for two to three weeks until it was possible to be observed with the naked eyes. After the medium was discarded, anhydrous methanol was used to fix cells for 10 minutes, and Giemsa solution was added for staining for 15 minutes. The number of colonies in each well was counted under a microscope.
Flow cytometry
Cells in divided groups were treated with different concentrations of TAX, washed with pre-cooled phosphate buffered solution (PBS), and resuspended with 500 μL of buffer. Cell samples were stained with 5 μL Annexin V-FITC (BD Biosciences, San Jose, CA, USA) at room temperature for 10 minutes. The cells were resuspended with Annexin V-FITC combined solution and stained with propidium iodide (PI, BD Pharmingen, San Jose, CA, USA). Finally, all samples were analyzed by flow cytometry.
ROS analysis
Cellular ROS contents were measured by flow cytometry. Prepared cells in divided groups were assembled into centrifuge tubes, digested with 0.25% trypsin (without EDTA). 10 μM DCFH2-DA (Sigma-Aldrich, St. Louis, MO, USA) was diluted with serum-free medium (1: 1,000), and then cultivated with cell resuspensions. After incubated at 37°C for 20 minutes, the cells were centrifuged, resuspended and washed to remove unbound DCFH2-DA. The results were analyzed at wavelength of 488 nm.
Western blot
The cell suspension was centrifuged and protein lysate was added according to the amount of precipitated cells. Protein concentration measurement was conducted with bicinchoninic acid (BCA) Kit (#232257, Pierce, Rockford, IL, USA). Proteins were subjected to electrophoresis, separated by sodium dodecyl sulfate polyacrylamide gel electrophoresis (SDS-PAGE) and transferred to nitrocellulose (NC) membrane. After being blocked for one hour at room temperature, the NC membrane was incubated with the primary antibody at 4°C overnight. Fluorescent secondary antibody diluted with blocking solution at 1: 5,000 was added to the membranes, incubated for one hour before the participation of the enhanced chemiluminescence (ECL, Thermo Scientific Pierce, Rockford, IL, USA). Images were obtained by Odyssey scanning. β-Actin was taken as the internal reference. Primary antibodies included anti-SIX1 antibody (#37910, 1: 1,000, Abcam, Cambridge, MA, USA), β-Actin (#A5441, 1: 4,000, Sigma-Aldrich, St. Louis, MO, USA), LC3 (1: 1,000; Abcam, ab62721), p62 (#12-1107, 1: 1,000; American Research Product, Belmont, MA, USA).
Statistical analysis
Experimental results were analyzed with Graph Pad Prism 5 software (GraphPad Software Inc., CA, USA). All data were performed in mean ± standard deviation, with comparisons between groups using t-test or one-way ANOVA test. A p value of <0.05 was regarded as statistically significant.
Results
TAX inhibited growth of HepG2 cells and upregulated the expression of SIX1
MTT assay results showed that TAX inhibited the proliferation of HepG2 cells in a dose and time dependent manner. At 12 hours and 24 hours, HepG2 cells treated with 10 nM, 50 nM, and 100 nM TAX showed significantly higher cell growth inhibition than 0 nM (p<0.05). Interestingly, at 36 hours and 48 hours, there was no significant difference between any dose treatments of TAX. Besides, the cell growth inhibitory effects of TAX increased significantly compared with each previous time point (p<0.05, Figure 1A). In addition, western blot results demonstrated that the expression levels of SIX1 in HepG2 cells was higher after treated with TAX. Specifically, cells treated with 1 nM, 5 nM, 10 nM, 50 nM, and 100 nM TAX showed higher SIX1 expression than those treated with no TAX (p<0.05). However, there was no significant difference among each concentration (the expression level was detected at 36 hours, Figure 1B). Besides this, the upregulation of SIX1 expression was observed to be time-dependent. However, there was no significant difference on SIX1 expression at different time points (cells were treated with 10 nM TAX, p<0.05, Figure 1C).
Figure 1.
TAX disturbed the proliferation of HepG2 and affected SIX1 expression. (A) The cell growth inhibition of HepG2 cells in different groups treated with different doses of TAX; * p<0.05 compared with the previous time, # p<0.05 compared with 0 nM group. (B) The expression of SIX1 in HepG2 cells treated with different concentrations of TAX; * p<0.05 compared with 0 nM group. (C) The expression of SIX1 in HepG2 cells treated with 10 nM TAX at different time points; * p<0.05 compared with control group.
SIX1 siRNA increased TAX sensitivity of HepG2 cells
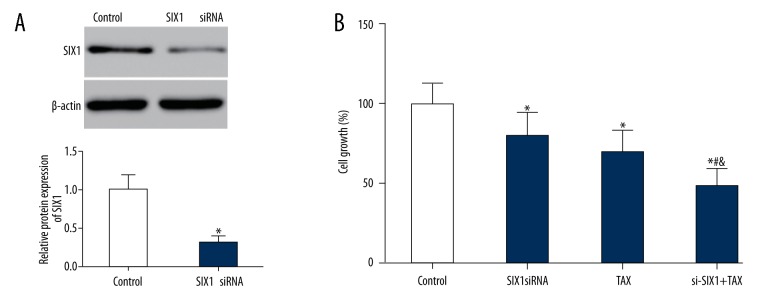
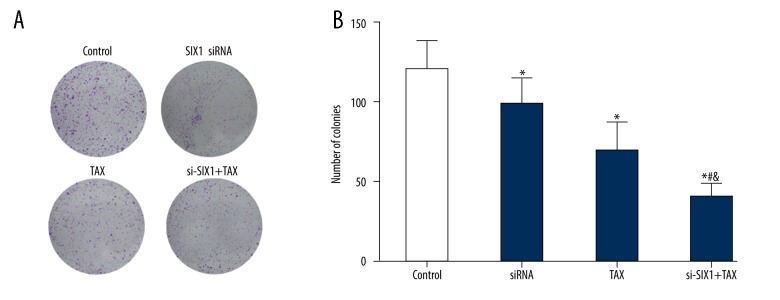
Western blot revealed that the expression of SIX1 significantly decreased in HepG2 cells transfected with SIX1 siRNA (72 hours) (p<0.05, Figure 2A). MTT assay and colony formation assay also showed an obvious cell viability reduction and proliferation inhibition in the SIX1 siRNA or/and TAX groups compared to the control group (p<0.05). More specifically, cell growth rate and number of colonies in siRNA+TAX group had a notably decline compared with those in siRNA group and TAX group (p<0.05, Figures 2B, 3). Similarly, flow cytometry results displayed a remarkable ascending cell apoptosis level in SIX1 siRNA or/and TAX group compared with the control group (p<0.05). More specifically, si-SIX1+TAX group cells showed a significantly higher apoptotic ratio than single treatment group (SIX1 siRNA group and TAX group) (p<0.05, Figure 4).
Figure 2.
SIX1 siRNA and/or TAX treatment reduced the growth of HepG2 cells. (A) SIX1 siRNA transfection resulted in significantly lower expression of SIX1 in HepG2 cells; * p<0.05 compared with control group. (B) Growth of HepG2 cells in different groups. MTT assay saw obvious cell viability reduction in the SIX1 siRNA, TAX, and si-SIX1+TAX groups compared to control group; * p<0.05 compared with control group, # p<0.05 compared with SIX1 siRNA group, & p<0.05 compared with TAX group.
Figure 3.
SIX1 siRNA and/or TAX treatment reduced HepG2 clone formation. (A) Colony formation results display the colony formation of HepG2 cells in different groups. (B) Column diagram showing the colony formation results of HepG2 cells in different groups. Colony formation assay results showed that SIX1 siRNA, TAX, and si-SIX1+TAX group cells had fewer colonies than control cells. Moreover, si-SIX1+TAX group cells showed a significantly smaller number of colonies than SIX1 siRNA group and TAX group cells; * p < 0.05 compared with control group, # p<0.05 compared with SIX1 siRNA group, & p<0.05 compared with TAX group.
Figure 4.
SIX1 siRNA and/or TAX treatment increased HepG2 cell apoptosis. (A) Flow cytometry results demonstrating the apoptosis of HepG2 cells in different groups. (B) Column diagram showing the percentage of apoptotic HepG2 cells in different groups. Flow cytometry results showed a remarkable ascending cell apoptosis level in SIX1 siRNA group, TAX group and si-SIX1+TAX group to the contrary of the control group. More specifically, si-SIX1+TAX group cells showed a significantly higher apoptotic ratio than single treatment group (SIX1 siRNA group and TAX group); * p<0.05 compared with control group; # p<0.05 compared with SIX1 siRNA group, & p<0.05 compared with TAX group.
SIX1 siRNA upregulated cell ROS level and suppressed cell proliferation
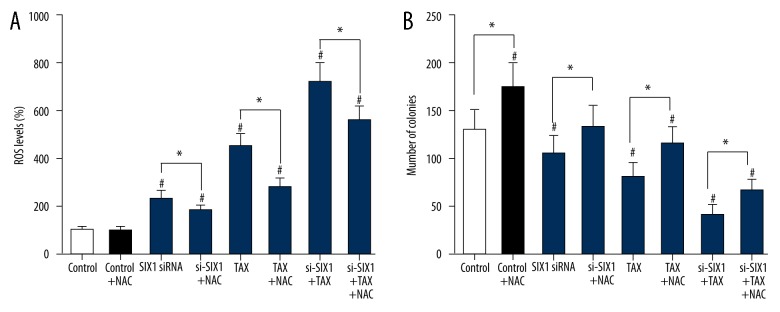
The treatment of SIX1 siRNA or/and TAX (siRNA or/and TAX groups) significantly increased the ROS level of HepG2 cells compared with the control group (p<0.05), whereas the addition of N-acetyl-L-cysteine (NAC, control+NAC group) did not evidently alter the ROS level within HepG2 cells. NAC is commonly used to identify and test ROS inducers, and to inhibit ROS. Interestingly, after NAC was added into SIX1 siRNA or/and TAX group, the promotion effect of SIX1 siRNA or/and TAX on cell ROS level was significantly reversed (p<0.05, Figure 5A). In terms of the proliferation alteration of HepG2 cells, NAC (control+NAC group) remarkably increased the number of colonies (p<0.05), whereas SIX1 siRNA or/and TAX groups witnessed obvious decrease in the number of colonies. Similarly, the addition of NAC (NAC+siRNA or/and TAX groups) notably reversed the suppression effect of SIX1 siRNA or/and TAX on the number of colonies (p<0.05, Figure 5B).
Figure 5.
SIX1 siRNA or/and TAX treatment increased ROS level and growth of HepG2 cells. (A) ROS level in HepG2 cells of different groups. The addition of SIX1 siRNA or/and TAX significantly increased the ROS level of HepG2 cells compared with control group. The addition of NAC significantly reversed the promotion effect of SIX1 siRNA or/and TAX on cell ROS level; * p<0.05 compared with NAC-free groups, # p<0.05 compared with control group. (B) The number of HepG2 cell clones in different groups. NAC significantly increased the number of colonies, whereas SIX1 siRNA or/and TAX significantly decreased the number of colonies. Similarly, the addition of NAC significantly reversed the suppression effect of SIX1 siRNA or/and TAX on the number of colonies; * p<0.05, compared with NAC-free groups; # p<0.05 compared with control group.
SIX1 siRNA combined with TAX promoted the autophagy and apoptosis of HepG2 cells
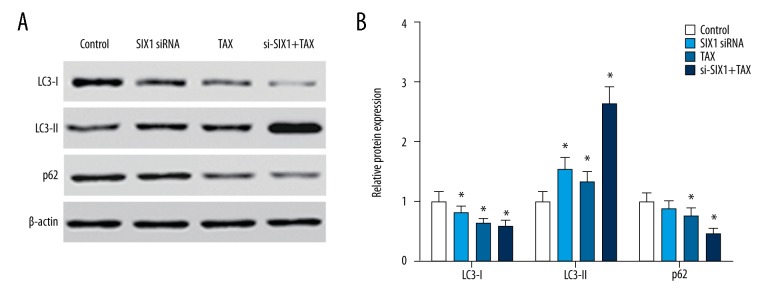
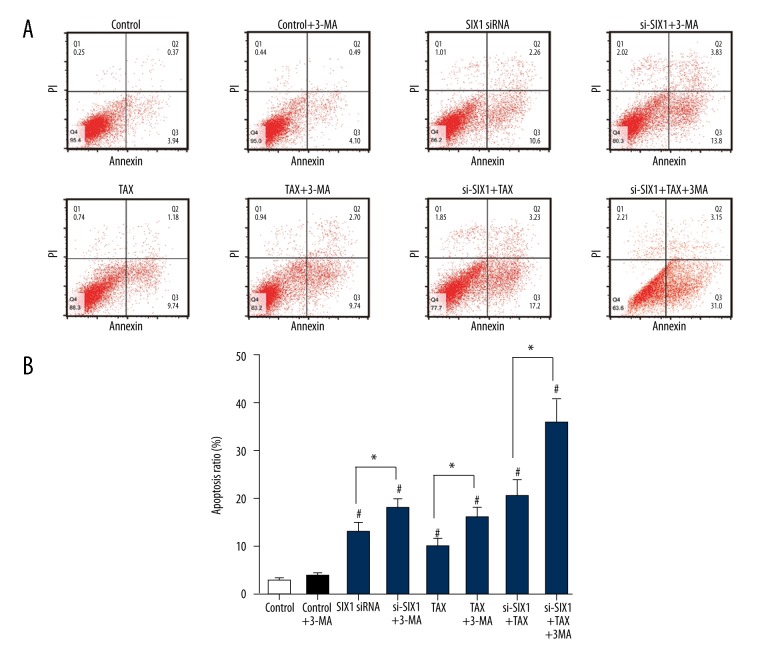
Western blot analysis showed that with the interference of SIX1 expression or/and TAX treatment, the expression of LC3-I in HepG2 cells decreased and the expression of LC3-II increased significantly (p<0.05). Meanwhile, the expression level of p62 notably declined in cells treated with TAX or si-SIX1+TAX (p<0.05, Figure 6A, 6B). In addition, flow cytometry results showed that SIX1 siRNA or/and TAX treatment was able to upregulate cell apoptosis levels (p<0.05), whereas the supplementation of cell autophagy inhibitor 3-MA alone did not alter the apoptosis level in HepG2. On the contrary, the combination of 3-MA and SIX1 siRNA or/and TAX significantly increased cell apoptosis ratios in HepG2 cells (p<0.05, Figure 7).
Figure 6.
SIX1 siRNA or/and TAX treatment significantly activated cell autophagy in HepG2 cells. (A) Results of western blot showing the expression of LC3-I, LC3-II, and p62 in HepG2 cells of different groups. (B) Grouped column diagram showing the relative autophagy-related protein expression level in HepG2 cells of different groups. After the interference of SIX1 expression or/and TAX treatment, the expression of LC3-I in HepG2 cells decreased and the expression of LC3-II increased significantly, whereas the expression level of p62 significantly decreased in cells treated with TAX and si-SIX1+TAX; * p<0.05 compared with control group.
Figure 7.
Inhibition of cell autophagy promoted cell apoptosis caused by SIX1 siRNA transfection. (A) Flow cytometry was conducted to determine the cell apoptosis of HepG2 cells in different groups. (B) The percentage of apoptotic cells in HepG2 cells in different groups shown in a column diagram. SIX1 siRNA, TAX and combination treatment appears to upregulate cell apoptosis level. The combination of 3-MA and SIX1 siRNA or/and TAX significantly increased cell apoptosis ratio in HepG2 cells; * p<0.05 compared with 3-MA-free groups, # p<0.05 compared with control group.
Discussion
SIX1 protein expression is a critical indicator in the prognosis of HCC [23,24]. Western blot assays have demonstrated that the treatment of TAX can promote SIX1 protein levels and suppress HepG2 cell development. Accumulated studies have shown that treatments for other tumors by inhibiting the transcription of SIX1 also have a significant effect on TAX sensitivity enhancement and cell proliferation control [25–27]. Other indicators such as MTT assay, colony formation assay and flow cytometry have also shown that cell viability was affected to varying extents by SIX1 siRNA combined with TAX. Further, statistical analyses have verified the significant differences between SIX1 siRNA or/and TAX group and the control group.
The inhibition of TAX on cell growth was in a time- and dose-dependent manner. No sign of restraint in cell proliferation was seen in the control group (which was regarded as 0%). Statistical analysis revealed that TAX suppressed the proliferation of HCC cells. Similar results were found in HCC cells Bel-7402, HLE and L-02 treated with TAX [28]. In addition, with the TAX treatment in HepG2, SIX1 in HCC showed a high expression. Li et al. also reported that SIX1 expression was closely related with chemo-resistance of breast cancer, and that higher SIX1 expression indicating stronger resistance to TAX [29]. In this case, we can assume that drug-resistance in HCC is closely associated with SIX1 expression.
At the genetic level, transfection with SIX1 siRNA induced a dramatic shift on relative protein expression of SIX1. MTT assay revealed that SIX1 siRNA treatment combined with TAX impaired cell activity significantly. Consistent outputs were obtained from colony formation and flow cytometry, indicating weaker competence of metastasis and greater tendency for cell apoptosis respectively. In other experiments, similar results were collected and demonstrated that the tumor growth inhibition was related to SIX1 absence [27,30].
Cell ROS data obtained via flow cytometry showed the inhibition of cell proliferation. ROS are unfavorable results of cellular aerobic respiration and metabolism, which usually are inhibited by the enzyme system of our body [31]. Once an imbalance of ROS and antioxidant systems occurs, oxidative stress is induced, leading to negative impacts on cell proliferation [32]. In our study, flow cytometry showed that ROS level in HepG2 remarkably increased after the treatment of siRNA, TAX or both, especially in siRNA+TAX group. However, the addition of NAC in siRNA+TAX group reduced ROS levels, significantly. Accordingly, severe oxidative stress induced by high ROS level significantly inhibited HepG2 cell growth and the inhibitory effect was reversed by NAC. These outcomes verified our assumption that SIX1 affects TAX by up-regulating ROS in HepG2.
Cell apoptosis and autophagy level are always a concern in cancer therapy research [33–35]. Western blot analysis of cell autophagy protein demonstrated that LC3-I and LC3-II experienced different trends after combined treatment, indicating a conversion form LC3-I to LC3-II. Previous research has shown that protein involved in autophagy produces a pro-apoptosis protein fragment and plays a role in the mitochondrial apoptosis pathway [36]. On the other hand, suppressing cell autophagy may be another option for regaining sensitivity to TAX. Flow cytometry results demonstrated that SIX1, TAX and combination treatment could all promote apoptosis in HCC, and the apoptosis level could be enhanced with the addition of cell autophagy inhibitor 3-MA.
SIX1 is an important gene in regulating cell proliferation. Several studies have discussed its influence on cancer cell growth, but fewer have concentrated on the interaction between SIX1 and HCC proliferation. In this study, we first assessed the impact of SIX1 in TAX resistance and then used various experiments to establish the inner mechanisms of this process. We also conducted different experiments with SIX1 expression on or off, proving SIX1 plays a key role in regulating cell apoptosis and autophagy as well as affecting the chemo-sensitivity in HCC. However, the exact molecular interactions were not elucidated and specific statistical quantitative correlations were not addressed. Besides, in vivo experiments are needed for more convincing conclusions. In order to fully understand the interaction of SIX1 and paclitaxel treatment in HCC, further research acquiring more data needs to be conducted.
Conclusions
In conclusion, the combined treatment using SIX1 siRNA and paclitaxel showed a promising prognosis in HCC. Therapy targeting SIX1 may be a promising potential clinical treatment in overcoming drug resistance.
Footnotes
Source of support: This study was supported by Science and Technology Projects of Hebei Province (No. 16277786D)
Conflict of interest
None.
References
- 1.Huang X, Qin J, Lu S. Up-regulation of miR-877 induced by paclitaxel inhibits hepatocellular carcinoma cell proliferation though targeting FOXM1. Int J Clin Exp Pathol. 2015;8:1515–24. [PMC free article] [PubMed] [Google Scholar]
- 2.Siegel R, Ma J, Zou Z, Jemal A. Cancer statistics, 2014. Cancer J Clin. 2014;64:9–29. doi: 10.3322/caac.21208. [DOI] [PubMed] [Google Scholar]
- 3.Lin DY, Lin SM, Liaw YF. Non-surgical treatment of hepatocellular carcinoma. J Gastroenterol Hepatol. 1997;12:S319–28. doi: 10.1111/j.1440-1746.1997.tb00516.x. [DOI] [PubMed] [Google Scholar]
- 4.Feng GW, Dong LD, Shang WJ, et al. HDAC5 promotes cell proliferation in human hepatocellular carcinoma by up-regulating Six1 expression. Eur Rev Med Pharmacol Sci. 2014;18:811–16. [PubMed] [Google Scholar]
- 5.Pei Q, Hu X, Liu S, et al. Paclitaxel dimers assembling nanomedicines for treatment of cervix carcinoma. J Control Release. 2017;254:23–33. doi: 10.1016/j.jconrel.2017.03.391. [DOI] [PubMed] [Google Scholar]
- 6.Le XF, Bast RC., Jr Src family kinases and paclitaxel sensitivity. Cancer Biol Ther. 2011;12:260–69. doi: 10.4161/cbt.12.4.16430. [DOI] [PMC free article] [PubMed] [Google Scholar]
- 7.Chun E, Lee KY. Bcl-2 and Bcl-xL are important for the induction of paclitaxel resistance in human hepatocellular carcinoma cells. Biochem Biophys Res Commun. 2004;315:771–79. doi: 10.1016/j.bbrc.2004.01.118. [DOI] [PubMed] [Google Scholar]
- 8.Frankel A, Buckman R, Kerbel RS. Abrogation of taxol-induced G2-M arrest and apoptosis in human ovarian cancer cells grown as multicellular tumor spheroids. Cancer Res. 1997;57:2388–93. [PubMed] [Google Scholar]
- 9.Brito DA, Yang Z, Rieder CL. Microtubules do not promote mitotic slippage when the spindle assembly checkpoint cannot be satisfied. J Cell Biol. 2008;182:623–29. doi: 10.1083/jcb.200805072. [DOI] [PMC free article] [PubMed] [Google Scholar]
- 10.Bharadwaj R, Yu H. The spindle checkpoint, aneuploidy, and cancer. Oncogene. 2004;23:2016–27. doi: 10.1038/sj.onc.1207374. [DOI] [PubMed] [Google Scholar]
- 11.Furukawa Y, Iwase S, Kikuchi J, et al. Phosphorylation of Bcl-2 protein by CDC2 kinase during G2/M phases and its role in cell cycle regulation. J Biol Chem. 2000;275:21661–67. doi: 10.1074/jbc.M906893199. [DOI] [PubMed] [Google Scholar]
- 12.Johnson MT, Reichley R, Hoppe-Bauer J, et al. Impact of previous antibiotic therapy on outcome of Gram-negative severe sepsis. Crit Care Med. 2011;39:1859–65. doi: 10.1097/CCM.0b013e31821b85f4. [DOI] [PubMed] [Google Scholar]
- 13.Liu C, Liu Y, Xie HG, et al. Role of three-dimensional matrix stiffness in regulating the chemoresistance of hepatocellular carcinoma cells. Biotechnol Appl Biochem. 2015;62:556–62. doi: 10.1002/bab.1302. [DOI] [PubMed] [Google Scholar]
- 14.Ng KT, Man K, Sun CK, et al. Clinicopathological significance of homeoprotein Six1 in hepatocellular carcinoma. Br J Cancer. 2006;95:1050–55. doi: 10.1038/sj.bjc.6603399. [DOI] [PMC free article] [PubMed] [Google Scholar]
- 15.Poon RT, Fan ST. Hepatectomy for hepatocellular carcinoma: patient selection and postoperative outcome. Liver Transpl. 2004;10:S39–45. doi: 10.1002/lt.20040. [DOI] [PubMed] [Google Scholar]
- 16.Lo CM, Fan ST. Liver transplantation for hepatocellular carcinoma. Br J Surg. 2004;91:131–33. doi: 10.1002/bjs.4503. [DOI] [PubMed] [Google Scholar]
- 17.Oliver G, Wehr R, Jenkins NA, et al. Homeobox genes and connective tissue patterning. Development. 1995;121:693–705. doi: 10.1242/dev.121.3.693. [DOI] [PubMed] [Google Scholar]
- 18.Kumar JP. The sine oculis homeobox (SIX) family of transcription factors as regulators of development and disease. Cell Mol Life Sci. 2009;66:565–83. doi: 10.1007/s00018-008-8335-4. [DOI] [PMC free article] [PubMed] [Google Scholar]
- 19.Laclef C, Hamard G, Demignon J, et al. Altered myogenesis in Six1-deficient mice. Development. 2003;130:2239–52. doi: 10.1242/dev.00440. [DOI] [PubMed] [Google Scholar]
- 20.Christensen KL, Patrick AN, McCoy EL, Ford HL. The six family of homeobox genes in development and cancer. Adv Cancer Res. 2008;101:93–126. doi: 10.1016/S0065-230X(08)00405-3. [DOI] [PubMed] [Google Scholar]
- 21.Li Y, Tang ZY, Ye SL, et al. Establishment of cell clones with different metastatic potential from the metastatic hepatocellular carcinoma cell line MHCC97. World J Gastroenterol. 2001;7:630–36. doi: 10.3748/wjg.v7.i5.630. [DOI] [PMC free article] [PubMed] [Google Scholar]
- 22.Ford HL, Landesman-Bollag E, Dacwag CS, et al. Cell cycle-regulated phosphorylation of the human SIX1 homeodomain protein. J Biol Chem. 2000;275:22245–54. doi: 10.1074/jbc.M002446200. [DOI] [PubMed] [Google Scholar]
- 23.Armat M, Oghabi Bakhshaiesh T, Sabzichi M, et al. The role of Six1 signaling in paclitaxel-dependent apoptosis in MCF-7 cell line. Bosn J Basic Med Sci. 2016;16:28–34. doi: 10.17305/bjbms.2016.674. [DOI] [PMC free article] [PubMed] [Google Scholar]
- 24.Kong J, Zhou X, Liu S, et al. Overexpression of sineoculis homeobox homolog 1 predicts poor prognosis of hepatocellular carcinoma. Int J Clin Exp Pathol. 2014;7:3018–27. [PMC free article] [PubMed] [Google Scholar]
- 25.Du P, Zhao J, Wang J, et al. Sine Oculis Homeobox Homolog 1 regulates mitochondrial apoptosis pathway via Caspase-7 in gastric cancer cells. J Cancer. 2017;8:636–45. doi: 10.7150/jca.16018. [DOI] [PMC free article] [PubMed] [Google Scholar]
- 26.Shi C, Zhang Z. MicroRNA-362 is downregulated in cervical cancer and inhibits cell proliferation, migration and invasion by directly targeting SIX1. Oncol Rep. 2017;37:501–9. doi: 10.3892/or.2016.5242. [DOI] [PubMed] [Google Scholar]
- 27.Wang L, Liu H. microRNA-188 is downregulated in oral squamous cell carcinoma and inhibits proliferation and invasion by targeting SIX1. Tumour Biol. 2016;37:4105–13. doi: 10.1007/s13277-015-4246-9. [DOI] [PubMed] [Google Scholar]
- 28.Zhu M, Li W, Lu Y, et al. Alpha fetoprotein antagonizes apoptosis induced by paclitaxel in hepatoma cells in vitro. Sci Rep. 2016;6:26472. doi: 10.1038/srep26472. [DOI] [PMC free article] [PubMed] [Google Scholar]
- 29.Li Z, Tian T, Hu X, et al. Six1 mediates resistance to paclitaxel in breast cancer cells. Biochem Biophys Res Commun. 2013;441:538–43. doi: 10.1016/j.bbrc.2013.10.131. [DOI] [PubMed] [Google Scholar]
- 30.Lerbs T, Bisht S, Scholch S, et al. Inhibition of Six1 affects tumour invasion and the expression of cancer stem cell markers in pancreatic cancer. BMC Cancer. 2017;17:249. doi: 10.1186/s12885-017-3225-5. [DOI] [PMC free article] [PubMed] [Google Scholar]
- 31.Al-Gubory KH, Fowler PA, Garrel C. The roles of cellular reactive oxygen species, oxidative stress and antioxidants in pregnancy outcomes. Int J Biochem Cell Biol. 2010;42:1634–50. doi: 10.1016/j.biocel.2010.06.001. [DOI] [PubMed] [Google Scholar]
- 32.Banerjee A, Banerjee V, Czinn S, Blanchard T. Increased reactive oxygen species levels cause ER stress and cytotoxicity in andrographolide treated colon cancer cells. Oncotarget. 2017;8:26142–53. doi: 10.18632/oncotarget.15393. [DOI] [PMC free article] [PubMed] [Google Scholar]
- 33.Wang B, Lu D, Xuan M, Hu W. Antitumor effect of sunitinib in human prostate cancer cells functions via autophagy. Exp Ther Med. 2017;13:1285–94. doi: 10.3892/etm.2017.4134. [DOI] [PMC free article] [PubMed] [Google Scholar]
- 34.Visagie MH, van den Bout I, Joubert AM. A bis-sulphamoylated estradiol derivative induces ROS-dependent cell cycle abnormalities and subsequent apoptosis. PLoS One. 2017;12:e0176006. doi: 10.1371/journal.pone.0176006. [DOI] [PMC free article] [PubMed] [Google Scholar]
- 35.Lee TG, Jeong EH, Kim SY, et al. Fhit, a tumor suppressor protein, induces autophagy via 14-3-3tau in non-small cell lung cancer cells. Oncotarget. 2017;8:31923–37. doi: 10.18632/oncotarget.16652. [DOI] [PMC free article] [PubMed] [Google Scholar]
- 36.Liu J, Ren H, Liu B, Zhang Q, et al. Diosmetin inhibits cell proliferation and induces apoptosis by regulating autophagy via the mammalian target of rapamycin pathway in hepatocellular carcinoma HepG2 cells. Oncol Lett. 2016;12:4385–92. doi: 10.3892/ol.2016.5301. [DOI] [PMC free article] [PubMed] [Google Scholar]


