

Abstract
Stable carbon isotope analyses of vertebrate hard tissues such as bones, teeth, and tusks provide information about animal diets in ecological, archeological, and paleontological contexts. There is debate about how carbon isotope compositions of collagen and apatite carbonate differ in terms of their relationship to diet, and to each other. We evaluated relationships between δ13Ccollagen and δ13Ccarbonate among free‐ranging southern African mammals to test predictions about the influences of dietary and physiological differences between species. Whereas the slopes of δ13Ccollagen–δ13Ccarbonate relationships among carnivores are ≤1, herbivore δ13Ccollagen increases with increasing dietary δ13C at a slower rate than does δ13Ccarbonate, resulting in regression slopes >1. This outcome is consistent with predictions that herbivore δ13Ccollagen is biased against low protein diet components (13C‐enriched C4 grasses in these environments), and δ13Ccarbonate is 13C‐enriched due to release of 13C‐depleted methane as a by‐product of microbial fermentation in the digestive tract. As methane emission is constrained by plant secondary metabolites in browse, the latter effect becomes more pronounced with higher levels of C4 grass in the diet. Increases in δ13Ccarbonate are also larger in ruminants than nonruminants. Accordingly, we show that Δ13Ccollagen‐carbonate spacing is not constant within herbivores, but increases by up to 5 ‰ across species with different diets and physiologies. Such large variation, often assumed to be negligible within trophic levels, clearly cannot be ignored in carbon isotope‐based diet reconstructions.
Keywords: browse, C3, C4, grass, methane, protein
1. INTRODUCTION
Stable carbon isotope analysis is routinely used to reconstruct consumer resource use patterns in modern, archeological, and paleontological contexts (Ben‐David & Flaherty, 2012; Cerling & Harris, 1999; Cerling et al., 2015; Crawford, McDonald, & Bearhop, 2008; Hare & Sealy, 2013). Indeed, the approach provides arguably the most direct evidence for diet and habitat use among fossil animals. For this purpose, two phases of skeletal material may be analyzed: the collagen (protein) or carbonate (mineral apatite) phase, either from bone or from teeth (typically using dentine for the former, and tooth enamel for the latter). Whereas collagen typically degrades within a few thousand years after death, depending on climatic and environmental conditions, structurally bound carbonates in enamel undergo minimal postmortem diagenetic alteration and thus reflect lifetime carbon isotope compositions of animals from, in some cases, hundreds of millions of years ago (Bocherens, Drucker, Billiou, Patou‐Mathis, & Vandermeersch, 2005; Canoville, Thomas, & Chinsamy, 2014; Cerling, Harris, & Leakey, 2005; Fricke, Rogers, Backlund, Dwyer, & Echt, 2008; Lee‐Thorp, 2000; Sealy & van der Merwe, 1985; Tütken, 2011). The carbon in collagen, however, represents a different component of the diet than that of carbonates, and the two phases are thus not directly interchangeable sources of information (Ambrose & Norr, 1993; Krueger & Sullivan, 1984; Lee‐Thorp, Sealy, & van der Merwe, 1989). Concepts explaining these differences have been debated for some time, and resolution is needed to maximize the knowledge that can be gained from analysis of either material (Clementz, Fox‐Dobbs, Wheatley, Koch, & Doak, 2009; Howland et al., 2003).
The stable carbon isotope compositions of consumer collagen and carbonates (δ13Ccollagen and δ13Ccarbonate) are usually more or less linearly related, although offsets from diet (diet‐tissue fractionation) differ (Ambrose & Norr, 1993; Howland et al., 2003; Lee‐Thorp et al., 1989; Passey et al., 2005; Tieszen & Fagre, 1993). In mammal herbivores, for example, δ13Ccollagen is roughly 5 ‰ enriched in 13C relative to the diet, but this figure is much higher (~13 to 14 ‰) for δ13Ccarbonate, resulting in a difference (often referred to as Δ13Ccollagen‐carbonate spacing) of ~9 ‰ in this animal group. Whereas body proteins, such as collagen, are synthesized mainly from dietary protein sources, structurally bound carbonate in the bioapatite derives from the bicarbonate pool of the body fluid and thus comprises a mixture of all dietary components, that is, proteins, carbohydrates, and lipids (Ambrose & Norr, 1993; Howland et al., 2003; McMahon, Fogel, Elsdon, & Thorrold, 2010; Tieszen & Fagre, 1993; Voigt, Rex, Michener, & Speakman, 2008). Hence, δ13Ccarbonate values must reflect a weighted average of the whole diet. In cases where dietary components differ isotopically, consumer δ13Ccollagen and δ13Ccarbonate values may be less strongly related, or the relationship may deviate from linearity. Lipids in particular are 13C‐depleted relative to other biochemical carbon sources (Tieszen, Boutton, Tesdahl, & Slade, 1983), and therefore, a lipid‐rich diet is expected to lead to low δ13Ccarbonate values. This observation has often been invoked to explain why Δ13Ccollagen‐carbonate spacing in carnivores is only ~4 ‰, much lower than in herbivores, as carnivores consume a greater proportion of dietary lipids (Krueger & Sullivan, 1984; Lee‐Thorp et al., 1989; O'Connell & Hedges, 2017). Accordingly, Δ13Ccollagen‐carbonate spacing has been used to infer trophic levels of fossil animals, including humans, recovered from sites where both materials retain lifetime isotopic compositions (e.g., Bocherens et al., 2017; Clementz et al., 2009).
An alternative explanation for the different δ13Ccollagen–δ13Ccarbonate relationships across mammal trophic levels invokes physiological effects rather than effects of individual diet components (Hedges, 2003). One constraint to the diet‐based hypothesis is that lipids differ in δ13C from other biochemicals by too small an amount (~2 to 3‰) to account for the observed differences in Δ13Ccollagen‐carbonate spacing between carnivores and herbivores (averaging ~5‰); Hedges (2003) published a series of mass balance simulations that supported this conclusion. The physiological hypothesis predicts relatively higher δ13Ccarbonate values for herbivores than carnivores due to the large amounts of methane (CH4) produced as a by‐product of microbial fermentation in the gastrointestinal tract of herbivores, especially ruminants (Franz et al., 2010). Methane is substantially isotopically lighter (by ~40 to 50‰ in 13C) than other materials of biogenic origin (Klevenhusen et al., 2009; Metges, Kempe, & Schmidt, 1990; Schulze, Lohmeyer, & Giese, 1998); hence, carbon loss via CH4 is predicted to result in higher δ13C values remaining in the body nutrient pool, and thus in synthesized tissues. Further, some gaseous carbon released during fermentative digestion is in the form of 13C‐enriched CO2, some of which is resorbed into body fluids which may further enrich body fluid bicarbonate and, ultimately, δ13Ccarbonate values (Hedges, 2003; Passey et al., 2005).
Early experimental tests with laboratory rodents showed that, whereas animal δ13Ccarbonate is strongly related to δ13Cdiet, relationships between δ13Ccollagen and δ13Cdiet are weaker (Ambrose & Norr, 1993; Tieszen & Fagre, 1993). In those experiments, animal δ13Ccollagen was more strongly related to δ13C values of dietary proteins, supporting the diet‐based model for observed spacing patterns. However, other controlled feeding experiments found differences in δ13Cdiet‐carbonate spacing (fractionation) across species, suggesting a physiological effect (Passey et al., 2005; Warinner & Tuross, 2009). Still, it was argued that the comparisons between species from different studies reported by Warinner and Tuross (2009) were impaired because of differences in the complexity of species’ diets in the respective original studies (Froehle, Kellner, & Schoeninger, 2010). In particular, data for rodents were derived from animals fed complex pelleted diets, which are expected to be isotopically heterogeneous and could easily account for the different diet‐δ13Ccarbonate and δ13Ccollagen–δ13Ccarbonate relationships observed in rodents compared to experiments where animals had access to more natural diets (see also Codron, Sponheimer, et al., 2012). A recent experimental study found that Δ13Cprotein‐carbonate spacing differed within a single bird species (hens) fed plant‐based (large spacing), meat‐based (smaller spacing), or omnivorous (intermediate spacing) diets (O'Connell & Hedges, 2017). Although these most recent experiments are consistent with a diet‐based explanation for patterns in δ13Ccollagen–δ13Ccarbonate relationships, the authors noted that only hens on herbivorous diets reached isotopic equilibrium with their foods and so conclusions based on their estimates of spacing for meat based and omnivorous diets were treated with caution. Additionally, because hens also produce CH4 (Tsukahara & Ushida, 2000), physiologic effects of the different diets cannot be ruled out. The complicating factor in avian cecal fermentation is that in some species dietary fiber may not be the major substrate of fermentation and hence CH4 production, but uric acid transported retrogradely from the cloaca into the caeca (Frei, Ortmann, Kreuzer, Hatt, & Clauss, 2017).
Mammalian herbivores are a diverse group of animals with an array of diets and digestive physiologies that makes them suitable for testing diet‐ and physiology‐based predictions about δ13Ccollagen–δ13Ccarbonate relationships in free‐ranging situations. Across species, diets are distributed along a browser‐grazer continuum, depending on whether diets are predominantly dicot or grass based (Clauss, Kaiser, & Hummel, 2008; Codron et al., 2007; Hofmann, 1989). Browse typically has a higher protein content than grass (Codron, Lee‐Thorp, Sponheimer & Codron, 2007a; Meissner, Zacharias, & O'Reagain, 1999; Van Soest, 1994); thus, we expect that δ13Ccollagen should be biased toward browse‐based diets. In African Savannah environments, grasses are predominantly C4, with higher δ13C values than C3 browse. Hence, we expect differences between δ13Ccollagen and δ13Ccarbonate to emerge at the C4 (lower dietary protein) end of the scale, resulting in a higher rate of increase in δ13Ccarbonate relative to δ13Ccollagen, that is, slopes >1 for this relationship, and shallower slopes for δ13Ccollagen than for δ13Ccarbonate when plotted against δ13Cdiet (see Codron, Sponheimer, et al., 2012; Codron, Codron, et al., 2012). Similar patterns are also expected based on physiology, as grass‐based diets are associated with greater levels of methanogenesis because methane production is reduced by secondary plant compounds in browse such as tannins (Archimède et al., 2011; Jayanegara, Leiber, & Kreuzer, 2012; Staerfl, Zeitz, Kreuzer, & Soliva, 2012; White & Lawler, 2002). If CH4 production does play a role, however, we expect higher δ13Ccarbonate values for ruminants compared with nonruminants such as hindgut fermenters (Cerling & Harris, 1999; Franz, Soliva, Kreuzer, Hummel, & Clauss, 2011; Franz et al., 2010). Carnivores, by contrast, consuming diets of less labile protein levels, and with less complex digestive systems, should have δ13Ccollagen–δ13Ccarbonate relationships with slopes approaching 1. We tested these predictions using data from teeth and bones of 31 southern African Savannah herbivore species, all obtained from free‐ranging animals, and in comparison with 13 sympatric carnivore, three omnivore, and one primate species from the same environment, to ensure that predicted patterns are limited to herbivores only. We treat primates as a separate set of taxa because trophic level assignations of these taxa, especially baboons (Papio ursinus), are debatable, and because they likely have different physiological, anatomical, and behavioural traits distinguishing them from the “true” herbivores (mostly ungulates) included in the dataset.
2. METHODS
2.1. Data collection
The dataset used for this study was compiled from literature data on δ13Ccollagen and/or δ13Ccarbonate values in bones and/or teeth (dentine or enamel, respectively) of southern African mammals living in various biomes throughout southern Africa (Codron, Avenant, Wigley‐Coetsee, & Codron, 2017; Codron, Brink, Rossouw, & Clauss, 2008; Codron, Lee‐Thorp, Sponheimer, de Ruiter, & Codron, 2008; Codron, Brink, Rossouw, & Clauss, Codron, et al., 2008; Lee‐Thorp et al., 1989). The sample comprises individuals from the “lowveld” Savannah (n = 142), “highveld Savannah” (n = 160), “woodland” Savannah (n = 58), grassland (n = 168), and Kalahari (n = 131) regions in the C4‐dominated interior of southern Africa including Malawi, as well as individuals from the Cape coastal (n = 35) and succulent (n = 19) regions, and the Namib Desert, Namibia (n = 8) (see original source literature and online supplementary material Table S1 for more detail on the type of sample and their sample proveniences). Much of the Cape regions do not have a dominant C4 vegetation; hence, we only included specimens from localities where C4 grasslands do occur (see, e.g., Radloff, 2008). Of these specimens, δ13Ccollagen data are available for 683, and 331 of those also have associated δ13Ccarbonate data. A further 38 individuals have δ13Ccarbonate but not δ13Ccollagen data. The dataset comprises 58 species in total, categorized across four trophic groups: herbivores (n = 40), carnivores (n = 13), omnivores (n = 3), and primates (n = 1) (Table 1).
Table 1.
Species included in this study, including average (median) δ13Ccollagen and δ13Ccarbonate values, Δ13Ccollagen‐carbonate spacing, number of specimens (n), and interquartile ranges (IQR)
| Species | %grass in diet | δ13Ccollagen | δ13Ccarbonate | Δ13Ccollagen‐carbonate | |||
|---|---|---|---|---|---|---|---|
| n | Median (IQR) | n | Median (IQR) | n | Median (IQR) | ||
| Herbivores: ruminants | |||||||
| Aepyceros melampus | 45 | 25 | −15.6 (−16.8 to −14.8) | 3 | −8.2 (−8.3 to −6.8) | 3 | 9.9 (8.5 to 10.2) |
| Alcelaphus buselaphus | 75 | 23 | −8.8 (−9.7 to −8.4) | 11 | 1.0 (0.4 to 1.4) | 11 | 10.2 (10.0 to 10.6) |
| Alcelaphus lichtensteinii | 95 | 3 | −6.2 (−6.5 to −6.2) | 3 | 1.1 (0.1 to 1.4) | 3 | 7.3 (6.3 to 7.8) |
| Antidorcas marsupialis | 33 | 60 | −18.3 (−20.3 to −16.7) | 33 | −9.6 (−11.1 to −7.9) | 28 | 8.1 (6.1 to 10.1) |
| Cephalophus natalensis | 1 | 1 | −21.5 (−21.5 to −21.5) | 1 | −13.6 (−13.6 to −13.6) | 1 | 7.9 (7.9 to 7.9) |
| Connochaetes gnou | 81 | 55 | −9.3 (−10.1 to −8.2) | 12 | 0.6 (−0.1 to 1.9) | 12 | 10.1 (9.3 to 10.7) |
| Connochaetes taurinus | 88 | 59 | −8.9 (−10.3 to −7.7) | 15 | 1.3 (0.2 to 1.8) | 15 | 10.0 (9.3 to 10.6) |
| Damaliscus pygargus phillipsi | 90 | 17 | −9.1 (−10.1 to −9.0) | 11 | 1.9 (0.5 to 2.4) | 11 | 11.3 (10.6 to 11.9) |
| Giraffa camelopardalis | 0 | 7 | −21.4 (−21.8 to −20.5) | 5 | −13.3 (−16.0 to −13.0) | 5 | 8.4 (5.8 to 8.4) |
| Hippotragus equinus | 85 | 4 | −8.6 (−9.5 to −8.4) | 3 | 1.6 (0.2 to 1.9) | 3 | 10.8 (8.7 to 12.2) |
| Hippotragus niger | 85 | 3 | −7.3 (−8.5 to −7.2) | 1 | 2.1 (2.1 to 2.1) | 1 | 9.4 (9.4 to 9.4) |
| Kobus ellipsiprymnus | 84 | 6 | −8.2 (−8.7 to −7.6) | 6 | 1.9 (1.2 to 2.5) | 5 | 10.1 (8.6 to 11.1) |
| Oryx gazella | 75 | 21 | −10.9 (−12.2 to −9.0) | 14 | −1.7 (−2.6 to −1.1) | 12 | 9.9 (8.4 to 10.6) |
| Ourebia ourebi | 90 | 1 | −13.7 (−13.7 to −13.7) | 1 | 0.7 (0.7 to 0.7) | 1 | 14.4 (14.4 to 14.4) |
| Raphicerus campestris | 34 | 10 | −20.3 (−21.4 to −19.2) | 9 | −11.9 (−12.8 to −10.8) | 9 | 8.6 (8.1 to 10.4) |
| Raphicerus melanotis | 30 | 3 | −20.3 (−20.8 to −20.3) | 3 | −14.7 (−14.9 to −14.3) | 1 | 5.6 (5.6 to 5.6) |
| Redunca arundinum | 94 | 13 | −8.1 (−9.9 to −7.4) | 10 | 1.4 (−0.1 to 2.6) | 10 | 10.3 (8.3 to 10.9) |
| Sylvicapra grimmia | 12 | 17 | −20.9 (−21.7 to −20.1) | 15 | −13.8 (−14.2 to −12.3) | 12 | 7.2 (5.7 to 7.7) |
| Syncerus caffer | 78 | 15 | −9.3 (−13.2 to −9.0) | 9 | 1.0 (−0.3 to 1.5) | 9 | 10.2 (8.7 to 11.4) |
| Tragelaphus angasii | 20 | 10 | −16.7 (−17.6 to −16.4) | 9 | −10.1 (−11.3 to −9.5) | 9 | 6.6 (6.1 to 7.2) |
| Tragelaphus oryx | 50 | 21 | −19.4 (−20.8 to −18.4) | 11 | −10.6 (−11.8 to −10.4) | 11 | 8.4 (7.9 to 9.1) |
| Tragelaphus scriptus | 10 | 17 | −22.3 (−23.1 to −21.1) | 20 | −14.4 (−15.6 to −13.9) | 13 | 6.9 (6.0 to 8.2) |
| Tragelaphus strepsiceros | 15 | 38 | −20.6 (−21.9 to −19.7) | 14 | −11.7 (−12.8 to −10.0) | 10 | 7.4 (6.1 to 8.3) |
| Herbivores: non‐ruminants | |||||||
| Ceratotherium simum | 98 | 9 | −8.5 (−9.0 to −6.1) | 3 | 0.5 (−5.4 to 0.8) | 3 | 9.4 (8.6 to 9.5) |
| Diceros bicornis | 5 | 6 | −21.5 (−21.7 to −21.4) | 3 | −14.7 (−15.2 to −13.7) | 3 | 7.5 (6.6 to 7.9) |
| Equus quagga | 90 | 51 | −10.4 (−11.6 to −9.6) | 14 | 0.6 (0.0 to 1.2) | 14 | 10.0 (7.8 to 11.3) |
| Equus zebra zebra | 95 | 8 | −10.7 (−11.7 to −9.5) | 1 | −2.0 (−2.0 to −2.0) | 1 | 7.7 (7.7 to 7.7) |
| Hippopotamus amphibius | 95 | 8 | −11.2 (−13.3 to −10.3) | 7 | −4.3 (−5.2 to −2.8) | 7 | 8.3 (7.7 to 9.2) |
| Phacochoerus aethiopicus | 95 | 2 | −12.5 (−12.8 to −12.1) | 2 | −6.2 (−6.7 to −5.6) | 2 | 6.3 (6.2 to 6.5) |
| Phacochoerus africanus | 95 | 43 | −11.0 (−11.6 to −10.3) | 12 | −0.4 (−2.0 to −0.2) | 11 | 8.8 (8.1 to 9.3) |
| Procavia capensis | 5 | 10 | −20.2 (−21.2 to −19.1) | 10 | −9.9 (−12.0 to −8.9) | 10 | 9.5 (9.2 to 10.1) |
| Carnivores | |||||||
| Canis mesomelas | 4 | −16.0 (−18.2 to −13.3) | 4 | −9.4 (−12.6 to −6.5) | 4 | 5.4 (4.9 to 6.3) | |
| Caracal caracal | 8 | −15.7 (−18.7 to −13.8) | 6 | −11.2 (−14.3 to −8.3) | 6 | 4.8 (4.6 to 5.3) | |
| Crocuta crocuta | 1 | −10.9 (−10.9 to −10.9) | 3 | −4.3 (−5.8 to −4.3) | 1 | 3.5 (3.5 to 3.5) | |
| Felis sylvestris | 3 | −13.6 (−16.3 to −12.0) | 3 | −8.8 (−11.7 to −6.9) | 3 | 4.8 (4.6 to 5.1) | |
| Genetta genetta | 1 | −13.2 (−13.2 to −13.2) | 1 | −8.6 (−8.6 to −8.6) | 1 | 4.6 (4.6 to 4.6) | |
| Leptailurus serval | 2 | −13.9 (−14.1 to −13.7) | 2 | −11.1 (−11.1 to −11.0) | 2 | 2.9 (2.6 to 3.1) | |
| Lycaon pictus | 3 | −11.7 (−11.9 to −11.7) | 3 | −6.4 (−7.2 to −5.9) | 3 | 5.3 (4.7 to 5.8) | |
| Otocyon megalotis | 6 | −17.5 (−19.5 to −15.3) | 6 | −13.3 (−16.0 to −10.3) | 6 | 4.8 (4.0 to 5.0) | |
| Panthera leo | 14 | −10.7 (−11.7 to −9.5) | 13 | −5.9 (−7.7 to −2.8) | 10 | 3.6 (3.3 to 5.0) | |
| Panthera pardus | 14 | −17.7 (−18.9 to −12.3) | 11 | −12.8 (−14.1 to −8.3) | 11 | 4.3 (3.7 to 5.0) | |
| Parahyaena brunnea | 8 | −11.0 (−11.9 to −9.7) | 8 | −7.1 (−8.7 to −5.7) | 7 | 3.6 (2.2 to 4.1) | |
| Proteles cristata | 1 | −13.3 (−13.3 to −13.3) | 1 | −8.2 (−8.2 to −8.2) | 1 | 5.1 (5.1 to 5.1) | |
| Vulpes chama | 4 | −14.0 (−14.9 to −12.6) | 4 | −7.7 (−9.3 to −7.0) | 4 | 5.2 (3.9 to 6.2) | |
| Omnivores | |||||||
| Hystrix africaeaustralis | 3 | −20.7 (−20.8 to −20.7) | 3 | −15.6 (−16.1 to −14.6) | 3 | 5.0 (4.7 to 6.1) | |
| Potamochoerus porcus | 2 | −19.1 (−19.7 to −18.5) | 2 | −12.7 (−14.6 to −10.8) | 2 | 6.4 (5.1 to 7.7) | |
| Xerus inaurus | 1 | −11.2 (−11.2 to −11.2) | 1 | −5.0 (−5.0 to −5.0) | 1 | 6.3 (6.3 to 6.3) | |
| Primates | |||||||
| Papio ursinus | 29 | −18.5 (−19.7 to −17.2) | 23 | −12.3 (−12.8 to −11.7) | 20 | 5.5 (4.8 to 6.1) | |
2.2. Data analysis
The data used includes carbon isotope compositions of both teeth (dentine collagen and enamel carbonate) and bone (collagen and apatite carbonate). These two tissues may differ in carbon isotope compositions (Melin et al., 2014; Warinner & Tuross, 2009). To ensure the data could be treated as a single sample, we compared δ13Ccollagen and δ13Ccarbonate values from teeth and bones of each species (where possible) using paired sample t‐tests. Also, because specimens in the dataset were collected at different times, we subtracted 2‰ from δ13C values of individuals that died before 1950 to account for atmospheric changes in δ13CO2 (Francey et al., 1999).
To compare relationships between δ13Ccarbonate and δ13Ccollagen across trophic groups (herbivores, carnivores, omnivores, and primates), we used reduced major axis (RMA) regression models. We treated δ13Ccarbonate as the “response” (y‐axis) variable to be consistent with other approaches in the literature (e.g., Lee‐Thorp et al., 1989), and because previous studies have predicted that physiology mainly affects δ13Ccarbonate rather than δ13Ccollagen (Hedges, 2003; O'Connell & Hedges, 2017; Passey et al., 2005). These regression models were applied to each trophic group (herbivores, carnivores, omnivores, and primates) separately, using data for all individuals, regardless of taxon, for which both δ13Ccarbonate and δ13Ccollagen data are available. We then repeated the analyses using species averages (medians) to ensure the results were not bias by inclusion of multiple taxa, and different sample sizes for each taxon; in this instance, omnivores (n = 3) and primates (n = 1) were necessarily omitted. Further, because both physiology and diet, both of which are predicted to influence animal isotope compositions, are at least in part dependent on species’ phylogenetic affiliations, we applied a phylogenetically constrained RMA to these analyses. We used a pruned version of a mammalian supertree (Fritz, Bininda‐Emonds, & Purvis, 2009), which was then correlated to our data using the phyl.RMA function of the R package phytools (Revell, 2012).
The above analyses make the explicit assumption that animal δ13Ccarbonate values are dependent on δ13Ccollagen values. While this approach is common in the literature, and provides insights into patterns of Δ13Ccarbonate‐collagen spacing, it does not explicitly test for different effects on either dataset. As our main hypothesis is that dietary differences among herbivores, that is, browsing vs grazing, affect δ13Ccarbonate and δ13Ccollagen differently, we tested models regressing either dataset on the percentage grass in the natural diet of each species (herbivores only). The latter were taken from the literature, using averages derived from field studies (Gagnon & Chew, 2000; Owen‐Smith, 2013; Skinner & Chimimba, 2005). Although carbon isotope studies have revealed differences between estimated %C4 grass in the diet when compared with data from field studies for several taxa (Cerling, Harris, & Passey, 2003; Codron et al., 2007; Sponheimer et al., 2003), due in part to differences in habitats and spatiotemporal scales investigated, the broad agreement between the two approaches means that published field data provides an independent dataset that is well‐suited to our purposes. We used GLMs to assess relationships between δ13Ccarbonate and δ13Ccollagen with %grass in each species’ natural diet separately. We also included a term describing digestion type to test for differences among ruminants (23 species) and nonruminants (8 species), and also the interaction of digestion type with %grass in the diet. We selected the best fit models from these various combinations based on the small sample corrected Akaike's Information Criterion, AICc, assuming models with ΔAICc (AICc for each model, in turn, minus the lowest AICc among all candidate models) <2 are best supported by the data (Burnham & Anderson, 2001, 2002). Phylogenetically controlled analyses of these models were performed using phylogenetic least squares regression (PGLS), employing maximum‐likelihood estimation of phylogenetic signal (lambda), in the package “caper” (Orme et al., 2013). All analyses were performed in R 3.4.2 (R Core Team, 2015).
3. RESULTS
3.1. Comparison between teeth and bone
The δ13Ccollagen of tooth dentine collagen was, on average, 1.3‰ ± 1.97 SD lower than that of bone collagen. Although the difference is statistically significant (t 29 = −3.560, p < .01), it is of fairly small magnitude in terms of degree of error (~1 to 2‰) in diet reconstructions in southern African Savannah systems (Codron, Lee‐Thorp, Sponheimer, & Codron, 2007b). The δ13Ccarbonate of tooth enamel and bone apatite carbonate differed by an even smaller magnitude (0.8‰ ± 2.15 SD higher in tooth enamel), and in this case, the difference was not significant (t 24 = 1.783, p = .088). Moreover, there was no consistent trend in terms of the difference between teeth and bone for either δ13C dataset, in that the differences were not correlated to δ13C (Pearson's r = .095, t 28 = 0.507, p = .616 for δ13Ccollagen; r = .279, t 22 = 1.361, p = .187 for δ13Ccarbonate). Thus, combining data from teeth and bones does not increase overall variability in our dataset, nor does it contribute to the strength of any relationships described below, and it is therefore appropriate to combine these data into a single dataset of collagen and carbonate for this study.
3.2. Individuals with both collagen and carbonate data
There was a strong positive relationship between δ13Ccarbonate and δ13Ccollagen in all four trophic groups (Figure 1a). Herbivores showed a higher intercept (10.692) than carnivores (4.035), reflecting the higher Δ13Ccarbonate‐collagen spacing expected for the former group (Table 2). The intercept for omnivores was similar to that of herbivores (10.631), but the sample is small (n = 6 individuals) and so 95% confidence intervals around this estimate were broad and overlapped with both herbivores and carnivores. The intercept for primates was similar to that of carnivores (5.458).
Figure 1.
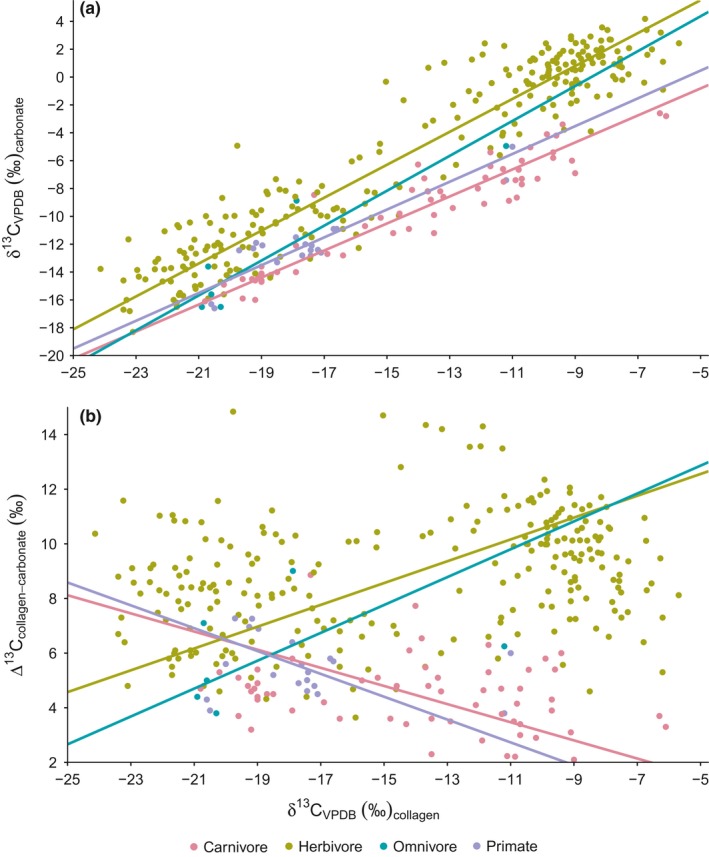
Relationships of δ13Ccarbonate (a) and Δ13Ccollagen‐carbonate spacing (b) with δ13Ccollagen among southern African mammals. Each data point represents a single individual for which both δ13Ccarbonate and δ13Ccollagen data are available. Fit lines are reduced major axis regressions
Table 2.
Parameter estimates (means with 95% CI in parentheses) from reduced major axis (RMA) regressions for relationships between δ13Ccollagen and δ13Ccarbonate (the latter treated as the “response” variable) among southern African mammals, by trophic group. Parameters are presented as means, with 95% confidence intervals in parentheses
| Group | n | r 2 | p | Intercept | Slope | Lambda |
|---|---|---|---|---|---|---|
| All individuals | ||||||
| Herbivore | 246 | .8960 | <.0001 | 11.4303 (10.6915 to 12.1692) | 1.1819 (1.1348 to 1.2309) | |
| Carnivore | 59 | .8904 | <.0001 | 4.0351 (2.8007 to 5.2696) | 0.9700 (0.8886 to 1.0589) | |
| Omnivore | 6 | .8495 | <.01 | 10.6308 (−2.1408 to 23.4024) | 1.2530 (0.7484 to 2.0978) | |
| Primate | 20 | .8322 | <.0001 | 5.4580 (1.8584 to 9.0576) | 0.9982 (0.816 to 1.221) | |
| Species averages (medians) | ||||||
| Herbivore | 31 | .9335 | <.0001 | 11.0933 (9.3921 to 12.7945) | 1.1670 (1.0582 to 1.2869) | |
| Carnivore | 13 | .7272 | <.001 | 3.1508 (−1.1924 to 7.494) | 0.8923 (0.6351 to 1.2537) | |
| Phylogenetically‐constrained RMA | ||||||
| Herbivore | 31 | .9335 | <.0001 | 11.0933 | 1.1670 | 0.0001 |
| Carnivore | 13 | .7272 | <.0001 | 3.1509 | 0.8923 | 0.0001 |
However, it was not only the intercepts of these regressions that differed across trophic groups, but the slopes as well. Whereas carnivores, omnivores, and primates all had slopes ≤1, the slope for herbivores was significantly >1 (95% CI 1.135 to 1.231; Table 2). Accordingly, whereas Δ13Ccarbonate‐collagen spacing in carnivores (and primates) was negatively related to δ13Ccollagen, these relationships were positive for herbivores (and also for omnivores, although the small sample for this group makes it difficult to properly validate this finding; Figure 1b). Although regressions of spacing on δ13C values for either tissue are spurious (because the δ13C value also appears in the estimate of spacing), an RMA applied to these data indicates that the slope for herbivores is significantly >1 (95% CI 0.354 to 0.450) and that of carnivores is <1 (−0.428 to −0.258). In both cases (Figure 1a,b), the high slope for herbivores reflects our prediction of a more than proportional increase in herbivore δ13Ccarbonate values in response to increasing dietary δ13C.
3.3. Species‐level analysis
Repeating the above analysis at species level, that is, using species’ median δ13Ccollagen and δ13Ccarbonate values, yielded similar results (Figure 2; note that omnivores and primates are not included in these analyses). Herbivores had a higher intercept than carnivores, and whereas the slope for herbivores was significantly >1 (95% CI 1.058 to 1.287), that of carnivores was ≤1 (Table 2). Similarly, herbivores again showed a positive relationship between Δ13Ccarbonate‐collagen spacing and δ13Ccollagen (95% CI for slope 0.230 to 0.442), whereas in carnivores, the relationship was negative, albeit not significant (95% CI for slope −0.569 to −0.180, p = .171).
Figure 2.
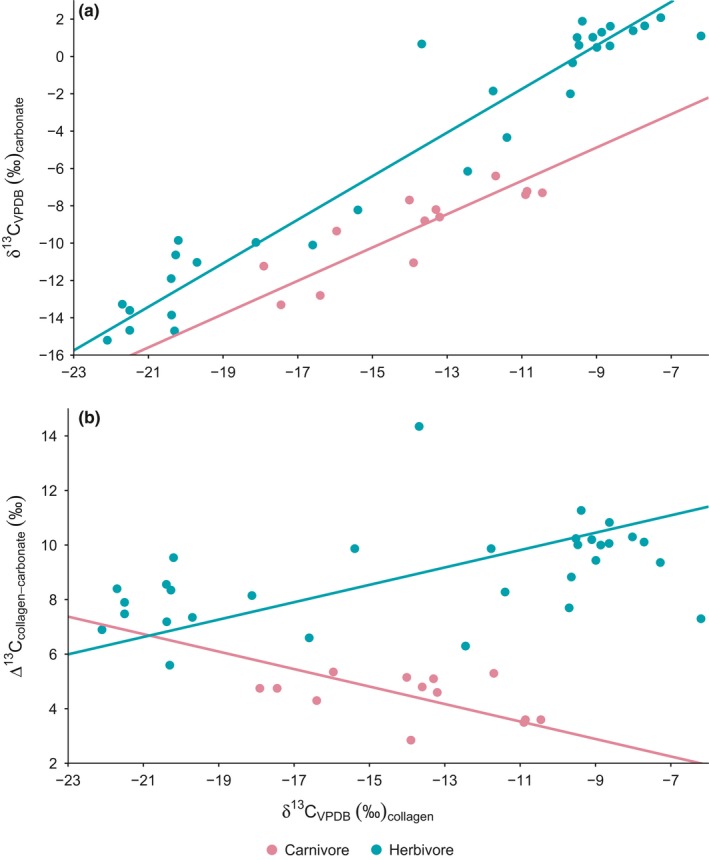
Relationships of δ13Ccarbonate (a) and Δ13Ccollagen‐carbonate spacing (b) with δ13Ccollagen across southern African mammal species. Each data point represents the medians of a species. Fit lines are reduced major axis regressions
The phylogenetically constrained analysis of these regressions revealed a very weak phylogenetic signal in the data (lambda approaching 0; Table 2), and hence similar patterns, with a slope >1 for herbivores, and <1 for carnivores.
3.4. Relationships with field data
Relationships with (presumed) levels of C4 grass in species’ diets (using literature data derived from field observations) were investigated to explicitly test for different influences on δ13Ccollagen and δ13Ccarbonate values among herbivores. Both sets of data were significantly and strongly related to %grass in the diet, regardless of whether phylogenetic history was accounted for (Table 3). In both cases (i.e., GLM and PGLS), models that took into account differences in digestive strategy (ruminant versus nonruminant) had no influence on the response of δ13Ccollagen to diet (ΔAICc for all models <2, and see Figure 3a). However, the relationship between %grass in the diet and δ13Ccarbonate did differ across the two digestive groups (Figure 3b). Actually, in the latter instance, models including the interaction between diet and digestion type were clearly best supported (ΔAICc for other models >6), indicating that both the intercept and slope for ruminants was significantly higher than those for nonruminants. In other words, these results predict not only higher δ13Ccarbonate values among ruminants than nonruminants, but also a faster rate of increase in response to increasing levels of grass in the diet.
Table 3.
Effects of % C4 grass in the natural diet on δ13Ccollagen, δ13Ccarbonate, and δ13Ccollagen‐carbonate spacing in 31 species of Savannah herbivores, based on general linear models (GLMs) and phylogenetic least squares regressions (PGLS). The models also test for an influence of digestion type (GIT, i.e., ruminant or nonruminant) on these relationships
| Model | GLM | PGLS | |||||||
|---|---|---|---|---|---|---|---|---|---|
| K | AICc | ΔAICc | r 2(adj) | K | AICc | ΔAICc | r 2 | Lambda | |
| δ13Ccollagen | |||||||||
| %grass**** + GIT + interaction | 5 | 139.82 | 0.00 | .8666 | 4 | 136.96 | 0.00 | .8799 | 0.0001 |
| %grass**** | 3 | 139.93 | 0.11 | .8561 | 2 | 137.47 | 0.51 | .8561 | 0.0001 |
| %grass**** + GIT | 4 | 140.43 | 0.60 | .8561 | 3 | 137.78 | 0.82 | .8657 | 0.0001 |
| δ13Ccarbonate | |||||||||
| %grass**** + GIT* + interaction** | 5 | 147.09 | 0.00 | .8762 | 4 | 144.23 | 0.00 | .8886 | 0.0001 |
| %grass**** + GIT | 4 | 153.91 | 6.83 | .8368 | 3 | 150.78 | 6.55 | .8497 | 0.6419 |
| %grass**** | 3 | 155.37 | 8.28 | .8261 | 2 | 150.31 | 6.08 | .8363 | 0.7316 |
| Δ13Ccollagen‐carbonate spacing | |||||||||
| %grass** + GIT + interaction* | 5 | 116.45 | 0.00 | .3808 | 4 | 113.59 | 0.00 | .4427 | 0.0001 |
| %grass** + GIT | 4 | 120.68 | 4.23 | .2495 | 3 | 118.03 | 4.44 | .2995 | 0.0001 |
| %grass** | 3 | 120.99 | 4.54 | .2293 | 2 | 118.53 | 4.94 | .2293 | 0.0001 |
r 2(adj) = r 2 adjusted for additional parameters; ****p < .0001; ***p < .001; **p < .01; *p < .05 (model structure and significance of each effect only shown in one column because results for GLM and PGLS are virtually identical).
Figure 3.
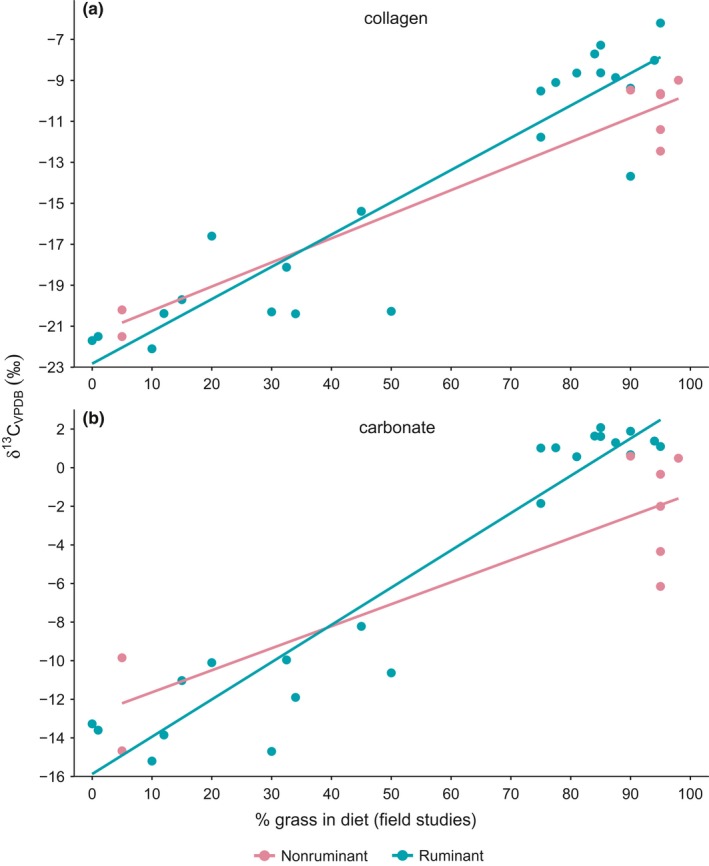
Relationships between δ13Ccollagen (a) and δ13Ccarbonate (b) among southern African herbivores with the predicted percentage of C4 grass in each species’ diet, showing differences between ruminant and nonruminant taxa
4. DISCUSSION
Relationships between mammal δ13Ccarbonate and δ13Ccollagen values differ across trophic levels, not only in terms of the well‐known differences in Δ13Ccollagen‐carbonate spacing (i.e., lower intercepts for carnivores than herbivores) but also in their slopes. Whereas slopes for carnivores approximate or include 1, and Δ13Ccollagen‐carbonate spacing remains more‐or‐less constant across the full range of diets, slopes >1 occur in herbivores and hence Δ13Ccollagen‐carbonate spacing increases with increases levels of C4 grass intake. This result is consistent with the expectation of a bias toward 13C‐depleted C3 foods in δ13Ccollagen due to the higher protein content (two‐ to threefold) of C3 browse than C4 grass (cf. Howland et al., 2003; Jim, Ambrose, & Evershed, 2004; Tieszen & Fagre, 1993), and with predicted increases in δ13Ccarbonate due to higher levels of 13C‐depleted methane production associated with grass‐rich diets (Cerling & Harris, 1999).
We cannot separate diet from physiological effects based on these data and analyses alone, but it is likely that both play a role in determining isotope compositions of collagen and carbonate, and the spacing between them. The influence of physiology is, however, supported by the different responses observed between ruminants and nonruminants in terms of δ13Ccarbonate in relation to %grass intake (Figure 3). The steeper slope for ruminants is not surprising as they produce more CH4 than large hindgut fermenters such as equids (Franz et al., 2010, 2011), and factors that result in higher rates of methane production would therefore affect ruminants to a greater extent. Nonruminant foregut fermenters (hippopotamus, Hippopotamus amphibius, in our dataset) may produce CH4 in amounts intermediate between ruminants and hindgut fermenters, as previously shown for the pygmy hippopotamus Hexaprotodon liberiensis, and collared peccary Pecari tajacu (Vendl et al., 2016). However, hippopotamus δ13Ccarbonate values presented here are within range of other nonruminant grazers in our dataset.
Previous studies have found similar Δ13Ccollagen‐carbonate spacings across trophic levels as observed here, but generally predicted this spacing to be constant within trophic levels (Clementz, 2012; Clementz et al., 2009). Our results suggest this is not the case, at least for mammal herbivores, in which variation in food quality and digestive physiology across species alter δ13Ccollagen–δ13Ccarbonate relationships in such a way that spacing does vary, and this variation can be of considerable magnitude. Considering only taxa with n > 5 individuals, the lowest average (median) Δ13Ccollagen‐carbonate spacing in our data occurred in the nyala Tragelaphus angasii (n = 9, median = 6.6‰, min–max range = 5.4 to 9.5‰), and the largest in blesbok Damaliscus pygargus phillipsi (n = 11, median = 11.3 ‰, min–max range = 10.6 to 11.9‰). There has been some debate in the literature about whether analysis of collagen or carbonate provides a better representation of an animal's diet. The wide range of spacing across species observed in this study—about one‐third of the total range of δ13C values in the system within a single trophic level—coupled with the fact we cannot yet differentiate specific effects, implies that, wherever possible, both materials should be analyzed, in agreement with suggestions of Clementz et al. (2009) and Froehle et al. (2010). Alternatively, a correction factor/s based on regression models similar to those used in our study could be applied to either source of data, but the lack of independent data for diets in many cases would limit this possibility. For instance, while our use of literature data for %grass in species’ diets could be used to parameterize models for isotopic fractionation, this approach would assume that species’ diets are fixed and unvarying, which they are not (Owen‐Smith, 1997; du Toit, 2003).
Actually, within‐species variation in diet raises an exciting possibility for future exploration: both mechanisms proposed here, that is, lower protein intake and higher CH4 production on grass‐rich diets, operate within‐ as well as between‐species (Staerfl et al., 2012; Van Soest, 1994; White & Lawler, 2002). We do not have sufficient data for any one taxon across a range of diets, for example, sampled across several habitats and/or seasons, to test predictions at the intraspecific level. However, a previous study based on serial isotope analysis of ivory of African elephants, Loxodonta africana, found that δ13Ccarbonate series in this species were less variable than δ13Ccollagen series extracted over the same time frames and time scales, that is, seasonal over several decades within individuals (Codron, Codron, et al., 2012). Those results are consistent with dietary protein effects, as elephants are well‐known to switch from protein‐rich browse‐based diets during dry periods to grass‐rich diets during rainy seasons (Codron et al., 2011; Owen‐Smith, 2013; Pretorius et al., 2012). But those results do not unequivocally support a diet effect, as the difference may reflect that carbonate has a slower turnover rate than collagen and thus did not capture the same extent of seasonal variability in diet (see Codron, Codron, et al., 2012).
One factor not considered in our study is whether C3 browse and C4 grass differ with respect to inherent δ13C variability. There is some evidence that grass δ13Clipid differs from δ13Ccarbohydrate and δ13Cprotein by a larger amount than in dicots (Dungait, Docherty, Straker, & Evershed, 2008). Such differences, if they are found to persist, could easily account for differences in Δ13Ccollagen‐carbonate spacing between trophic levels, and even within herbivores. Empirical data for compound‐specific isotope compositions of Savannah plants are needed. More so, however, controlled experiments like those of O'Connell and Hedges (2017), which explicitly test for diet‐linked physiological effects on spacing, are needed. The drawback is that such experiments are necessarily long term, given the time needed for bone to be remodeled and become equilibrated with an experimental diet/s. Nonetheless, advances in this field, and improved accuracy in paleodiet reconstructions, require that researchers trade‐off short‐ for long‐term gains.
CONFLICT OF INTEREST
None declared.
AUTHORS’ CONTRIBUTIONS
DC conceived the approach and design of the study, DC and JC conducted fieldwork and laboratory work, MC developed ideas relating to differences in methanogenesis between species and diets, TT collaborated in geochemical principles, implications for archeology/paleoecology, and insights from recent literature, DC and JC wrote the manuscript. All authors contributed critically to the drafts and gave final approval for submission.
Supporting information
ACKNOWLEDGMENTS
This project received funding from the African Origins Platform of the National Research Foundation, South Africa (Grant No 98836), the European Research Council (ERC) under the European Union's Horizon 2020 research and innovation programme (ERC CoG grant agreement No 681450), and the DST/NRF Centre of Excellence in Palaeosciences, University of the Witwatersrand, South Africa. We thank the National Museum, Bloemfontein, South African National Parks, and DETEA Free State Province, for facilitating sampling of materials, and the Stable Light Isotope Facility, Department of Archaeology, University of Cape Town for laboratory analysis. Comments and suggestions by two anonymous reviewers helped improve the quality of this manuscript, especially with regard to statistical approaches. The authors declare no conflict of interests. This study does not contain any studies with human or animal participants—all materials were obtained from carcasses found in the field or from museum collections.
Codron D, Clauss M, Codron J, Tütken T. Within trophic level shifts in collagen–carbonate stable carbon isotope spacing are propagated by diet and digestive physiology in large mammal herbivores. Ecol Evol. 2018;8:3983–3995. https://doi.org/10.1002/ece3.3786
REFERENCES
- Ambrose, S. H. , & Norr, L. (1993). Experimental evidence for the relationship of the carbon isotope ratios of whole diet and dietary protein to those of bone collagen and carbonate In Lambert J. B., & Grupe G. (Eds.), Prehistoric human bone: Archaeology at the molecular level (pp. 1–37). Berlin: Springer‐Verlag. [Google Scholar]
- Archimède, H. , Eugène, M. , Magdeleine, C. M. , Boval, M. , Martin, C. , Morgavi, D. P. , … Doreau, M. (2011). Comparison of methane production between C3 and C4 grasses and legumes. Animal Feed Science and Technology, 166–167, 59–64. https://doi.org/10.1016/j.anifeedsci.2011.04.003 [Google Scholar]
- Ben‐David, M. , & Flaherty, E. A. (2012). Stable isotopes in mammalian research: A beginner's guide. Journal of Mammalogy, 93, 312–328. https://doi.org/10.1644/11-MAMM-S-166.1 [Google Scholar]
- Bocherens, H. , Cotte, M. , Bonini, R. A. , Straccia, P. , Scian, D. , Soibelzon, L. , & Prevosti, F. J. (2017). Isotopic insight on paleodiet of extinct Pleistocene megafaunal Xenarthrans from Argentina. Gondwana Research, 48, 7–14. https://doi.org/10.1016/j.gr.2017.04.003 [Google Scholar]
- Bocherens, H. , Drucker, D. G. , Billiou, D. , Patou‐Mathis, M. , & Vandermeersch, B. (2005). Isotopic evidence for diet and subsistence pattern of the Saint‐Césaire I Neanderthal: Review and use of a multi‐source mixing model. Journal of Human Evolution, 49, 71–87. https://doi.org/10.1016/j.jhevol.2005.03.003 [DOI] [PubMed] [Google Scholar]
- Burnham, K. P. , & Anderson, D. R. (2001). Kullback‐Leibler information as a basis for strong inference in ecological studies. Wildlife Research, 28, 111–119. https://doi.org/10.1071/WR99107 [Google Scholar]
- Burnham, K. P. , & Anderson, D. R. (2002). Model selection and multimodel inference: A practical information‐theoretic approach. New York, NY: Springer‐Verlag. [Google Scholar]
- Canoville, A. , Thomas, D. B. , & Chinsamy, A. (2014). Insights into the habitat of Middle Permian pareiasaurs (Parareptilia) from preliminary isotopic analyses. Lethaia, 47, 266–274. https://doi.org/10.1111/let.12056 [Google Scholar]
- Cerling, T. E. , Andanje, S. A. , Blumenthal, S. A. , Brown, F. H. , Chritz, K. L. , Harris, J. M. , … Uno, K. T. (2015). Dietary changes of large herbivores in the Turkana Basin, Kenya from 4 to 1 Ma. Proceedings of the National Academy of Sciences of the United States of America, 112, 11467–11472. https://doi.org/10.1073/pnas.1513075112 [DOI] [PMC free article] [PubMed] [Google Scholar]
- Cerling, T. E. , & Harris, J. M. (1999). Carbon isotope fractionation between diet and bioapatite in ungulate mammals and implications for ecological and paleoecological studies. Oecologia, 120, 347–363. https://doi.org/10.1007/s004420050868 [DOI] [PubMed] [Google Scholar]
- Cerling, T. E. , Harris, J. M. , & Leakey, M. G. (2005). Environmentally driven dietary adaptations in African mammals In Ehleringer J. R., Cerling T. E., & Dearing M. D. (Eds.), A history of atmospheric CO2 and its effects on plants, animals and ecosystems (pp. 258–272). New York, NY: Springer. [Google Scholar]
- Cerling, T. E. , Harris, J. M. , & Passey, B. H. (2003). Diets of East African Bovidae based on stable isotope analysis. Journal of Mammalogy, 84, 456–470. https://doi.org/10.1644/1545-1542(2003)084<0456:DOEABB>2.0.CO;2 [Google Scholar]
- Clauss, M. , Kaiser, T. M. , & Hummel, J. (2008). The morphophysiological adaptations of browsing and grazing mammals In Gordon I. J., & Prins H. H. T. (Eds.), The ecology of browsing and grazing (pp. 149–178). Heidelberg, Germany: Springer. [Google Scholar]
- Clementz, M. T. (2012). New insight from old bones: Stable isotope analysis of fossil mammals. Journal of Mammalogy, 93, 368–380. https://doi.org/10.1644/11-MAMM-S-179.1 [Google Scholar]
- Clementz, M. T. , Fox‐Dobbs, K. , Wheatley, P. V. , Koch, P. L. , & Doak, D. F. (2009). Revisiting old bones: Coupled carbon isotope analysis of bioapatite and collagen as an ecological and palaeoecological tool. Geological Journal, 44, 605–620. https://doi.org/10.1002/gj.1173 [Google Scholar]
- Codron, J. , Avenant, N. L. , Wigley‐Coetsee, C. , & Codron, D. (2017). Carnivore stable carbon isotope niches reflect predator‐prey size relationships in African savannas. Integrative Zoology. https://doi.org/10.1111/1749-4877.12290 [DOI] [PubMed] [Google Scholar]
- Codron, D. , Brink, J. S. , Rossouw, L. , & Clauss, M. (2008). The evolution of ecological specialization in southern African ungulates: Competition or physical environmental turnover? Oikos, 117, 344–353. https://doi.org/10.1111/j.2007.0030-1299.16387.x [Google Scholar]
- Codron, D. , Brink, J. S. , Rossouw, L. , Clauss, M. , Codron, J. , Lee‐Thorp, J. A. , & Sponheimer, M. (2008). Functional differentiation of African grazing ruminants: An example of specialized adaptations to very small changes in diet. Biological Journal of the Linnaean Society, 94, 755–764. https://doi.org/10.1111/j.1095-8312.2008.01028.x [Google Scholar]
- Codron, D. , Codron, J. , Lee‐Thorp, J. A. , Sponheimer, M. , de Ruiter, D. , Sealy, J. , … Fourie, N. (2007). Diets of savanna ungulates from stable carbon isotope composition of faeces. Journal of Zoology London, 273, 21–29. https://doi.org/10.1111/j.1469-7998.2007.00292.x [Google Scholar]
- Codron, J. , Codron, D. , Lee‐Thorp, J. A. , Sponheimer, M. , Kirkman, K. , Duffy, K. J. , & Sealy, J. (2011). Landscape‐scale feeding patterns of African elephant inferred from carbon isotope analysis of feces. Oecologia, 165, 89–99. https://doi.org/10.1007/s00442-010-1835-6 [DOI] [PubMed] [Google Scholar]
- Codron, J. , Codron, D. , Sponheimer, M. , Kirkman, K. , Duffy, K. J. , Raubenheimer, E. J. , … Lee‐Thorp, J. A. (2012). Stable isotope series from elephant ivory reveal lifetime histories of a true dietary generalist. Proceedings of the Royal Society B, 279, 2433–2441. https://doi.org/10.1098/rspb.2011.2472 [DOI] [PMC free article] [PubMed] [Google Scholar]
- Codron, D. , Lee‐Thorp, J. A. , Sponheimer, M. , & Codron, J. (2007a). Nutritional content of savanna plant foods: Implications for browser/grazer models of ungulate diversification. European Journal of Wildlife Research, 53, 100–111. https://doi.org/10.1007/s10344-006-0071-1 [Google Scholar]
- Codron, D. , Lee‐Thorp, J. A. , Sponheimer, M. , & Codron, J. (2007b). Stable carbon isotope reconstruction of ungulate diet changes through the seasonal cycle. South African Journal of Wildlife Research, 37, 117–125. https://doi.org/10.3957/0379-4369-37.2.117 [Google Scholar]
- Codron, D. , Lee‐Thorp, J. A. , Sponheimer, M. , de Ruiter, D. , & Codron, J. (2008). What insights can baboon feeding ecology provide for early hominin niche differentiation? International Journal of Primatology, 29, 757–772. https://doi.org/10.1007/s10764-008-9261-x [Google Scholar]
- Codron, D. , Sponheimer, M. , Codron, J. , Newton, I. , Lanham, J. L. , & Clauss, M. (2012). The confounding effects of source isotopic heterogeneity on consumer‐diet and tissue‐tissue stable isotope relationships. Oecologia, 169, 939–953. https://doi.org/10.1007/s00442-012-2274-3 [DOI] [PubMed] [Google Scholar]
- Crawford, K. , McDonald, R. A. , & Bearhop, S. (2008). Applications of stable isotope techniques to the ecology of mammals. Mammal Review, 38, 87–107. https://doi.org/10.1111/j.1365-2907.2008.00120.x [Google Scholar]
- du Toit, J. T. (2003). Large herbivores and savanna heterogeneity In du Toit J. T., Rogers K. H., & Biggs H. C. (Eds.), The Kruger experience: Ecology and management of savanna heterogeneity (pp. 292–309). Washington, DC: Island Press. [Google Scholar]
- Dungait, J. A. J. , Docherty, G. , Straker, V. , & Evershed, R. P. (2008). Interspecific variation in bulk tissue, fatty acid and monosaccharide δ13C values of leaves from a mesotrophic grassland plant community. Phytochemistry, 69, 2041–2051. https://doi.org/10.1016/j.phytochem.2008.03.009 [DOI] [PubMed] [Google Scholar]
- Francey, R. J. , Allison, C. E. , Etheridge, D. M. , Trudinger, C. M. , Enting, I. G. , Leuenberger, M. , … Steele, L. P. (1999). A 1000‐year high precision records of δ13C in atmospheric CO2 . Tellus, 51B, 170–193. https://doi.org/10.3402/tellusb.v51i2.16269 [Google Scholar]
- Franz, R. , Soliva, C. R. , Kreuzer, M. , Hummel, J. , & Clauss, M. (2011). Methane output of rabbits (Oryctogalus cuniculus) and guinea pigs (Cavia porcellus) fed a hay‐only diet: Implications for the scaling of methane production with body mass in non‐ruminant mammalian herbivores. Comparative Biochemistry and Physiology A, 158, 177–181. https://doi.org/10.1016/j.cbpa.2010.10.019 [DOI] [PubMed] [Google Scholar]
- Franz, R. , Soliva, C. R. , Kreuzer, M. , Steuer, P. , Hummel, J. , & Clauss, M. (2010). Methane production in relation to body mass of ruminants and equids. Evolutionary Ecology Research, 12, 727–738. [Google Scholar]
- Frei, S. , Ortmann, S. , Kreuzer, M. , Hatt, K.‐M. , & Clauss, M. (2017). Digesta retention patterns in geese (Anser anser) and turkeys (Meleagris gallopavo) and deduced function of avian caeca. Comparative Biochemistry and Physiology ‐ Part A: Molecular & Integrative Physiology, 204, 219–227. https://doi.org/10.1016/j.cbpa.2016.12.001 [DOI] [PubMed] [Google Scholar]
- Fricke, H. C. , Rogers, R. R. , Backlund, R. , Dwyer, C. N. , & Echt, S. (2008). Preservation of primary stable isotope signals in dinosaur remains, and environmental gradients of the Late Cretaceous of Montana and Alberta. Palaeogeography Palaeoclimatology Palaeoecology, 266, 13–27. https://doi.org/10.1016/j.palaeo.2008.03.030 [Google Scholar]
- Fritz, S. A. , Bininda‐Emonds, O. R. P. , & Purvis, A. (2009). Geographical variation in predictors of mammalian extinction risk: Big is bad, but only in the tropics. Ecology Letters, 12, 538–549. https://doi.org/10.1111/j.1461-0248.2009.01307.x [DOI] [PubMed] [Google Scholar]
- Froehle, A. W. , Kellner, C. M. , & Schoeninger, M. J. (2010). FOCUS: Effect of diet and protein source on carbon stable isotope ratios in collagen: Follow up to Warinner and Tuross (2009). Journal of Archaeological Science, 37, 2662–2670. https://doi.org/10.1016/j.jas.2010.06.003 [Google Scholar]
- Gagnon, M. , & Chew, A. E. (2000). Dietary preferences in extant African Bovidae. Journal of Mammalogy, 81, 490–511. https://doi.org/10.1644/1545-1542(2000)081<0490:DPIEAB>2.0.CO;2 [Google Scholar]
- Hare, V. , & Sealy, J. (2013). Middle Pleistocene dynamics of southern Africa's winter rainfall zone from δ13C and δ18O values of Hoedjiespunt faunal enamel. Palaeogeography Palaeoclimatology Palaeoecology, 374, 72–80. https://doi.org/10.1016/j.palaeo.2013.01.006 [Google Scholar]
- Hedges, R. E. M. (2003). On bone collagen‐apatite‐carbonate isotopic relationships. International Journal of Osteoarchaeology, 13, 66–79. https://doi.org/10.1002/(ISSN)1099-1212 [Google Scholar]
- Hofmann, R. R. (1989). Evolutionary steps of ecophysiological adaptation and diversification of ruminants: A comparative view of their digestive system. Oecologia, 78, 443–457. https://doi.org/10.1007/BF00378733 [DOI] [PubMed] [Google Scholar]
- Howland, M. R. , Corr, L. T. , Young, S. M. M. , Jones, V. , Jim, S. , van der Merwe, N. J. , … Evershed, R. P. (2003). Expression of the dietary isotope signal in the compound‐specific δ13C values of pig bone lipids and amino acids. International Journal of Osteoarchaeology, 13, 54–65. https://doi.org/10.1002/(ISSN)1099-1212 [Google Scholar]
- Jayanegara, A. , Leiber, F. , & Kreuzer, M. (2012). Meta‐analysis of the relationship between dietary tannin level and methane formation in ruminants from in vivo and in vitro experiments. Journal of Animal Physiology and Animal Nutrition, 96, 365–375. https://doi.org/10.1111/j.1439-0396.2011.01172.x [DOI] [PubMed] [Google Scholar]
- Jim, S. , Ambrose, S. H. , & Evershed, R. P. (2004). Stable carbon isotopic evidence for differences in the dietary origin of bone cholesterol, collagen and apatite: Implications for their use in palaeodietary reconstruction. Geochimica et Cosmochimica Acta, 68, 61–72. https://doi.org/10.1016/S0016-7037(03)00216-3 [Google Scholar]
- Klevenhusen, F. , Bernasconi, S. M. , Hofstetter, T. , Bolotin, J. , Kunz, C. , & Soliva, C. R. (2009). Efficiency of monolaurin in mitigating ruminal methanogenesis and modifying C‐isotope fractionation when incubating diets composed of either C3 or C4 plants in a rumen simulation technique (Rusitec) system. British Journal of Nutrition, 102, 1308–1317. https://doi.org/10.1017/S0007114509990262 [DOI] [PubMed] [Google Scholar]
- Krueger, H. W. , & Sullivan, C. H. (1984). Models for carbon isotope fractionation between diet and bone In Turnland J. F., & Johnson P. E. (Eds.), Stable isotopes in nutrition (pp. 205–222). Washington, DC: American Chemical Society; https://doi.org/10.1021/symposium [Google Scholar]
- Lee‐Thorp, J. A. (2000). Preservation of biogenic carbon isotope signals in Plio‐Pleistocene bone and tooth mineral In Ambrose S. H., & Katzenberg M. A. (Eds.), Biogeochemical approaches to paleodietary analysis (pp. 89–115). New York, NY: Kluwer Academic/Plenum. [Google Scholar]
- Lee‐Thorp, J. A. , Sealy, J. C. , & van der Merwe, N. J. (1989). Stable carbon isotope ratio differences between bone collagen and bone apatite, and their relationship to diet. Journal of Archaeological Science, 16, 585–599. https://doi.org/10.1016/0305-4403(89)90024-1 [Google Scholar]
- McMahon, K. W. , Fogel, M. L. , Elsdon, T. S. , & Thorrold, S. R. (2010). Carbon isotope fractionation of amino acids in fish muscle reflects biosynthesis and isotopic routing from dietary protein. Journal of Animal Ecology, 79, 1132–1141. https://doi.org/10.1111/j.1365-2656.2010.01722.x [DOI] [PubMed] [Google Scholar]
- Meissner, H. H. , Zacharias, P. J. K. , & O'Reagain, P. J. (1999). Forage quality (feed value) In Tainton N. M. (Ed.), Veld management in South Africa (pp. 139–168). Pietermaritzburg, South Africa: University of Natal Press. [Google Scholar]
- Melin, A. D. , Crowley, B. E. , Brown, S. T. , Wheatley, P. V. , Moritz, G. L. , Yu, Y. , … Dominy, N. J. (2014). Technical note: Calcium and carbon stable isotope ratios as paleodietary indicators. American Journal of Physical Anthropology, 154, 633–643. https://doi.org/10.1002/ajpa.22530 [DOI] [PubMed] [Google Scholar]
- Metges, C. , Kempe, K. , & Schmidt, H.‐W. (1990). Dependents of the carbon‐isotope contents of breath carbon dioxide, milk, serum and rumen fermentation products on the δ13C value of food in dairy cows. British Journal of Nutrition, 63, 187–196. https://doi.org/10.1079/BJN19900106 [DOI] [PubMed] [Google Scholar]
- O'Connell, T. C. , & Hedges, R. E. M. (2017). Chicken and egg: Testing the carbon isotopic effects of carnivory and herbivory. Archaeometry, 59, 302–315. https://doi.org/10.1111/arcm.12253 [Google Scholar]
- Orme, D. , Freckleton, R. P. , Thomas, G. , Petzoldt, T. , Fritz, S. A. , Isaac, N. J. B. , & Pearse, W. (2013). caper: Comparative analyses of phylogenetics and evolution in R. R package version 0.5.2. Retrieved from https://CRAN.R-project.org/package=caper.
- Owen‐Smith, N. (1997). Distinctive features of the nutritional ecology of browsing versus grazing ruminants. Zeitschrift fur Säugetierkunde, 62, 176–191. [Google Scholar]
- Owen‐Smith, N. (2013). Megaherbivores In Levin S. (Ed.), Encyclopedia of biodiversity, 2nd ed. Academic Press. [Google Scholar]
- Passey, B. H. , Robinson, T. F. , Ayliffe, L. K. , Cerling, T. E. , Sponheimer, M. , Dearing, M. D. , … Ehleringer, J. R. (2005). Carbon isotope fractionation between diet, breath CO2, and bioapatite in different animals. Journal of Archaeological Science, 32, 1459–1470. https://doi.org/10.1016/j.jas.2005.03.015 [Google Scholar]
- Pretorius, Y. , Stigter, J. D. , de Boer, W. F. , van Wieren, S. E. , de Jong, C. B. , de Knegt, H. J. , … Prins, H. H. T. (2012). Diet selection of African elephant over time shows changing optimization currency. Oikos, 121, 2110–2120. https://doi.org/10.1111/j.1600-0706.2012.19680.x [Google Scholar]
- R Core Team (2015). R: A language and environment for statistical computing. Vienna, Austria: R Foundation for Statistical Computing; Retrieved from http://www.R-project.org/ [Google Scholar]
- Radloff, F. G. (2008). The ecology of large herbivores native to the coastal lowlands of the Fynbos Biome in the Western Cape, South Africa. PhD thesis, Stellenbosch University.
- Revell, L. J. (2012). Phytools: An R package for phylogenetic comparative biology (and other things). Methods in Ecology and Evolution, 3, 217–223. https://doi.org/10.1111/j.2041-210X.2011.00169.x [Google Scholar]
- Schulze, E. , Lohmeyer, S. , & Giese, W. (1998). Determination of 13C/12C‐ratios in rumen produced methane and CO2 of cows, sheep and camels. Isotopes in Environmental and Health Studies, 34, 75–79. https://doi.org/10.1080/10256019708036334 [PubMed] [Google Scholar]
- Sealy, J. C. , & van der Merwe, N. J. (1985). Isotope assessment of Holocene human diets in the southwestern Cape, South Africa. Nature, 315, 138–140. https://doi.org/10.1038/315138a0 [DOI] [PubMed] [Google Scholar]
- Skinner, J. D. , & Chimimba, C. T. (2005). The mammals of the southern African sub‐region. Cambridge: Cambridge University Press; https://doi.org/10.1017/CBO9781107340992 [Google Scholar]
- Sponheimer, M. , Lee‐Thorp, J. A. , de Ruiter, D. J. , Smith, J. M. , van der Merwe, N. J. , Reed, K. , … Marcus, W. (2003). Diets of southern African Bovidae: Stable isotope evidence. Journal of Mammalogy, 84, 471–479. https://doi.org/10.1644/1545-1542(2003)084<0471:DOSABS>2.0.CO;2 [Google Scholar]
- Staerfl, S. M. , Zeitz, J. O. , Kreuzer, M. , & Soliva, C. R. (2012). Methane conversion rate of bulls fattened on grass or maize silage as compared with the IPCC default values, and the long‐term methane mitigation efficiency of adding acacia tannin, garlic, maca and lupine. Agriculture Ecosystems & Environment, 148, 111–120. https://doi.org/10.1016/j.agee.2011.11.003 [Google Scholar]
- Tieszen, L. L. , Boutton, T. W. , Tesdahl, K. G. , & Slade, N. A. (1983). Fractionation and turnover of stable carbon isotopes in animal tissues: Implications for δ13C analysis of diet. Oecologia, 57, 32–37. https://doi.org/10.1007/BF00379558 [DOI] [PubMed] [Google Scholar]
- Tieszen, L. L. , & Fagre, T. (1993). Effect of diet quality and composition on the isotopic composition of respiratory CO2, bone collagen, bioapatite, and soft tissues In Lambert J. B., & Grupe G. (Eds.), Prehistoric human bone: Archaeology at the molecular level (pp. 121–155). Berlin: Springer‐Verlag; https://doi.org/10.1007/978-3-662-02894-0 [Google Scholar]
- Tsukahara, T. , & Ushida, K. (2000). Effects of animal or plant protein diets on cecal fermentation in guinea pigs (Cavia porcellus), rats (Rattus norvegicus) and chicks (Gallus gallus domesticus). Comparative Biochemistry and Physiology ‐ Part A: Molecular & Integrative Physiology, 127, 139–146. https://doi.org/10.1016/S1095-6433(00)00244-0 [DOI] [PubMed] [Google Scholar]
- Tütken, T. (2011). The diet of sauropod dinosaurs – Implications from carbon isotope analysis of teeth, bones, and plants In Klein N., Remes K., Gee C. T., & Sander P. M. (Eds.), Biology of the Sauropod Dinosaurs: Understanding the life of giants (pp. 57–79). Bloomington, IN: Indiana University Press. [Google Scholar]
- Van Soest, P. J. (1994). Nutritional ecology of the ruminant, 2nd ed. New York: Comstock, Ithaca. [Google Scholar]
- Vendl, C. , Frei, S. , Dittmann, M. T. , Furrer, S. , Ortmann, S. , Lawrenz, A. , … Clauss, M. (2016). Methane production by two non‐ruminant foregut‐fermenting herbivores: The collared peccary (Pecari tajacu) and the pygmy hippopotamus (Hexaprotodon liberiensis). Comparative Biochemistry and Physiology ‐ Part A: Molecular & Integrative Physiology, 191, 107–114. https://doi.org/10.1016/j.cbpa.2015.09.021 [DOI] [PubMed] [Google Scholar]
- Voigt, C. C. , Rex, K. , Michener, R. , & Speakman, J. (2008). Nutrient routing in omnivorous animals tracked by stable carbon isotopes in tissue and exhaled breath. Oecologia, 157, 31–40. https://doi.org/10.1007/s00442-008-1057-3 [DOI] [PubMed] [Google Scholar]
- Warinner, C. , & Tuross, N. (2009). Alkaline cooking and stable isotope tissue‐diet spacing in swine: Archaeological implications. Journal of Archaeological Science, 36, 1690–1697. https://doi.org/10.1016/j.jas.2009.03.034 [Google Scholar]
- White, R. H. , & Lawler, J. P. (2002). Can methane suppression during digestion of woody and leafy browse compensate for energy costs of detoxification of plant secondary compounds? A test with muskoxen fed willows and birch. Comparative Biochemistry and Physiology ‐ Part A: Molecular & Integrative Physiology, 133, 849–859. https://doi.org/10.1016/S1095-6433(02)00152-6 [DOI] [PubMed] [Google Scholar]
Associated Data
This section collects any data citations, data availability statements, or supplementary materials included in this article.
Supplementary Materials