Abstract
G protein-coupled receptors regulate diverse aspects of T cell activity and effector function. Recently, we showed that GPR174 mediates the suppression of T cell proliferation in vitro induced by the polar lipid lysophosphatidylserine (LysoPS). Here, we investigated the in vivo activity of this pathway and characterized the mechanisms involved. Using in vivo models of T cell proliferation induced by sublethal irradiation or regulatory T cell depletion, we show that GPR174 expression can constrain T cell proliferation. In vitro experiments established that Gαs G proteins are needed for LysoPS/GPR174-mediated suppression of T cell proliferation. Mechanistically, LysoPS acts via GPR174 and Gαs to suppress IL-2 production by activated T cells and limit upregulation of the activation markers CD25 and CD69. Together, our findings identify GPR174 as an abundantly expressed Gαs-dependent receptor that can negatively regulate naive T cell activation.
Keywords: Lysophosphatidylserine, G protein-coupled receptors, GPR174, T cell, proliferation, IL-2
BLURB FOR ETOC
Lysophosphatidylserine (LysoPS) can suppress T cell proliferation via GPR174. Here, we show that GPR174 negatively regulates T cell proliferation in vivo using models of homeostatic proliferation and regulatory T cell depletion. Mechanistically, LysoPS reduced early T cell activation and IL-2 production, and required G(alpha)s G-protein subunits to mediate these effects.
INTRODUCTION
In addition to the T cell receptor (TCR) and co-stimulatory surface molecules, various signaling inputs can act to determine the magnitude of T cell activation and proliferation. Over 20 years ago, Bellini and Bruni found that a phosphatidylserine metabolite, lysophosphatidylserine (LysoPS), could act to inhibit human T cell proliferation in vitro by an undefined mechanism.1 Recently, receptors for LysoPS were identified by Inoue and colleagues who developed cell-based reporter assays for detecting G protein-coupled receptor (GPCR) activity and coupling to most G protein subunits.2 They showed that four mouse GPCRs could respond to LysoPS: GPR34, GPR174, P2RY10, and P2RY10-L (the latter is a pseudogene in humans). This cell-based reporter assay indicated that GPR34 can couple to Gαi-containing heterotrimeric G-proteins, whereas the latter three receptors are able to couple to Gα12 and/or Gα13.
The potential importance of these receptors, all of which are located on the X-chromosome, is highlighted by genetic association studies that identified linkages of GPR174 to Grave’s disease and Addison’s disease,3–5 and of P2RY10 to rheumatoid arthritis.6 We have studied the functions of these LysoPS receptors in mouse models, and recently reported that GPR174 can act in a receptor-selective manner to intrinsically limit the generation and activity of Treg cells.7 Naive and some effector subsets of T cells also express high levels of GPR174. In vitro, we observed that LysoPS inhibition of T cell proliferation occurred in a GPR174-dependent manner.7 However, the relevance and mechanisms involved in this interaction have remained unclear. In this study, we characterized the GPR174-dependent suppression of T cell proliferation using in vivo models of T cell proliferation and in vitro T cell activation assays in the presence of LysoPS.
RESULTS AND DISCUSSION
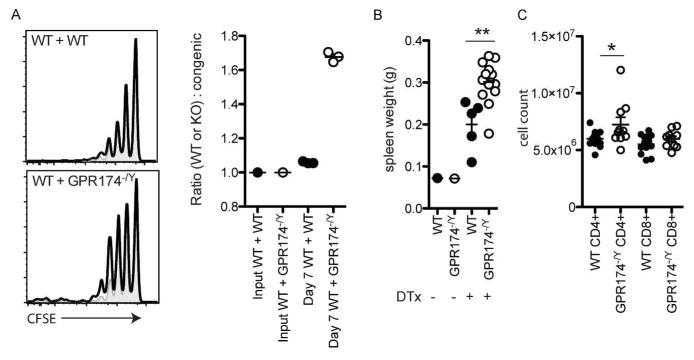
To test whether GPR174-deficiency affected T cell proliferation in vivo, we used models of homeostatic and antigen-induced proliferation. In mice rendered lymphopenic by a sublethal dose of irradiation, adoptively transferred T cells undergo lymphopenia-induced homeostatic proliferation. When equal numbers of CFSE-labeled wild-type or Gpr174−/Y (CD45.2+) and congenically distinct wild-type (CD45.1/2+) naive CD8+ T cells were transferred into recipients at one day post-radiation, an increased extent of Gpr174−/Y cell division was observed seven days later (Fig. 1a). This corresponded with the recovery of a greater number of Gpr174−/Y cells compared to co-transferred wild-type (CD45.1/2+) cells (Fig. 1a). In a second model, we bred cohorts of Gpr174−/Y and wild-type mice that carried a Foxp3-DTR transgene and ablated all Treg cells by the injection of diphtheria toxin (DT).8 Treg cell ablation results in the self-antigen-driven T cell proliferation of conventional CD4+ and CD8+ T cells prior to the development of lethal autoimmunity ~2 weeks after DT treatment.9 In Gpr174−/Y mice, Treg cell ablation resulted in greater splenomegaly (Fig. 1b) and a significantly increased accumulation of CD4+ T cells one week after DT injection (Fig. 1c). These data establish a role for GPR174 in restraining T cell proliferation in vivo.
Figure 1.
GPR174 constrains T cell proliferation in vivo. (a) To assess homeostatic proliferation, a 1:1 mixture of wild-type (CD45.1/2+; shaded gray plots) and either wild-type (CD45.2+; upper left panel; open solid line) or Gpr174−/Y (CD45.2+; lower left panel; open solid line) naive CD8+ T cells were labeled with CFSE. A total of 1×10⁶ T cells were transferred into CD45.1+ recipient mice that had been irradiated the day before with 600 cGy irradiation. Homeostatic proliferation was assessed based on the CFSE dilution profile (left) and ratio of wild-type to wild-type or Gpr174−/Y cells recovered in the spleen of recipient mice seven days after transfer was determined (right). (b–c) To assess endogenous T cell proliferation in a Treg cell ablation model, cohorts of wild-type and Gpr174−/Y mice that expressed a Foxp3-DTR transgene were treated with diphtheria toxin intrapetironeally with an initial dose of 20 μg kg−1 on day 0, and then with 5 μg kg−1 on days 2 and 4. Spleen weights (b) and numbers of CD4+ and CD8+ T cells in the spleen (c) were quantified on day 7; * P < 0.05; ** P < 0.01. Data are representative of two independent experiments; each dot represents a mouse.
Immunization-induced T cell responses were tested using GPR174-deficient OT-II TCR transgenic T cells. We co-transferred CFSE-labeled Gpr174−/Y (CD45.2+) and wild-type (CD45.1/2+) OT-II T cells into congenically distinct (CD45.1+) recipient mice. The next day, mice were immunized with sheep red blood cells conjugated to ovalbumin10 or ovalbumin in alum. In these settings, Gpr174−/Y and wild-type OT-II T cells were found to have proliferated similarly three days post-immunization (7 and data not shown) suggesting that either the inflammatory setting or the relatively strong ovalbumin–OT-II TCR signal may overcome the influence of GPR174. Additionally, the availability of endogenous GPR174 ligands, which may include LysoPS and yet to be identified molecules, may be affected by the inflammatory context.
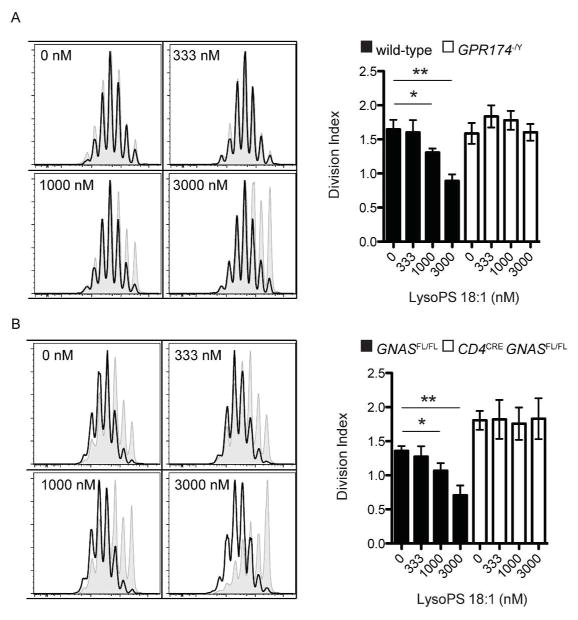
We next sought to characterize the mechanism downstream of GPR174 that constrained T cell proliferation. As GPR174 was first reported to be a Gα13-coupled GPCR,2 we generated CD4creGna12−/−Gna13fl/fl mice that lacked expression of both of these G-protein subunits. However, wild-type and CD4creGna12−/−Gna13fl/fl T cells proliferated equivalently in vitro with stimulation by anti-CD3 and anti-CD28 (data not shown), which suggested that GPR174 coupling to another G-protein subunit might mediate the suppression of T cell proliferation. Another study that used transfected CHO cells suggested that GPR174 may be unique among LysoPS receptors in its ability to couple to Gαs-containing heterotrimeric G-proteins.11 The suppression of wild-type, but not Gpr174−/Y naive CD4+ T cell proliferation can be observed in vitro when micromolar concentrations of LysoPS are present (Fig. 2a). When naive CD4+ T cells lacking expression of Gnas, which encodes Gαs, were cultured similarly, they showed a loss of proliferation inhibition in the presence of LysoPS (Fig. 2b). These observations suggest that LysoPS suppression of T cell proliferation requires GPR174 signaling through Gαs. We note that the increased baseline T cell proliferation of Gαs-deficient cells may indicate the presence of other Gαs-dependent proliferation inhibitory factors in the cultures.
Figure 2.
Suppression of T cell proliferation by LysoPS requires GPR174 and Gαs. (a) Sorted naive CD4+ T cells were labeled with CFSE and incubated with plate-bound anti-CD3 and anti-CD28 for three days. On the left, histograms show the proliferation of wild-type (shaded, gray) and Gpr174−/Y (solid line, open) T cells cultured in the presence of the indicated concentration of 18:1 LysoPS. On the right, the division index of the cells is shown. (b) Experiments were carried out as in (A), except with Cd4creGnasfl/fl naive CD4+ T cells; * P < 0.05; ** P < 0.01. Data are representative of three independent experiments. Error bars indicate standard deviation for triplicate measurements.
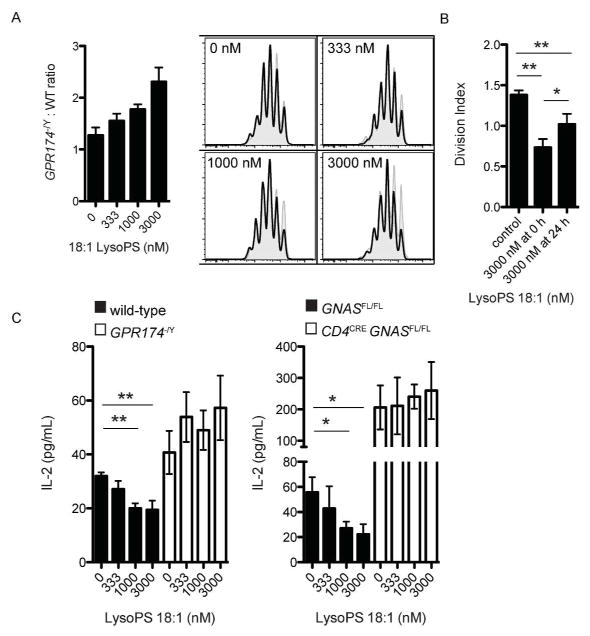
In co-cultures of wild-type and Gpr174−/Y T cells, LysoPS could intrinsically suppress the proliferation of wild-type, but not Gpr174−/Y cells (Fig. 3a). The inhibition of proliferation was greatest when LysoPS was added to cultures of T cells prior to activation compared to 24 h post-activation, suggesting that LysoPS affected very early events involved in T cell activation (Fig. 3b). Additionally, we noted that the suppression of wild-type T cell proliferation by LysoPS was weaker in co-cultures with Gpr174−/Y T cells (Fig. 3a) than in cultures of wild-type T cells alone (Fig. 2a), indicating that the generation of trans-acting factors was inhibited by LysoPS. Indeed, we found that LysoPS dose-dependently reduced IL-2 production by T cells in a GPR174- and Gαs-dependent manner (Fig. 3c). Therefore, the suppression of IL-2 production accounts for some, but not all of the T cell proliferation-inhibitory activity of LysoPS.
Figure 3.
LysoPS limits IL-2 production and intrinsically suppresses CD4+ T cell proliferation. (a) Co-cultures of wild-type (CD45.1+; shaded, gray histograms) and Gpr174−/Y (CD45.2+; solid line, open) naive CD4+ T cells were labeled with CFSE and activated with plate-bound anti-CD3 and anti-CD28 for three days. Cells were initially mixed at a 1:1 ratio, and the ratio of Gpr174−/Y -to-wild-type cells on day three is shown for cultures with the indicated concentration of LysoPS (left) along with representative histograms (right). (b) Wild-type naive CD4+ T cells were cultured for three days as in (A); LysoPS was added at the start of the cultures or 24 h after activation. (c) IL-2 production by naive CD4+ T cells of the indicated genotype was measured by ELISA 24 h after activation in the presence of the indicated concentration of 18:1 LysoPS; * P < 0.05; ** P < 0.01. Data are representative of three independent experiments. Error bars indicate standard deviation for triplicate measurements.
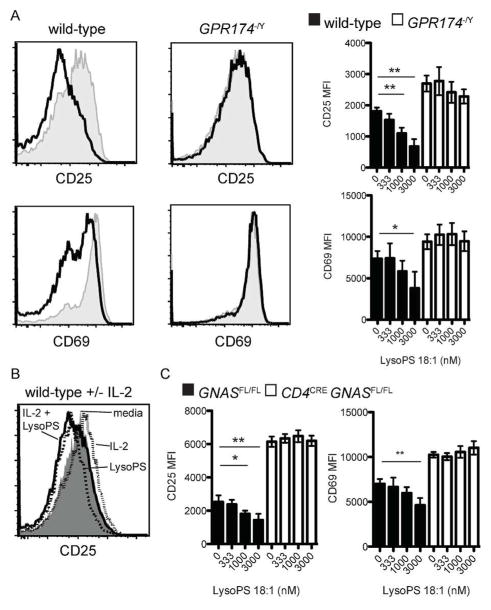
Analysis of T cell activation marker expression 24 h post-activation showed that LysoPS repressed the anti-CD3- and anti-CD28-induced upregulation of both CD25 and CD69 in wild-type, but not Gpr174−/Y T cells (Fig. 4a). Although CD25 levels can be affected by the presence of IL-2, wild-type cells cultured in the presence of LysoPS and saturating amounts of IL-2 still showed reduced CD25 levels (Fig. 4b). These effects of LysoPS also required Gαs (Fig. 4c) and we noted elevated baseline levels of CD25 and CD69 in Gαs-deficient cells, which was analogous to the elevated baseline proliferation and IL-2 production. Overall, these observations are consistent with LysoPS suppressing T cell proliferation via GPR174 and Gαs by inhibiting IL-2 production and affecting additional pathways involved in T cell activation.
Figure 4.
LysoPS suppresses early T cell activation via GPR174 and Gαs. (a) Levels of CD25 and CD69 were determined by flow cytometry 24 after activation of naive CD4+ T cells incubated with plate-bound anti-CD3 and anti-CD28 for three days.. On the left, histograms of cells activated without LysoPS (gray, shaded) or in the presence of 3 μM 18:1 LysoPS are shown; MFI values for cells cultured with the indicated LysoPS concentrations are shown on the right. (b) Levels of CD25 expression are shown for cells activated as in (a) for 24 h in the presence of media alone (gray, shaded), media with 1000 U IL-2 (dotted line, open), media with 3 μM 18:1 LysoPS (dashed line, open), or media with 3 μM 18:1 LysoPS and 1000 U IL-2 (solid line, open). (c) Levels of CD25 and CD69 expression were measured as in (a) for Cd4creGnasfl/fl naive CD4+ T cells; * P < 0.05; ** P < 0.01. Data are representative of three independent experiments. Error bars indicate standard deviation for triplicate measurements.
Recently, Shinjo and colleagues also reported that LysoPS suppressed IL-2 production by T cells via GPR174 using knockout mice and LysoPS receptor-selective forms of LysoPS.12 Interestingly, they observed increased generation of LysoPS after T cell activation and speculated that it may account for higher baseline IL-2 production by GPR174-deficient cells. Considered in the context of our findings using Gαs-deficient cells, LysoPS represents one of at least several Gαs-dependent ligands produced in T cell cultures that can affect T cell activation. To better understand the roles of GPR174 and other LysoPS receptors in homeostasis and an immune response, it will be important to identify the most potent endogenous GPR174 ligands and enzymes responsible for their generation in future studies.
In accord with our findings for LysoPS and GPR174, prostaglandin E2 signals via EP2 and EP4 to Gαs in T cells to suppress T cell IL-2 production and proliferation.13,14 However, prostaglandin E2 can promote Th1 and Th17 effector responses,15,16 whereas LysoPS signaling via GPR174 has shown more pronounced effects on baseline Treg cell activity and numbers.7 Whether the ability of GPR174 to also couple with Gα13 contributes to the differing activities of these receptors should be tested in future work.
Our findings and those of others11,12 suggest that GPR174–Gαs signaling triggers elevated cyclic AMP levels and protein kinase A (PKA) activity, which mediate suppression of T cell proliferation and IL-2 production. The mechanism whereby increased cyclic AMP levels cause these effects are complex, but may involve effects on cell cycle regulators of the G1→S transition17 and transcription factors bound to the IL-2 locus, such as CREB and CREM/ICER,18,19 respectively. Moreover, signaling studies have shown that cyclic AMP and PKA can act to antagonize proximal TCR signaling, for example by increasing Csk and decreasing Lck activity, by antagonizing NFAT, and by antagonizing Raf1.20 Future experiments will be needed to determine the extent to which these pathways are engaged during GPR174-Gαs signaling. Cyclic AMP and PKA can also antagonize STAT5 signaling, which could potentially contribute to GPR174-mediated repression of IL-2 responsiveness.21 Finally, as antagonists of Gαs-coupled receptors for adenosine and prostaglandin E2 are under consideration as immuno-oncology agents,22,23 studies of GPR174 and LysoPS bioavailability in the context of tumors are warranted. In conclusion, our study establishes GPR174 as an abundantly expressed receptor that can intrinsically modulate conventional T cell activation and proliferation by coupling to Gαs-containing heterotrimeric G-proteins.
METHODS
Mice and reagents
C57BL/6J wild-type (CD45.2+) and congenically distinct wild-type (BoyJ; CD45.1+) mice were from Jackson Labs. Gpr174−/Y mice were generated at UCSF as described previously.7 Cd4creGnasfl/fl and control Cd4creGnasfl/+ bone marrow (both CD45.2+) was obtained from Eyal Raz at UCSD and used to reconstitute irradiated recipients (CD45.1+).24 Foxp3-DTR mice were generated in the Rudensky lab8 and bred with Gpr174−/Y mice at UCSF; we note that both the Foxp3-DTR allele and Gpr174 are on the X-chromosome, and recombination events were identified among male progeny that were Foxp3DTR/Y Gpr174−/Y.
The 18:1 LysoPS was obtained from Avanti Polar Lipids. Recombinant IL-2 was a gift from the Lanier lab (UCSF). Flow cytometry antibodies were purchased from Biolegend or Tonbo. Anti-CD3 and anti-CD28 antibodies used for T cell stimulation were from eBioscience.
Homeostatic proliferation
To monitor homeostatic proliferation using a well-established model,25 CD45.1+ male BoyJ mice were treated with 600 cGy irradiation on day −1. The next day (day 0), naive CD8+ T cells were isolated from donor male mouse splenocytes and lymph nodes by FACS. Naive CD8+ T cells were CD8+CD25−CD44lowCD62Lhigh and sorted to greater than 99% purity using a FACS Aria sorter. Sorted T cells were labeled with 5 μM CFSE in PBS with 1% FBS at room temperature for 10 min. A total of 1.0×10⁶ naive CD8+ T cells from CD45.1/2+ wild-type donors (5.0×10⁵) and either CD45.2+ wild-type or Gpr174−/Y donors (5.0×10⁵ cells) were injected intravenously into irradiated recipients. On day 7, splenocytes of recipient mice were isolated and analyzed by flow cytometry to determine the extent of proliferation of the transferred cells based on CFSE dilution and the ratios of CD45.1/2+-to-CD45.2+ transferred cells.
In vitro T cell cultures
For all in vitro T cell assays, naive CD4+CD25−CD44lowCD62Lhigh T cells were used. T cells were enriched from total splenocytes and lymph node cells using a FACS Aria sorter to greater than 99% purity. After sorting, cells were labeled with CFSE as described above. For all assays, a total of 4.0×10⁵ naive CD4+ T cells were plated in 24-well plates coated with anti-CD3 (2 μg mL−1) and anti-CD28 (2 μg mL−1). Cells were cultured in standard RPMI media supplemented with 10% FBS, penicillin–streptomycin, 2-mercaptoethanol, and L-glutamine. Cell division was assessed based on CFSE dilution 72 h later. IL-2 production and cell surface marker levels were measured 24 after T cell activation.
ELISA
Levels of IL-2 in cell culture supernatants were measured 24 h after T cell activation using a Ready-Set-Go ELISA kit (eBioscience) according to the manufacturer’s instructions. Cells were cultured and activated in vitro as described above.
Statistical analyses
Flow cytometry data were analyzed using FlowJo software. The CFSE analysis module was used to calculate the cell division index. For statistical calculations, GraphPad Prism was used to run Student t-tests to detect between-group differences; P < 0.05 was used as a threshold for significance. All assays were run multiple times and error bars show the standard deviation of triplicate measurements.
Acknowledgments
This study was supported by grants to Jason Cyster from the Howard Hughes Medical Institute and National Institute of Health (R01 AI074847). The authors would like to thank Erick Lu, Hayakazu Sumida, Jinping An, and Brian Laidlaw for providing technical assistance and mouse colony care.
Footnotes
CONFLICTS OF INTEREST
The authors declare that they have no conflicts of interest related to this study.
References
- 1.Bellini F, Bruni A. Role of a serum phospholipase A1 in the phosphatidylserine-induced T cell inhibition. FEBS Lett. 1993;316:1–4. doi: 10.1016/0014-5793(93)81724-e. [DOI] [PubMed] [Google Scholar]
- 2.Inoue A, Ishiguro J, Kitamura H, et al. TGFalpha shedding assay: an accurate and versatile method for detecting GPCR activation. Nat Methods. 2012;9:1021–1029. doi: 10.1038/nmeth.2172. [DOI] [PubMed] [Google Scholar]
- 3.Chu X, Shen M, Xie F, et al. An X chromosome-wide association analysis identifies variants in GPR174 as a risk factor for Graves’ disease. J Med Genet. 2013;50:479–485. doi: 10.1136/jmedgenet-2013-101595. [DOI] [PMC free article] [PubMed] [Google Scholar]
- 4.Napier C, Mitchell AL, Gan E, et al. Role of the X-linked gene GPR174 in autoimmune Addison’s disease. J Clin Endocrinol Metab. 2015;100:E187–190. doi: 10.1210/jc.2014-2694. [DOI] [PubMed] [Google Scholar]
- 5.Szymanski K, Miśkiewicz P, Pirko K, et al. rs3827440, a nonsynonymous single nucleotide polymorphism within GPR174 gene in X chromosome, is associated with Graves’ disease in Polish Caucasian population. Tissue Antigens. 2014;83:41–44. doi: 10.1111/tan.12259. [DOI] [PubMed] [Google Scholar]
- 6.Okada Y, Wu D, Trynka G, et al. Genetics of rheumatoid arthritis contributes to biology and drug discovery. Nature. 2014;506:376–381. doi: 10.1038/nature12873. [DOI] [PMC free article] [PubMed] [Google Scholar]
- 7.Barnes MJ, Li CM, Xu Y, et al. The lysophosphatidylserine receptor GPR174 constrains regulatory T cell development and function. J Exp Med. 2015;212:1011–1020. doi: 10.1084/jem.20141827. [DOI] [PMC free article] [PubMed] [Google Scholar]
- 8.Kim JM, Rasmussen JP, Rudensky AY. Regulatory T cells prevent catastrophic autoimmunity throughout the lifespan of mice. Nat Immunol. 2007;8:191–197. doi: 10.1038/ni1428. [DOI] [PubMed] [Google Scholar]
- 9.Chinen T, Volchkov PY, Chervonsky AV, et al. A critical role for regulatory T cell-mediated control of inflammation in the absence of commensal microbiota. J Exp Med. 2010;207:2323–2330. doi: 10.1084/jem.20101235. [DOI] [PMC free article] [PubMed] [Google Scholar]
- 10.Yi T, Li J, Chen H, et al. Splenic Dendritic Cells Survey Red Blood Cells for Missing Self-CD47 to Trigger Adaptive Immune Responses. Immunity. 2015;43:764–775. doi: 10.1016/j.immuni.2015.08.021. [DOI] [PMC free article] [PubMed] [Google Scholar]
- 11.Sugita K, Yamamura C, Tabata K, et al. Expression of orphan G-protein coupled receptor GPR174 in CHO cells induced morphological changes and proliferation delay via increasing intracellular cAMP. Biochem Biophys Res Commun. 2013;430:190–195. doi: 10.1016/j.bbrc.2012.11.046. [DOI] [PubMed] [Google Scholar]
- 12.Shinjo Y, Makide K, Satoh K, et al. Lysophosphatidylserine suppresses IL-2 production in CD4 T cells through LPS3/GPR174. Biochem Biophys Res Commun. 2017;494:332–338. doi: 10.1016/j.bbrc.2017.10.028. [DOI] [PubMed] [Google Scholar]
- 13.Anastassiou ED, Paliogianni F, Balow JP, et al. Prostaglandin E2 and other cyclic AMP-elevating agents modulate IL-2 and IL-2R alpha gene expression at multiple levels. J Immunol. 1992;148:2845–2852. [PubMed] [Google Scholar]
- 14.Katamura K, Shintaku N, Yamauchi Y, et al. Prostaglandin E2 at priming of naive CD4+ T cells inhibits acquisition of ability to produce IFN-gamma and IL-2, but not IL-4 and IL-5. J Immunol. 1995;155:4604–4612. [PubMed] [Google Scholar]
- 15.Boniface K, Bak-Jensen KS, Li Y, et al. Prostaglandin E2 regulates Th17 cell differentiation and function through cyclic AMP and EP2/EP4 receptor signaling. J Exp Med. 2009;206:535–548. doi: 10.1084/jem.20082293. [DOI] [PMC free article] [PubMed] [Google Scholar]
- 16.Yao C, Sakata D, Esaki Y, et al. Prostaglandin E2-EP4 signaling promotes immune inflammation through Th1 cell differentiation and Th17 cell expansion. Nat Med. 2009;15:633–640. doi: 10.1038/nm.1968. [DOI] [PubMed] [Google Scholar]
- 17.New DC, Wong YH. Molecular mechanisms mediating the G protein-coupled receptor regulation of cell cycle progression. J Mol Signal. 2007;2:2. doi: 10.1186/1750-2187-2-2. [DOI] [PMC free article] [PubMed] [Google Scholar]
- 18.Bodor J, Feigenbaum L, Bodorova J, et al. Suppression of T-cell responsiveness by inducible cAMP early repressor (ICER) J Leukoc Biol. 2001;69:1053–1059. [PubMed] [Google Scholar]
- 19.Wang J, Barke RA, Roy S. Transcriptional and epigenetic regulation of interleukin-2 gene in activated T cells by morphine. J Biol Chem. 2007;282:7164–7171. doi: 10.1074/jbc.M604367200. [DOI] [PubMed] [Google Scholar]
- 20.Torgersen KM, Vang T, Abrahamsen H, et al. Molecular mechanisms for protein kinase A-mediated modulation of immune function. Cell Signal. 2002;14:1–9. doi: 10.1016/s0898-6568(01)00214-5. [DOI] [PubMed] [Google Scholar]
- 21.Rodriguez G, Ross JA, Nagy ZS, et al. Forskolin-inducible cAMP pathway negatively regulates T-cell proliferation by uncoupling the interleukin-2 receptor complex. J Biol Chem. 2013;288:7137–7146. doi: 10.1074/jbc.M112.408765. [DOI] [PMC free article] [PubMed] [Google Scholar]
- 22.Ohta A, Gorelik E, Prasad SJ, et al. A2A adenosine receptor protects tumors from antitumor T cells. Proc Natl Acad Sci U S A. 2006;103:13132–13137. doi: 10.1073/pnas.0605251103. [DOI] [PMC free article] [PubMed] [Google Scholar]
- 23.Zelenay S, van der Veen AG, Böttcher JP, et al. Cyclooxygenase-Dependent Tumor Growth through Evasion of Immunity. Cell. 2015;162:1257–1270. doi: 10.1016/j.cell.2015.08.015. [DOI] [PMC free article] [PubMed] [Google Scholar]
- 24.Li X, Murray F, Koide N, et al. Divergent requirement for Galphas and cAMP in the differentiation and inflammatory profile of distinct mouse Th subsets. J Clin Invest. 2012;122:963–973. doi: 10.1172/JCI59097. [DOI] [PMC free article] [PubMed] [Google Scholar]
- 25.Ernst B, Lee DS, Chang JM, et al. The peptide ligands mediating positive selection in the thymus control T cell survival and homeostatic proliferation in the periphery. Immunity. 1999;11:173–181. doi: 10.1016/s1074-7613(00)80092-8. [DOI] [PubMed] [Google Scholar]


