Supplemental Digital Content is Available in the Text.
A resting-state functional magnetic resonance imaging study of chronic knee osteoarthritis pain using a range of functional connectivity analyses to better understand brain network changes.
Keywords: Chronic pain, Resting-state, Knee osteoarthritis, Neuroimaging, Functional connectivity
Abstract
Resting-state functional connectivity (FC) has proven a powerful approach to understand the neural underpinnings of chronic pain, reporting altered connectivity in 3 main networks: the default mode network (DMN), central executive network, and the salience network (SN). The interrelation and possible mechanisms of these changes are less well understood in chronic pain. Based on emerging evidence of its role to drive switches between network states, the right anterior insula (rAI, an SN hub) may play a dominant role in network connectivity changes underpinning chronic pain. To test this hypothesis, we used seed-based resting-state FC analysis including dynamic and effective connectivity metrics in 25 people with chronic osteoarthritis (OA) pain and 19 matched healthy volunteers. Compared with controls, participants with painful knee OA presented with increased anticorrelation between the rAI (SN) and DMN regions. Also, the left dorsal prefrontal cortex (central executive network hub) showed more negative FC with the right temporal gyrus. Granger causality analysis revealed increased negative influence of the rAI on the posterior cingulate (DMN) in patients with OA in line with the observed enhanced anticorrelation. Moreover, dynamic FC was lower in the DMN of patients and thus more similar to temporal dynamics of the SN. Together, these findings evidence a widespread network disruption in patients with persistent OA pain and point toward a driving role of the rAI.
1. Introduction
Attention to the external world is driven by the salience of perceived stimuli, which is particularly relevant for threat and pain stimuli. There is a mutual link between, and interdependence of, perception and attention to pain known from everyday life experience and demonstrated at the neural level.59 A brain network implicated in this process is the “salience network” (SN).50 The core SN is formed by the bilateral anterior insula and the anterior middle cingulate cortex supporting the integration of external information, previous experience, and concurrent homeostatic state, to orient attention.39 Therefore, the SN is expected to play a dominant role in chronic pain, a condition believed to represent a maladaptive state of heightened arousal and pain anticipation. Chronic pain is also linked to aversive learning in which the sufferer might continually reevaluate the salient value of pain.3,9
Chronic pain is not consistently defined, but there is consensus that any criteria should reflect pain that lasts beyond the normal tissue healing time. It may be caused by any number of underlying pathologies such as arthritis, neuropathy, or migraine and is very common affecting between 33% and 50% of adults in the United Kingdom.19 The cause is not fully understood but central mechanisms have been implicated as predisposing factors.57 Interestingly, studies focusing on brain responses to evoked pain failed to consistently distinguish patients from healthy volunteers.45,55 By contrast, resting-state functional magnetic resonance imaging (fMRI) studies regularly report altered functional connectivity (FC) in the default mode network (DMN), believed to relate to interoception and mind wandering, in patients with chronic pain. Default mode network changes in chronic pain were mainly reported as increased connectivity,4–6,10,11,24,35,37,41 whereas others find the opposite.6,24 The most common region showing increased FC with the DMN in chronic pain is the insula4,6,10,11,37,41,43 suggesting increased binding between SN and DMN. Previous work in healthy volunteers has demonstrated the right anterior insula (rAI) as the main causal output within the SN, projecting to and influencing the central executive network (CEN) and DMN acting as a key switch between these networks.22,39,53 There are, however, surprisingly few studies reporting SN changes in chronic pain with 2 studies reporting increased connectivity,7,24 and 2 with no difference compared with controls.6,27 To make sense of these reported differences and discrepancies between studies, a broader approach combining different measurements of FC after rigorous quality control of putative confounds in chronic pain is still lacking.47
Given the importance of the SN in orienting attention and the primacy of the rAI, we hypothesised that chronic pain is characterised by altered rAI FC that causally alters depending network function (eg, the DMN). To test this, we used seed-to-brain connectivity analysis to assess resting-state networks in subjects with chronic knee osteoarthritis (OA) pain compared with controls. To provide better context for findings, comprehensive analysis was then undertaken to assess internetwork connectivity, effective and dynamic connectivity changes, and their interrelation with pain characteristics, structural and cerebral blood flow (CBF) data using available multimodal data from this cohort.15,17 This in-depth analysis will allow for a better mechanistic understanding of reported outcomes than previous reports.
2. Methods
2.1. Participants
Thirty-nine patients with radiographically defined chronic knee OA (15 men; median age 65 years; range 48-84 years; range of pain duration 1-38 years) and 25 healthy subjects (8 men; median age 65.5 years; range 51-80 years) were included. None of the subjects had a past or current diagnosis of any psychiatric or major neurological illness. Participants were recruited from orthopaedic clinics and from those who had participated in previous research and had given consent for further contact.
The study was run in accordance with the Declaration of Helsinki, and ethical approval was given by the Nottingham Research Ethics Committee 2 (Ref: 10/H0408/115). Signed and informed consent was obtained from all participants before enrolling in the study.
2.2. Demographic and questionnaire data
Directly before the scan session, all subjects undertook a battery of psychometric questionnaires including measures of educational level, low mood (Beck's Depression Index), anxiety (State-Trait Anxiety Index), pain state (McGill Pain Questionnaire), and pain catastrophizing (Pain Catastrophizing Scale).8,18,38,52,54 Patients were also asked to rate their knee pain using a visual analogue scale (0-100; 0 meaning no pain and 100 worst imaginable pain).
2.3. Magnetic resonance imaging data acquisition
All subjects underwent multimodal MRI at 3T (Discovery MR750; GE Healthcare) using a 32-channel head coil. BOLD fMRI resting-state data is reported here alongside a T1-weighted anatomical image used for registration purposes. Arterial spin labelling, structural, and magnetic resonance spectroscopy data from this study have been reported elsewhere.1,15,48 Resting-state data consisted of 165 single-echo gradient echo-planar volumes acquired over 5 minutes 30 seconds while participants were asked to keep their eyes closed and relax (time to echo/time to recovery [TR] = 32/2000 ms, interleaved acquisition, slice thickness = 3.6 mm, 35 axial slices parallel to anterior–posterior commissure plane, flip angle = 90°, matrix = 64 × 64, field of view = 240 mm, in-plane resolution = 3.75 mm2). High-resolution anatomical images were acquired using a gradient echo sequence (time to echo/TR = 3.324/8.492 ms, TI = 450 ms, slice gap = 1 mm, field of view = 256, matrix = 256 × 256, flip angle = 12°, voxel resolution = 1 mm3.
2.4. Quality control
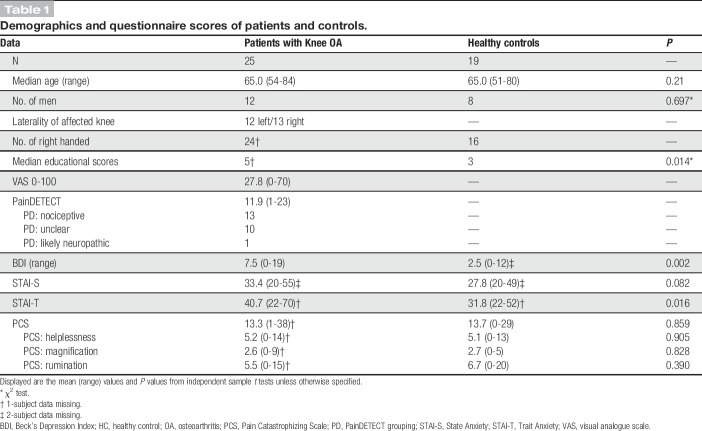
Functional MRI underwent a 2-step quality checking method (examples can be found in supplemental materials Figure 1, available online at http://links.lww.com/PAIN/A556). First, using an in-house pipeline following criteria outlined in the FBIRN study,21 we assessed raw image quality and found a number of data sets with excessive noise in the frequency spectra that were hence excluded. Second, data were excluded if it was of poor quality due to movement (>1 mm). In total, 20 data sets were discarded (patients = 14, controls = 6) reflecting the rigorous quality control. Group demographics after exclusions can be found in Table 1.
Table 1.
Demographics and questionnaire scores of patients and controls.
2.5. Image preprocessing
Image preprocessing was performed using FSL 5.0.8 (FMRIB software library), initially performing preprocessing steps including removal of the first 5 imaging volumes to allow for signal equilibrium effects, high-pass temporal filtering (0.01-Hz cutoff), interleaved slice-timing correction, motion correction,30 brain extraction, and spatial smoothing (5-mm full width at half maximum). Linear registration (FLIRT) to the T1-weighted image (BBR) and Montreal Neurological Institute standard space (12° of freedom) was performed.30,31 All data sets were denoised using ICA + FIX (independent component analysis followed by FMRIB's ICA-based noise reduction.23,49 To additionally control for physiological/scanner-related noise, time series data were extracted for each subject from cerebrospinal fluid (CSF) and white matter (WM). This was achieved using FMRIB's Automated Segmentation Tool (FAST) to calculate tissue segmentations from the subjects' T1-weighted images. The CSF and WM maps were then transformed to fMRI space using the previously calculated transform and were volume thresholded to retain only the top 20 and 198 cm3, respectively, to minimise partial volume and global demeaning effects.12 Mean CSF and WM time series were then extracted per subject using these masks and regressed out of the data alongside the 6 motion parameters (x, y, z, roll, yaw, and pitch) as part of the subsequent GLM analysis. Global signal regression was not performed.
2.6. Resting-state connectivity
Seed-based connectivity was calculated using 3 regions of interest (ROI) to investigate the 3 networks of interest using the SN—rAI (MNI coordinates [MNIxyz] = 32, 16, 6), CEN—the left dorsolateral prefrontal cortex (lDLPFC; MNI coordinates [MNIxyz] = −46, 20, 44), and the DMN—posterior cingulate cortex (PCC; MNI coordinates [MNIxyz] = −8, −50, 28) based on previously published coordinates.24,56 See Figures 1–3 for visual presentation of the seed regions. All ROIs were spherical with a 6-mm radius.
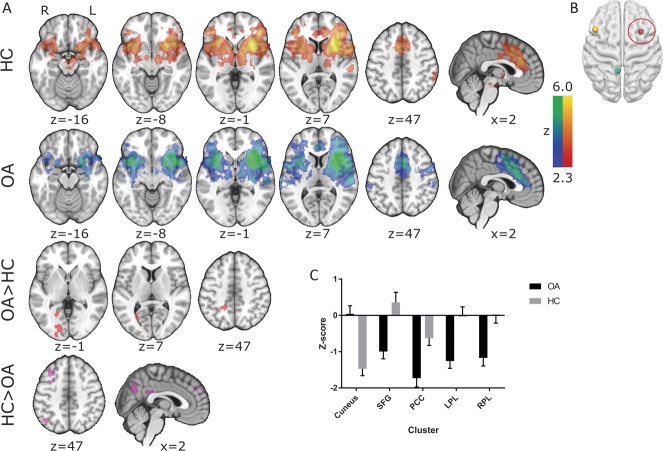
Figure 1.
Resting-state connectivity in (A) healthy controls (HCs), patients with chronic knee osteoarthritis (OA) and differences between these groups (FWE P < 0.05) of the (B) right anterior insula. (C) Mean (+SEM) z values of those clusters displaying a significant group difference are displayed on a bar graph to visualise the anticorrelations observed in patients with chronic knee OA. All slice images are displayed in radiological convention (right hemisphere is displayed on the left of the figure). PCC, posterior cingulate cortex.
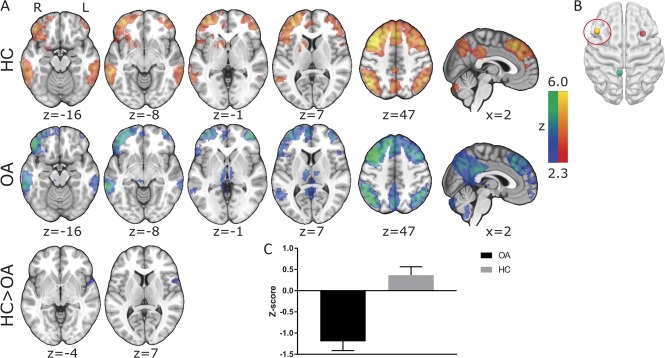
Figure 3.
Resting-state connectivity in (A) healthy controls (HCs), patients with chronic knee osteoarthritis (OA) and differences between these groups (FWE P < 0.05) of the (B) left dorsolateral prefrontal cortex. (C) Mean (+SEM) z values of those clusters displaying a significant group difference are displayed on a bar graph to visualise the anticorrelations observed in patients with chronic knee OA. All slice images are displayed in radiological convention (right hemisphere is displayed on the left of the figure).
2.7. Internetwork connectivity
Measures of FC between network hubs were calculated by means of (1) correlative connectivity and (2) Granger causality measures. Correlative connectivity was assessed using the 3 extracted time series for the rAI, lDLPFC, and PCC. Pearson correlation coefficients were calculated between these 3 time series per subject and then the Fisher r-to-z transformation was applied.
Bivariate first-order coefficient-based voxel-wise Granger causality analysis (GCA) was calculated using the REST fMRI toolbox.51 Granger causality analysis calculates an estimate of the causal effect of a region of interest on each voxel in the brain (X-Y effect) and the reverse (Y-X effect). A positive coefficient from X to Y signifies that activity in the region of interest exerts a positive influence on the activity of a specific region. Conversely, a negative coefficient from X to Y indicates that activity in the region of interest (X) exerts a negative influence on the activity of a specific region (Y). Seed-to-whole-brain Granger scores were calculated for each of the 3 ROIs per subject. For each seed region, mean Z values were extracted from the remaining 2 ROIs from the X to Y contrast only.
2.8. Dynamic functional connectivity
To assess intranetwork variability, a sliding-window analysis was performed to calculate SD using an in-house Matlab code. The 3 networks were defined by performing group ICA analysis (multisession temporal concatenation) on all 44 subjects through FSL Melodic (v3.14) limited to 25 components. Default mode network, CEN, and SN components were then visually assessed (see supplementary Figure 2, available online at http://links.lww.com/PAIN/A556). These components were then thresholded at Z = <2.3 and back registered into subject space to use as masks in the sliding-window analysis. Intranetwork analysis was performed by extracting time series using singular value decomposition (to reduce the effect of outlier values on the extracted time series) from each individual cluster within a network (see supplementary Table 1 for cluster details, available online at http://links.lww.com/PAIN/A556). A window of 100 seconds or 50 TRs was used as this corresponds to the frequency of 0.01 Hz—the lowest frequency of interest. Pearson correlation coefficients were then calculated per window and underwent Fisher's r-to-z transformation. The SD of these correlation values over all windows was calculated per connection per subject. To have a single metric per network, the mean SD was calculated across all connections within a network. These mean SD values were subsequently taken into further analysis such that each subject had a single value per network. In addition, for clarity, a table of SD for each network over window sizes of 20 to 50 is supplied in the supplementary analyses to show the consistency of the results regardless of the window size used (supplementary Figure 3, available online at http://links.lww.com/PAIN/A556).
2.9. Multimodal data
To further characterise changes observed from these 3 seed regions, CBF and gray matter densities from participants (T1 data were available for all subjects, but CBF data were unavailable from 4 subjects [OA = 22, healthy control [HC] = 18]) were extracted. Cerebral blood flow data were taken from previously published material whereas gray matter density was calculated by using the FSL VBM toolbox.15,17 Gray matter density was then extracted by back registering the seeds into subject space.
2.10. Statistical tests
Demographic data (age, sex), questionnaire scores (Beck's Depression Index, Pain Catastrophizing Scale, State-Trait Anxiety Index), regional CBF, gray matter density scores, and levels of mean relative motion recorded during the fMRI scan were compared between groups using independent sample t tests in Minitab 17.2.1. Measures of internetwork connectivity were also compared using 2-sample t tests within Minitab 17.2.1. Significance for these tests was set at P < 0.05.
For subject-level image analyses, time series from each of the 3 ROIs was used as predictors in individual regression models including 8 nuisance covariates (CSF, WM, and 6 motion parameters) using FSL FEAT. Group-level analyses were additionally controlled for mean relative motion,25 and statistical analyses were performed using FLAME 1 (a mixed-effect general linear model within FSL; FWE corrected Z > 2.3, cluster significance P < 0.05) comparing connectivity in patients with OA vs HCs. Repeat analyses additionally controlling for age were performed to rule out age as a confound on the reported connectivity.2
Relationships between regions where FC was found to be significantly different between patients and controls, and seed-based scores of gray matter density and CBF were investigated in Minitab 17.2.1 using stepwise linear regression. Z-scores from the brain regions were entered as dependent variables, whereas all other reported measures (pain at time of scanning, McGill Pain Questionnaire subscores; sensory, affective, and evaluative), neuropathic-like symptoms, anxiety, low mood, and catastrophizing subscales were entered as independent variables in the model. Holms-Bonferroni multiple-test correction was used for these regression analyses.
3. Results
3.1. Demographics
No significant group differences were found in age, sex, catastrophizing, or mean relative motion during the fMRI scan (P = 0.36). Patients with OA had lower educational levels (reflected by higher scores), lower mood, and higher trait anxiety scores than HCs (Table 1).
3.2. Functional connectivity of the salience network, default mode network, and central executive network
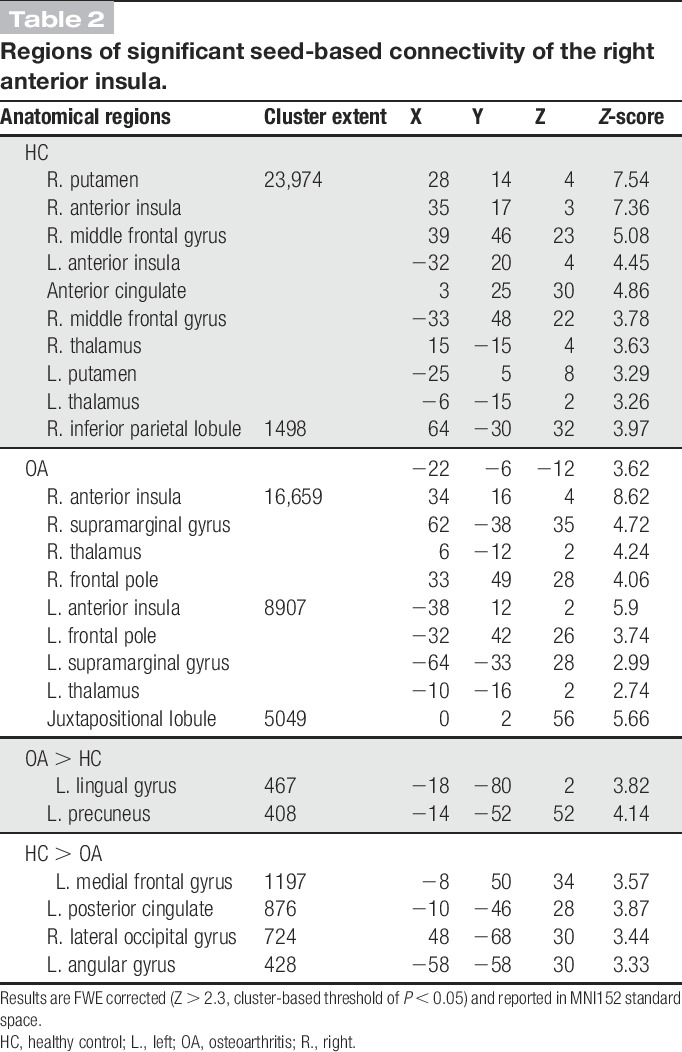
Seed-based FC of the rAI showed the core SN consisting of the bilateral anterior insula and the anterior middle cingulate cortex with further clusters within the bilateral putamen, caudate heads, frontal poles, right amygdala, and temporoparietal junction. Patients additionally displayed functional rAI connectivity with the left temporoparietal junction and the right precentral gyrus (Fig. 1A). Group comparison revealed a cluster of increased rAI FC within the cuneus in patients (FWE P < 0.05, Fig. 1A and Table 2) and several clusters of decreased rAI FC in patients compared with controls in areas associated with the DMN including the PCC, bilateral parietal areas, and the superior frontal gyrus (FWE P < 0.05, Fig. 1A and Table 2). To characterise the nature of relative FC changes between patients and controls, mean z-scores were extracted from significant clusters. This revealed that patients exhibited enhanced anticorrelation (negative FC) rather than less positive FC. By contrast, the increased rAI-cuneus FC in patients was linked to an abolished anticorrelation seen in HCs (see Fig. 1C for graphical visualisation).
Table 2.
Regions of significant seed-based connectivity of the right anterior insula.
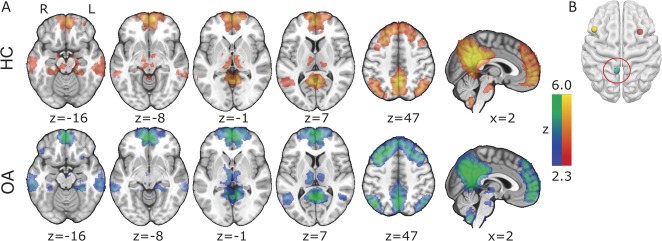
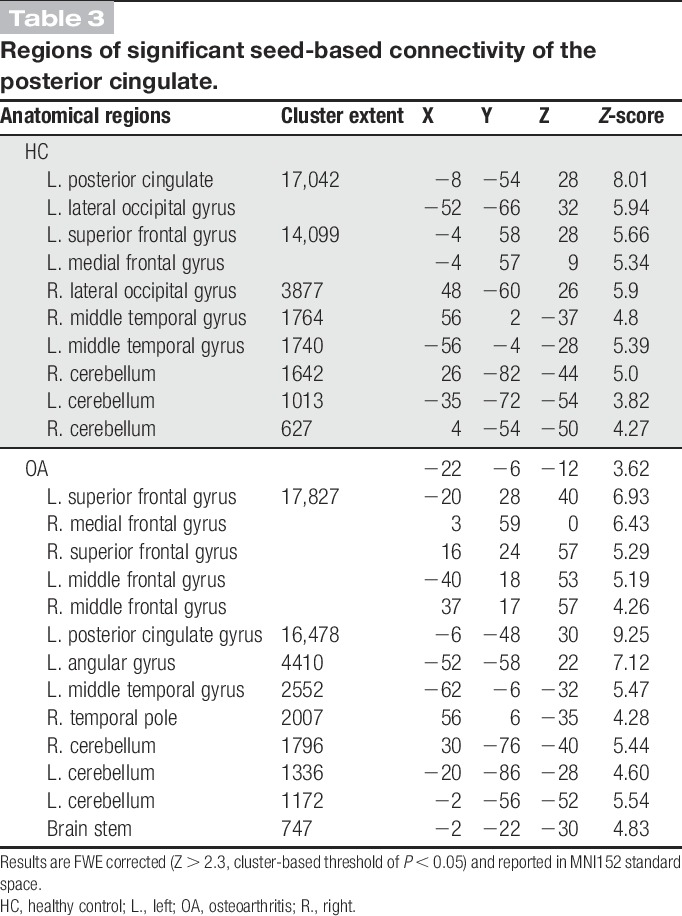
Functional connectivity of the PCC displayed a similar extent of the DMN across both subject groups including the PCC/precuneus, the medial prefrontal cortex, the lateral parietal regions, the bilateral thalami, hippocampi, and the lateral frontal cortex (Fig. 2 and Table 3). Comparison between patients and healthy control groups revealed no significant differences.
Figure 2.
Resting-state connectivity in (A) HCs, patients with chronic knee OA (FWE P < 0.05) of the (B) posterior cingulate cortex. All slice images are displayed in radiological convention (right hemisphere is displayed on the left of the figure). HC, healthy control; OA, osteoarthritis.
Table 3.
Regions of significant seed-based connectivity of the posterior cingulate.
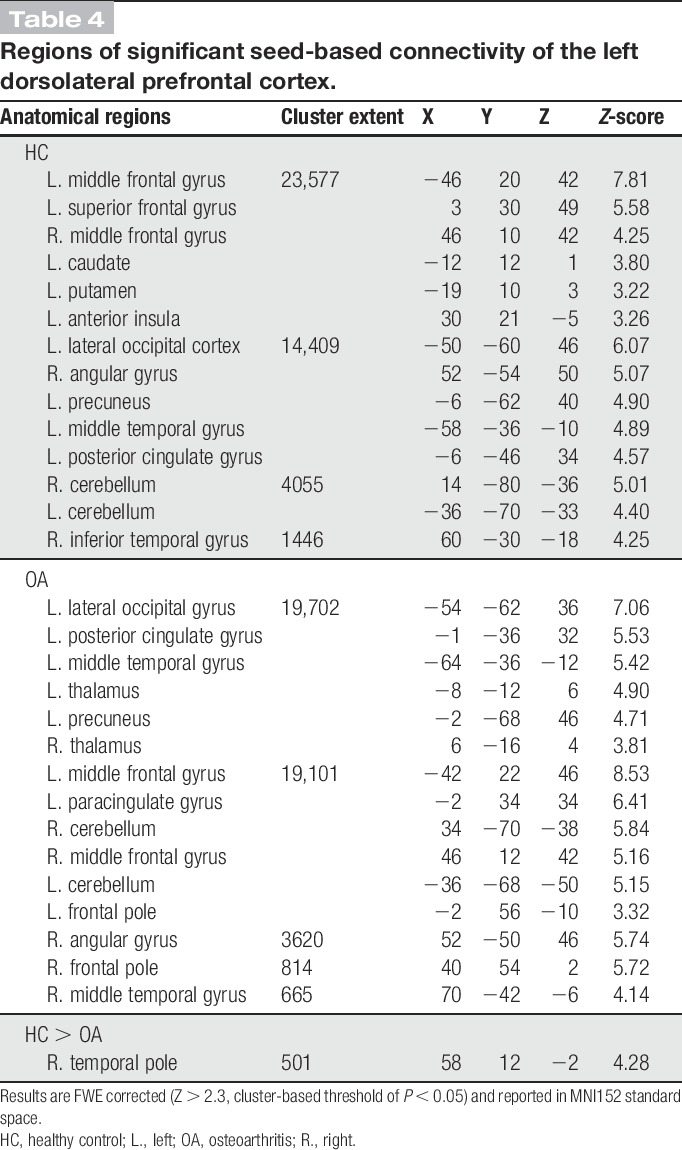
Functional connectivity of the lDLPFC demonstrated the core CEN including the bilateral DLPFC and posterior parietal cortices. The clusters within the bilateral DLPFC extended into the medial prefrontal regions, whereas additional clusters were also observed in the PCC, the bilateral middle temporal gyri, cerebellum, and the bilateral thalami. Compared with HCs, patients showed reduced CEN FC in a single cluster (FWE P < 0.05) that extended superiorly from the right temporal pole into the inferior frontal gyrus (Fig. 3 and Table 4). This was again a finding of increased anticorrelation within the OA cohort, whereas the HC FC was centred just above 0 (see Fig. 3C for visual representation). All seed-based FC results were replicated when additionally controlling for age, thus confirming that this was not a confounding factor in the reported results.
Table 4.
Regions of significant seed-based connectivity of the left dorsolateral prefrontal cortex.
3.3. Between-network hub functional and effective connectivity
Seed-to-seed FC, estimated using Pearson correlation coefficients, revealed no significant differences (after multiple-test correction) between patient and healthy control cohorts in connectivity between the pairs of network hubs: rAI-PCC (t(41) = −0.06, P = 0.95), rAI-lDLPFC (t(41) = 0.11, P = 0.92), or the PCC-lDLPFC (t(41) = 1.53, P = 0.13).
By contrast, estimates of effective connectivity derived from Granger causality analysis between these network hubs revealed a significant difference between patient and control groups for the influence rAI exerts (->) on the PCC. We found that rAI had a stronger negative effect on PCC in patients with OA (t(33) = −2.26, P = 0.03). No other calculated Granger coefficient was found to be significantly different between groups: rAI->lDLPFC (t(33) = −1.57, P = 0.13), lDLPFC->rAI (t(33) = −1.31, P = 0.20), lDLPFC->PCC (t(33) = −0.65, P = 0.52), and PCC->rAI (t(33) = −1.40, P = 0.17) with a trend towards increased positive influence from PCC->lDLPFC (t(33) = 1.89, P = 0.07) in patients (see supplementary Figure 4 for graphical representation, available online at http://links.lww.com/PAIN/A556).
3.4. Dynamic connectivity
Intranetwork connectivity also displayed significantly reduced variability within the DMN in patients compared with HCs (t(42) = 2.873, P = 0.006, Fig. 4). Salience network and CEN networks displayed no significant differences between patients and controls. Post hoc assessment of different sliding-window sizes found that these findings were consistent across sizes from 20 to 50 TRs (supplementary Figure 3, available online at http://links.lww.com/PAIN/A556).
Figure 4.
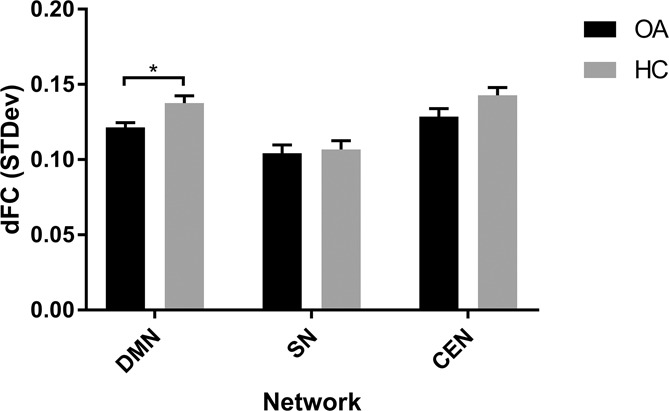
A bar graph displaying the group mean (+SEM) of calculated dynamic functional connectivity over a sliding window of 20 TRs (40 seconds). CEN, central executive network; dFC, dynamic functional connectivity; DMN, default mode network; HC, healthy control; OA, osteoarthritis; SN, salience network.
3.5. Associations with pain characteristics and anxiety
Post hoc analyses of the rAI FC within those clusters found to be significantly abnormal in OA revealed 2 associations between reported pain and psychological pain scores in patients. First, rAI FC with the PCC and superior frontal gyrus were found to be positively correlated with reported pain intensities (t(22) = 2.68, P = 0.015 and t(22) = 2.1, P = 0.048 respectively). Second, we found a negative correlation between lDLPFC FC with the right temporal gyrus and trait anxiety (t(22) = −2.26, P = 0.035). However, none of the associations survived multiple-test correction.
3.6. Are functional connectivity changes linked to changes in brain activation state or atrophy?
The multimodal data set further allowed us to investigate whether the observed FC and eFC changes are simply a reflection of an altered brain state (because of on-going pain) or reflective of brain morphometric alterations previously reported in chronic pain. Hence, we investigated the local CBF averaged from each of the 3 network hub ROIs hypothesising that brain state–related FC changes would be in the same direction as CBF group differences. We did not see any differences in CBF in the investigated network hubs between patients with OA vs controls.
Next, we studied whether FC changes were predicted by GM intensity alterations as have been repeatedly albeit inconsistently found in OA and other chronic pain cohorts. Again, we found no significant correlations between regional GM densities and any of the reported FC metrics suggesting that alterations of the pain connectome are unlikely a simple reflection of on-going pain during the MRI examination nor the result of structural neuroplastic or atrophic changes.
4. Discussion
In this study, we undertook a resting-state connectivity analysis of the static and dynamic pain connectome to investigate a possible key role of the rAI in chronic pain. We found increased anticorrelations between the SN and DMN and between the CEN and the left temporal gyrus in patients with chronic OA knee pain compared with pain-free controls. Importantly, we also found increased negative effective connectivity from the rAI to the PCC suggesting an increased negative influence exerted by the SN on the DMN. Moreover, temporal variability of DMN FC was reduced in patients and thus more alike the lower variability seen in the SN in HCs. Taken together, we highlight widespread static, effective, and dynamic FC changes in chronic OA pain that proved independent of activity state (regional CBF), and these connectome changes seem largely driven by rAI FC alterations.
Our study provides evidence that the rAI may drive the altered pain connectome as we found selective effective connectivity changes with an enhanced negative influence of the rAI on the DMN. Patients displayed an increased negative influence of the rAI->PCC, which offers a plausible mechanistic explanation for the observed increased negative connectivity found in the seed-based SN network. Previous studies in HCs have evidenced the causal influence of the SN onto the DMN using time lag and Granger causality analyses showing that the rAI displayed the highest number of outflowing causal connections and the lowest number of inflowing causal connections.22,53 Further mechanistic evidence was given by a subsequent study using excitatory and inhibitory transcranial magnetic stimulation (TMS) to interrupt these relationships demonstrating that excitation of CEN/SN nodes induced negative between network connectivity with the DMN, whereas inhibitory TMS resulted in disinhibition of the DMN.13 Within the behavioural context that altered “salience” may contribute to or from part of the suffering in chronic pain,9 it is then plausible that neuroplasticity changes in the SN caused by the repeated salient and/or painful sensations may underpin observed altered intranetwork and internetwork connectivity changes. Expanding on this, it has also been theorised that chronic pain and negative effect form a continuum of aversive learning, and considering the importance of the SN and its known connectivity with limbic regions, it is tempting to speculate that continuous aversive learning may affect the observed changes in the SN.3 Such a notion is supported by our preliminary findings of both anxiety and pain severity relating to functional SN and CEN connectivity in patients.
The study of dynamic network changes may be particularly revealing to understand abnormal network architecture characterised by the inability to switch between states. The neurophysiological basis of network dynamics and the best ways to measure them is an emerging area of active research.26 The observed reduced temporal variability (indexed as SD) within the DMN but not the SN or CEN in patients with chronic OA is intriguing. Impaired temporal fluctuation of the DMN FC has been reported in a number of diseases including major depression33 and bipolar disorders.42 Reduced FC variability has been interpreted to reflect impaired switching between brain states characterised by more segregated subnetworks. Behavioural correlation studies found that reduced variability of FC between networks and/or regions is associated with lower performance in behavioural tasks in HCs and with slower processing speed in patients with bipolar disorder compared with controls.32,42 In the context of chronic pain, the observed stronger inhibitory influence of the rAI on the DMN may offer an explanation why within DMN switches may be suppressed. The tonic input of chronic pain or aversive state associated with its anticipation conceivably could affect the dynamic ability of the brain to switch between networks—a hypothesis supported by current data showing altered connectivity between and within networks.9 Interestingly, healthy individuals whose cognition was more impacted by a pain distractor or reported a reduced ability to disengage from pain-related thoughts displayed reduced variability between brain regions.14,34,36 This suggests that impaired dynamic FC may be an additional important hallmark of the chronic pain connectome that may reflect the inability to detach from clinical pain.
We report here that patients with chronic OA pain display significantly more anticorrelation between the rAI and DMN regions suggesting an altered brain state at rest characterised by increased inhibitory effect of the SN on the DMN. This is interesting as previous reports of group differential DMN-insular connectivity are not consistent in their direction. For instance, several studies report increased (more positive) connectivity in patients,4,10,37,41 whereas others report decreased positive connectivity or increased anticorrelations.6,11 Although differential DMN-insula connectivity is a consistent finding in the pain literature, the different directions suggest additional factors that modulate the direction of the connectivity alteration. One such influence could be reported pain severity, a factor that we found relates to rAI-PCC connectivity (although not significant after multiple-test correction), which is in line with previous studies that also report relationships between pain and DMN-insula connectivity in multiple pain cohorts.6,41 Perceived pain severity in general and during scanning may explain the discrepant findings of reduced anticorrelated connectivity of the SN and DMN found in patients with ankylosing spondylitis compared with controls,24 and potentially our finding of no difference in DMN connectivity between groups.
In addition to the major findings within the SN, connectivity of the CEN, specifically in a cluster encompassing the right middle temporal gyrus/inferior frontal gyrus, was found to be negative in patients while controls displayed generally positive connectivity. This cluster is placed almost completely within the SN network, further pointing to the importance of the SN network and its altered internetwork connectivity. In addition, connectivity within this cluster correlated with trait anxiety in patients such that subjects with the highest levels of anxiety displayed the highest SN-CEN anticorrelation. This is interesting in the context that anxiety disorders have previously been related to hyperactivity of the AI within the SN network.46,50 Thus, given the known influence of the SN on the CEN, it is possible that increased anxiety (a common comorbidity of chronic pain) plays a role in the maladaptation of SN-CEN connectivity.
Default mode network alterations are the most commonly reported network changes in chronic pain, yet we found no such group DMN FC difference.5,7,10,35,37,41,43 It is possible that differences could be due to different patient cohort, subgroups (with more severe pathology and pain severity as discussed above), or analytical choices. For instance, several of these studies used ICA-based connectivity methods, and the majority that did perform seed-based connectivity analyses used ROIs based within the medial prefrontal cortex rather than the PCC. In addition, in this study, we opted for conservative quality assurance on the data, which was likely more stringent than in previous reports and may thus have further differentiated findings.
The reported altered connectivity between networks is similar to internetwork effective connectivity changes that have been reported in mental health disorders such as schizophrenia and major depressive disorder.28,44 Interestingly, neuromodulatory treatment has been shown to impact on these internetwork connections in mental health disorders and as such may also have therapeutic potential in the context of chronic pain. For instance, recent work has shown in HCs that individually targeted theta-burst TMS (excitatory stimulation) to the DLPFC alters effective connectivity of the anterior insula.29 Thus, the reported altered effective connectivity of the rAI presents as a plausible and modifiable target for neuromodulatory treatment trials.
This study had some limitations that reduce the inference on the findings. First, the study is limited by its cross-sectional design and as such only allows for observational findings. Second, the reported visual analogue scale scores found to correlate with connectivity were collected before the scan, and the level of subjective pain may have changed during the scan. Increasing age is known to affect FC2,16 and as such an effort was made to minimise the effect of age by (1) testing against an age- and sex-matched cohort and (2) additionally rerunning the main analyses with age as a covariate (and were subsequently replicated). Educational levels were shown to enhance anticorrelation between the DMN and lDLPFC.20 As a common observation, our patient cohort had fewer years of education, and we cannot fully exclude that this may have contributed to observed group differences. Nevertheless, despite significantly lower education levels of our pain cohort, we did not find a difference in DMN connectivity between the 2 groups. We also need to acknowledge that medication use may alter FC, but care was taken to exclude subjects on centrally acting pain killers, such as pregabalin, gabapentin, duloxetine, or strong opiates, whereas 2 participants were on cocodamol. Although we cannot fully exclude a confounding effect from analgesic medication on our reported findings, this is highly unlikely as only 6 of 25 patients reported regular paracetamol use as a peripherally acting drug with limited efficacy. Last, temporal sampling rate would ideally be higher than 2 seconds when performing effective connectivity analyses such as those performed in this report. However, recent studies have argued that effective connectivity results from fMRI can be reproduced at much higher resolutions (eg, using MEG) lending weight to our use of such techniques.40,58
5. Conclusion
We present novel and comprehensive pain connectome analysis in patients with chronic OA pain and propose the rAI as key region driving static and dynamic network connectivity changes. Although complementing theories of altered salience in chronic pain, these findings also present a novel target and network metrics to mechanistically assess efficacy of neuromodulatory treatments.
Conflict of interest statement
The authors have no conflict of interest to declare.
Arthritis Research UK funded this study (Grant 18769).
Supplementary Material
Acknowledgements
The authors thank Arthritis Research UK for providing the financial support for this study (Grant 18769). The authors are also indebted to our colleagues who enabled study setup (Sharon Forman and Laura Condon), recruitment (Maggie Wheeler), scanned participants (Hamza Alshuft and Laura Condon), and aided with analysis (Xingfeng Li).
Appendix A. Supplemental digital content
Supplemental digital content associated with this article can be found online at http://links.lww.com/PAIN/A556.
Footnotes
Sponsorships or competing interests that may be relevant to content are disclosed at the end of this article.
Supplemental digital content is available for this article. Direct URL citations appear in the printed text and are provided in the HTML and PDF versions of this article on the journal's Web site (www.painjournalonline.com).
References
- [1].Alshuft HM, Condon LA, Dineen RA, Auer DP. Cerebral cortical thickness in chronic pain due to knee osteoarthritis: the effect of pain duration and pain sensitization. PLoS One 2016;11:e0161687. [DOI] [PMC free article] [PubMed] [Google Scholar]
- [2].Andrews-Hanna JR, Snyder AZ, Vincent JL, Lustig C, Head D, Raichle ME, Buckner RL. Disruption of large-scale brain systems in advanced aging. Neuron 2007;56:924–35. [DOI] [PMC free article] [PubMed] [Google Scholar]
- [3].Baliki MN, Apkarian AV. Nociception, pain, negative moods, and behavior selection. Neuron 2015;87:474–91. [DOI] [PMC free article] [PubMed] [Google Scholar]
- [4].Baliki MN, Baria AT, Apkarian AV. The cortical rhythms of chronic back pain. J Neurosci 2011;31:13981–90. [DOI] [PMC free article] [PubMed] [Google Scholar]
- [5].Baliki MN, Geha PY, Apkarian AV, Chialvo DR. Beyond feeling: chronic pain hurts the brain, disrupting the default-mode network dynamics. J Neurosci 2008;28:1398–403. [DOI] [PMC free article] [PubMed] [Google Scholar]
- [6].Baliki MN, Mansour AR, Baria AT, Apkarian AV. Functional reorganization of the default mode network across chronic pain conditions. PLoS One 2014;9:e106133. [DOI] [PMC free article] [PubMed] [Google Scholar]
- [7].Becerra L, Sava S, Simons LE, Drosos AM, Sethna N, Berde C, Lebel AA, Borsook D. Intrinsic brain networks normalize with treatment in pediatric complex regional pain syndrome. Neuroimage Clin 2014;6:347–69. [DOI] [PMC free article] [PubMed] [Google Scholar]
- [8].Beck A, Steer R, Brown G. Manual for the Beck depression inventory-II. San Antonio: Psychological Corporation, 1996. [Google Scholar]
- [9].Borsook D, Edwards R, Elman I, Becerra L, Levine J. Pain and analgesia: the value of salience circuits. Prog Neurobiol 2013;104:93–105. [DOI] [PMC free article] [PubMed] [Google Scholar]
- [10].Cauda F, Sacco K, Duca S, Cocito D, D'Agata F, Geminiani GC, Canavero S. Altered resting state in diabetic neuropathic pain. PLoS One 2009;4:e4542. [DOI] [PMC free article] [PubMed] [Google Scholar]
- [11].Ceko M, Shir Y, Ouellet JA, Ware MA, Stone LS, Seminowicz DA. Partial recovery of abnormal insula and dorsolateral prefrontal connectivity to cognitive networks in chronic low back pain after treatment. Hum Brain Mapp 2015;36:2075–92. [DOI] [PMC free article] [PubMed] [Google Scholar]
- [12].Chai XQJ, Castanon AN, Ongur D, Whitfield-Gabrieli S. Anticorrelations in resting state networks without global signal regression. Neuroimage 2012;59:1420–8. [DOI] [PMC free article] [PubMed] [Google Scholar]
- [13].Chen AC, Oathes DJ, Chang C, Bradley T, Zhou ZW, Williams LM, Glover GH, Deisseroth K, Etkin A. Causal interactions between fronto-parietal central executive and default-mode networks in humans. Proc Natl Acad Sci U S A 2013;110:19944–9. [DOI] [PMC free article] [PubMed] [Google Scholar]
- [14].Cheng JC, Bosma RL, Hemington KS, Kucyi A, Lindquist MA, Davis KD. Slow-5 dynamic functional connectivity reflects the capacity to sustain cognitive performance during pain. Neuroimage 2017;157:61–8. [DOI] [PubMed] [Google Scholar]
- [15].Cottam WJ, Condon L, Alshuft H, Reckziegel D, Auer DP. Associations of limbic-affective brain activity and severity of ongoing chronic arthritis pain are explained by trait anxiety. Neuroimage Clin 2016;12:269–76. [DOI] [PMC free article] [PubMed] [Google Scholar]
- [16].Damoiseaux JS, Beckmann CF, Arigita EJ, Barkhof F, Scheltens P, Stam CJ, Smith SM, Rombouts SA. Reduced resting-state brain activity in the “default network” in normal aging. Cereb Cortex 2008;18:1856–64. [DOI] [PubMed] [Google Scholar]
- [17].Drabek MM, Reckziegel D, Cottam WJ, Li X, Frowd N, Alshuft H, Scammell B, Kurien T, Auer DP. Chronic pain-related sexual dimorphism in gray matter density: a whole-brain voxel-based morphometric study on osteoarthritis patients, Proceedings of the ISMRM-ESMRMB. 2017. [Google Scholar]
- [18].Egerton M, Mullan K. Being a pretty good citizen: an analysis and monetary valuation of formal and informal voluntary work by gender and educational attainment. Br J Sociol 2008;59:145–64. [DOI] [PubMed] [Google Scholar]
- [19].Fayaz A, Croft P, Langford RM, Donaldson LJ, Jones GT. Prevalence of chronic pain in the UK: a systematic review and meta-analysis of population studies. BMJ Open 2016;6:e010364. [DOI] [PMC free article] [PubMed] [Google Scholar]
- [20].Franzmeier N, Duering M, Weiner M, Dichgans M, Ewers M; Alzheimer's Disease Neuroimaging Initiative. Left frontal cortex connectivity underlies cognitive reserve in prodromal Alzheimer disease. Neurology 2017;88:1054–61. [DOI] [PMC free article] [PubMed] [Google Scholar]
- [21].Friedman L, Glover GH. Report on a multicenter fMRI quality assurance protocol. J Magn Reson Imaging 2006;23:827–39. [DOI] [PubMed] [Google Scholar]
- [22].Goulden N, Khusnulina A, Davis NJ, Bracewell RM, Bokde AL, McNulty JP, Mullins PG. The salience network is responsible for switching between the default mode network and the central executive network: replication from DCM. Neuroimage 2014;99:180–90. [DOI] [PubMed] [Google Scholar]
- [23].Griffanti L, Salimi-Khorshidi G, Beckmann CF, Auerbach EJ, Douaud G, Sexton CE, Zsoldos E, Ebmeier KP, Filippini N, Mackay CE, Moeller S, Xu J, Yacoub E, Baselli G, Ugurbil K, Miller KL, Smith SM. ICA-based artefact removal and accelerated fMRI acquisition for improved resting state network imaging. Neuroimage 2014;95:232–47. [DOI] [PMC free article] [PubMed] [Google Scholar]
- [24].Hemington KS, Wu Q, Kucyi A, Inman RD, Davis KD. Abnormal cross-network functional connectivity in chronic pain and its association with clinical symptoms. Brain Struct Funct 2016;221:4203–19. [DOI] [PubMed] [Google Scholar]
- [25].Hlinka J, Alexakis C, Hardman JG, Siddiqui Q, Auer DP. Is sedation-induced BOLD fMRI low-frequency fluctuation increase mediated by increased motion? MAGMA 2010;23:367–74. [DOI] [PubMed] [Google Scholar]
- [26].Hutchison RM, Womelsdorf T, Allen EA, Bandettini PA, Calhoun VD, Corbetta M, Penna S, Duyn JH, Glover GH, Gonzalez-Castillo J, Handwerker DA, Keilholz S, Kiviniemi V, Leopold DA, Pasquale F, Sporns O, Walter M, Chang C. Dynamic functional connectivity: promise, issues, and interpretations. Neuroimage 2013;80:360–78. [DOI] [PMC free article] [PubMed] [Google Scholar]
- [27].Ichesco E, Puiu T, Hampson JP, Kairys AE, Clauw DJ, Harte SE, Peltier SJ, Harris RE, Schmidt-Wilcke T. Altered fMRI resting-state connectivity in individuals with fibromyalgia on acute pain stimulation. Eur J Pain 2016;20:1079–89. [DOI] [PubMed] [Google Scholar]
- [28].Iwabuchi SJ, Peng D, Fang Y, Jiang K, Liddle EB, Liddle PF, Palaniyappan L. Alterations in effective connectivity anchored on the insula in major depressive disorder. Eur Neuropsychopharmacol 2014;24:1784–92. [DOI] [PubMed] [Google Scholar]
- [29].Iwabuchi SJ, Raschke F, Auer DP, Liddle PF, Lankappa ST, Palaniyappan L. Targeted transcranial theta-burst stimulation alters fronto-insular network and prefrontal GABA. Neuroimage 2017;146:395–403. [DOI] [PubMed] [Google Scholar]
- [30].Jenkinson M, Bannister P, Brady M, Smith S. Improved optimization for the robust and accurate linear registration and motion correction of brain images. Neuroimage 2002;17:825–41. [DOI] [PubMed] [Google Scholar]
- [31].Jenkinson M, Smith S. A global optimisation method for robust affine registration of brain images. Med Image Anal 2001;5:143–56. [DOI] [PubMed] [Google Scholar]
- [32].Jia H, Hu X, Deshpande G. Behavioral relevance of the dynamics of the functional brain connectome. Brain Connect 2014;4:741–59. [DOI] [PMC free article] [PubMed] [Google Scholar]
- [33].Kaiser RH, Whitfield-Gabrieli S, Dillon DG, Goer F, Beltzer M, Minkel J, Smoski M, Dichter G, Pizzagalli DA. Dynamic resting-state functional connectivity in major depression. Neuropsychopharmacology 2016;41:1822–30. [DOI] [PMC free article] [PubMed] [Google Scholar]
- [34].Kucyi A, Davis KD. The dynamic pain connectome. Trends Neurosci 2015;38:86–95. [DOI] [PubMed] [Google Scholar]
- [35].Kucyi A, Moayedi M, Weissman-Fogel I, Goldberg MB, Freeman BV, Tenenbaum HC, Davis KD. Enhanced medial prefrontal-default mode network functional connectivity in chronic pain and its association with pain rumination. J Neurosci 2014;34:3969–75. [DOI] [PMC free article] [PubMed] [Google Scholar]
- [36].Kucyi A, Salomons TV, Davis KD. Mind wandering away from pain dynamically engages antinociceptive and default mode brain networks. Proc Natl Acad Sci U S A 2013;110:18692–7. [DOI] [PMC free article] [PubMed] [Google Scholar]
- [37].Loggia ML, Kim J, Gollub RL, Vangel MG, Kirsch I, Kong J, Wasan AD, Napadow V. Default mode network connectivity encodes clinical pain: an arterial spin labeling study. PAIN 2013;154:24–33. [DOI] [PMC free article] [PubMed] [Google Scholar]
- [38].Melzack R. The McGill pain questionnaire: major properties and scoring methods. PAIN 1975;1:277–99. [DOI] [PubMed] [Google Scholar]
- [39].Menon V, Uddin LQ. Saliency, switching, attention and control: a network model of insula function. Brain Struct Funct 2010;214:655–67. [DOI] [PMC free article] [PubMed] [Google Scholar]
- [40].Mill RD, Bagic A, Bostan A, Schneider W, Cole MW. Empirical validation of directed functional connectivity. Neuroimage 2017;146:275–87. [DOI] [PMC free article] [PubMed] [Google Scholar]
- [41].Napadow V, LaCount L, Park K, As-Sanie S, Clauw DJ, Harris RE. Intrinsic brain connectivity in fibromyalgia is associated with chronic pain intensity. Arthritis Rheum 2010;62:2545–55. [DOI] [PMC free article] [PubMed] [Google Scholar]
- [42].Nguyen TT, Kovacevic S, Dev SI, Lu K, Liu TT, Eyler LT. Dynamic functional connectivity in bipolar disorder is associated with executive function and processing speed: a preliminary study. Neuropsychology 2017;31:73–83. [DOI] [PMC free article] [PubMed] [Google Scholar]
- [43].Otti A, Guendel H, Henningsen P, Zimmer C, Wohlschlaeger AM, Noll-Hussong M. Functional network connectivity of pain-related resting state networks in somatoform pain disorder: an exploratory fMRI study. J Psychiatry Neurosci 2013;38:57–65. [DOI] [PMC free article] [PubMed] [Google Scholar]
- [44].Palaniyappan L, Simmonite M, White TP, Liddle EB, Liddle PF. Neural primacy of the salience processing system in schizophrenia. Neuron 2013;79:814–28. [DOI] [PMC free article] [PubMed] [Google Scholar]
- [45].Parks EL, Geha PY, Baliki MN, Katz J, Schnitzer TJ, Apkarian AV. Brain activity for chronic knee osteoarthritis: dissociating evoked pain from spontaneous pain. Eur J Pain 2011;15:843.e1–14. [DOI] [PMC free article] [PubMed] [Google Scholar]
- [46].Paulus MP, Stein MB. An insular view of anxiety. Biol Psychiatry 2006;60:383–7. [DOI] [PubMed] [Google Scholar]
- [47].Power JD, Barnes KA, Snyder AZ, Schlaggar BL, Petersen SE. Spurious but systematic correlations in functional connectivity MRI networks arise from subject motion. Neuroimage 2012;59:2142–54. [DOI] [PMC free article] [PubMed] [Google Scholar]
- [48].Reckziegel D, Raschke F, Cottam WJ, Auer DP. Cingulate GABA levels inversely correlate with the intensity of ongoing chronic knee osteoarthritis pain. Mol Pain 2016;12. [DOI] [PMC free article] [PubMed] [Google Scholar]
- [49].Salimi-Khorshidi G, Douaud G, Beckmann CF, Glasser MF, Griffanti L, Smith SM. Automatic denoising of functional MRI data: combining independent component analysis and hierarchical fusion of classifiers. Neuroimage 2014;90:449–68. [DOI] [PMC free article] [PubMed] [Google Scholar]
- [50].Seeley WW, Menon V, Schatzberg AF, Keller J, Glover GH, Kenna H, Reiss AL, Greicius MD. Dissociable intrinsic connectivity networks for salience processing and executive control. J Neurosci 2007;27:2349–56. [DOI] [PMC free article] [PubMed] [Google Scholar]
- [51].Song XW, Dong ZY, Long XY, Li SF, Zuo XN, Zhu CZ, He Y, Yan CG, Zang YF. REST: a toolkit for resting-state functional magnetic resonance imaging data processing. PLoS One 2011;6:e25031. [DOI] [PMC free article] [PubMed] [Google Scholar]
- [52].Spielberger C, Gorsuch R, Lushene R, Vagg PR, Jacobs GA. Manual for the state-trait anxiety inventory. Palo Alto: Consulting Psychologists Press, 1983. [Google Scholar]
- [53].Sridharan D, Levitin DJ, Menon V. A critical role for the right fronto-insular cortex in switching between central-executive and default-mode networks. Proc Natl Acad Sci U S A 2008;105:12569–74. [DOI] [PMC free article] [PubMed] [Google Scholar]
- [54].Sullivan MJL, Bishop SR, Pivik J. The pain catastrophizing scale: development and validation. Psychol Assess 1995;7:524–32. [Google Scholar]
- [55].Tanasescu R, Cottam WJ, Condon L, Tench CR, Auer DP. Functional reorganisation in chronic pain and neural correlates of pain sensitisation: a coordinate based meta-analysis of 266 cutaneous pain fMRI studies. Neurosci Biobehav Rev 2016;68:120–33. [DOI] [PMC free article] [PubMed] [Google Scholar]
- [56].Uddin LQ, Supekar KS, Ryali S, Menon V. Dynamic reconfiguration of structural and functional connectivity across core neurocognitive brain networks with development. J Neurosci 2011;31:18578–89. [DOI] [PMC free article] [PubMed] [Google Scholar]
- [57].Vachon-Presseau E, Tetreault P, Petre B, Huang L, Berger SE, Torbey S, Baria AT, Mansour AR, Hashmi JA, Griffith JW, Comasco E, Schnitzer TJ, Baliki MN, Apkarian AV. Corticolimbic anatomical characteristics predetermine risk for chronic pain. Brain 2016;139:1958–70. [DOI] [PMC free article] [PubMed] [Google Scholar]
- [58].Wang HE, Benar CG, Quilichini PP, Friston KJ, Jirsa VK, Bernard C. A systematic framework for functional connectivity measures. Front Neurosci 2014;8:405. [DOI] [PMC free article] [PubMed] [Google Scholar]
- [59].Wiech K. Deconstructing the sensation of pain: the influence of cognitive processes on pain perception. Science 2016;354:584–7. [DOI] [PubMed] [Google Scholar]
Associated Data
This section collects any data citations, data availability statements, or supplementary materials included in this article.


