

On the ability of biogenic vapors to initiate ion-induced cluster formation in the boreal forest.
Abstract
A substantial fraction of aerosols, which affect air quality and climate, is formed from gaseous precursors. Highly oxygenated organic molecules (HOMs) are essential to grow the newly formed particles and have been evidenced to initiate ion-induced nucleation in chamber experiments in the absence of sulfuric acid. We investigate this phenomenon in the real atmosphere using an extensive set of state-of-the-art ion and mass spectrometers deployed in a boreal forest environment. We show that within a few hours around sunset, HOMs resulting from the oxidation of monoterpenes are capable of forming and growing ion clusters even under low sulfuric acid levels. In these conditions, we hypothesize that the lack of photochemistry and essential vapors prevents the organic clusters from growing past 6 nm. However, this phenomenon might have been a major source of particles in the preindustrial atmosphere and might also contribute to particle formation in the future and consequently affect the climate.
INTRODUCTION
Atmospheric new particle formation (NPF) is a significant source of particles and cloud condensation nuclei (CCN) (1) and in turn affects both air quality and climate. It has been commonly believed that sulfuric acid (H2SO4) is essential to initiate the process in most environments (2, 3). However, typical daytime H2SO4 concentrations are usually too low to explain the observed particle formation and growth rates, indicating that additional vapors are needed to sustain the process (2, 4, 5). These vapors are most likely highly oxygenated organic molecules (HOMs) resulting from the oxidation of volatile organic compounds (VOCs) (5–8), either from anthropogenic or biogenic (BVOC) origin. Bianchi et al. (9) recently reported the first direct atmospheric evidence for the contribution of these compounds, probably from anthropogenic origin, in the early nucleation stage. Correspondingly, using the CERN Cosmics Leaving Outdoor Droplets (CLOUD) facilities, Kirkby et al. (10) were able to show evidence for ion-induced nucleation of pure biogenic particles initiated by HOMs produced by the ozonolysis of α-pinene. Implementing these chamber findings into a global model suggested that pure biogenic nucleation may be able to explain a significant source of particles in pristine environments at the present time and might have also dominated both nucleation and atmospheric CCN formation in the preindustrial era, when H2SO4 concentrations were much lower (11). However, although circumstantial evidence for pure biogenic nucleation is well demonstrated in the latter study, a direct observation of this process in the ambient atmosphere is still lacking. In particular, most of the studies conducted so far to document the chemical composition of ions in relation to the occurrence of NPF were performed using daytime measurements conducted in the boreal forest in Hyytiälä, Southern Finland, when H2SO4 has been shown to play a major role in cluster formation (2). Also, although chamber experiments can well mimic atmospheric observations (6, 12), they cannot fully achieve the complexity of the real atmosphere. For instance, the experiments discussed by Kirkby et al. (10) were conducted in the absence of NOx. Recently, Bianchi et al. (13) have extensively analyzed the chemical composition of the negative ions in the boreal forest, where they identified many HOMs clustered with NO3− and HSO4−. Ion clusters containing up to 40 carbon atoms were detected during nighttime, but a possible link with NPF was not investigated.
RESULTS
Identification of the evening ion cluster formation events
The aim of our work was to investigate the occurrence of the pure biogenic ion cluster formation in the real atmosphere. For that, we analyzed measurements performed between 9 April 2013 and 15 June 2013 with an extensive set of state-of-the-art ion and mass spectrometers at the boreal Station for Measuring Forest Ecosystem–Atmosphere Relations (SMEAR) II station in Hyytiälä, Southern Finland. BVOC emissions have been reported to be dominated by monoterpenes (14) and to produce large amounts of HOMs (15, 16) at this site. Keeping in mind that sulfuric acid–driven pathways are dominating daytime nucleation in Hyytiälä (2), we focus here on the occurrence of evening events leading to the formation and growth of intermediate ions, also referred to as ion clusters or charged clusters. Studying evening-time ion cluster formation processes also enabled us to focus on HOM production in absence of NO, which then resembles the conditions discussed by Kirkby et al. (10) at close proximity.
We started the identification of the ion cluster formation events by filtering out all evenings with precipitation detected after 1600 [local time, universal time (UT) +2] to exclude all potential rain-induced events from our analysis (17). Consistent with previous observations at the site (18–20), 25 of the 32 evenings included in our analysis were classified as evening events (~78%), during which we identified a distinct rise in the 1.5- to 2.5-nm ion concentration measured with a Neutral cluster and Air Ion Spectrometer (NAIS; see Materials and Methods for a detailed description of the instrumental setup), with similar observations for both polarities (Fig. 1). Three evenings were classified as nonevent, and the last four were considered as undefined. Because our mass spectrometer was operated to measure negative ions, we proceeded by analyzing only negatively charged clusters from the NAIS. Owing to this last information, ion data discussed in the next sections will implicitly refer to negative polarity only.
Fig. 1. Classification of the charged cluster formation events.
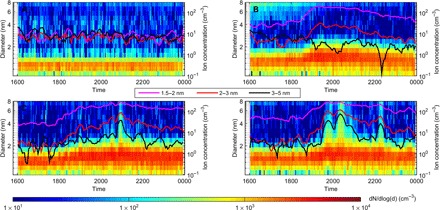
Classification was performed using NAIS surface plots and time series of ions concentration in various size ranges, including 1.5 to 2 nm, 2 to 3 nm, and 3 to 5 nm. (A) Nonevent evening on 12 April. (B) Minimum growth event on 21 April. (C) Medium growth event on 12 May. (D) Maximum growth event on 8 May.
The median concentration of 1.5- to 2.5-nm ions was 28 cm−3 at the beginning of the events and reached 180 cm−3 at the event peak time, with a major contribution of sub–2-nm clusters. As reported in Table 1, the formation rate of 1.5-nm charged clusters (; also, see Materials and Methods) was on average ~3 times higher compared to that in daytime NPF events observed at the same site (2). Cluster growth rates in the size range of 1.5 to 3 nm were also higher than those usually measured during daytime NPF events (21). However, in contrast to daytime, as expected from the ion concentrations in the aforementioned size bins, we did not observe the growth of ion clusters past a few nanometers during the evening events, similar to earlier publications (18–20). The limited growth of the clusters was additionally highlighted by the sharp decrease of the cluster formation rate as the cluster size increases, as illustrated in fig. S1. The observed events were further classified into three classes based on the size of the clusters at the end of their growth process (Fig. 1 and Table 1). These three event types will be hereafter referred to as Minimum, (final cluster size, <3 nm), Medium (final cluster size, between 3 and 4 nm), and Maximum (final cluster size, >4 nm) growth events, with Minimum growth events being the most frequent. As presented in Table 1, the detection of ion clusters at larger sizes during Maximum growth events (up to NAIS channel with a mean diameter of 6 nm) consistently coincided with higher cluster formation and early growth rates compared to other event types, with average being, for instance, ~2.7 times higher than that measured during Minimum growth events.
Table 1. Characteristics of the observed evening events.
All 25 events were classified into three groups (Minimum, Medium, and Maximum growth events) based on the size of the clusters at the end of the growth process (second column). The number of events in each class is indicated in the first column. Cluster ion (1.5 nm) formation rates (J1.5−) and cluster growth rate in the range of 1.5 to 3 nm (GR1.5–3) are reported in the third and fourth columns, respectively. The reported values are given as mean ± 1σ, either calculated from all events or from events of the specified type.
| Type of events (frequency) | Final cluster size | (×10−1 cm−3) | GR1.5−3 (nm hour−1) |
| All events | — | 2.6 ± 2.3 | 2.8 ± 1.4 |
| Minimum growth events (18) | <3 nm | 2.1 ± 1.6 | 2.5 ± 1.3 |
| Medium growth events (4) | Between 3 and 4 nm | 3.5 ± 2.7 | 3.2 ± 0.9 |
| Maximum growth events (3) | >4 nm | 5.5 ± 3.9 | 4.0 ± 2.1 |
On event evenings, the median start time of ion cluster formation was 1815, that is, on average, 2 hours before sunset, with no clear distinction between different event types (fig. S2). The earliest events were observed to start slightly after 1600. Most of the Minimum growth events (67%) were peaking after daylight had completely disappeared, whereas by contrast, half of the Medium growth events and most of Maximum growth events (two of three) were on average peaking slightly before sunset, up to almost 1 hour before dark.
Evidence for the major implication of monoterpene oxidation products in the early stage of ion cluster formation
Concurrent with the occurrence of evening events, we observed a build-up of naturally charged HOM compounds using an atmospheric pressure interface–time-of-flight mass spectrometer (APi-TOF; Fig. 2). Assuming monoterpenes (C10H16) are the dominant precursors for HOMs at this site (16), the mass/charge (m/z) range was divided into three subranges for the present study. We defined monomers (carbon numbers 9 and 10), dimers (carbon numbers 16 to 20), and trimers (carbon numbers 27 to 30) to be the sum of HOM peaks in the ranges of m/z = 300 to 400 Thomson (Th), 500 to 650 Th, and 750 to 850 Th, respectively. The averaged time evolution of the mass spectra calculated from all event evenings shows that monomers typically dominated the mass spectrum until 1900, after which dimers and trimers progressively took over (Fig. 2A). As demonstrated earlier by Yan et al. (15), the aforementioned modifications of the mass spectrum could be, to a large extent, explained by the diurnal variation of the oxidation mechanisms responsible for the formation of HOMs. In particular, active photochemistry during daytime supports the production of NO and HO2, which are known to be efficient peroxy radical (RO2) terminators and in turn prevent the formation of dimers, which are closed-shell molecules assumed to be formed through the reaction between two RO2 (22). On the other hand, the absence of the abovementioned terminators during evening-time and nighttime hours supports the appearance of dimers and in turn trimers because those most likely result from the clustering of monomers and dimers (23). The average molecular growth rate resulting from this progressive HOMs build-up process was estimated to be 181.8 atomic mass unit (amu) hour−1 between 1800 and 2100 (Fig. 2A; also, see Materials and Methods). Assuming an average density of 1400 kg m−3 for the clusters, this growth rate is equivalent to 0.14 nm hour−1, comparable to daytime values reported for the same size range by Kulmala et al. (2). The HOMs build-up is further illustrated in Fig. 2B, which shows one example of a mass defect plot [that is, the difference between the exact mass and the nominal mass (24)], during which it was possible to detect tetramers, that is, HOMs containing up to 40 carbon atoms. According to Frege et al. (23), those probably result from the collision of two dimers.
Fig. 2. Build-up process of naturally negatively charged HOMs.
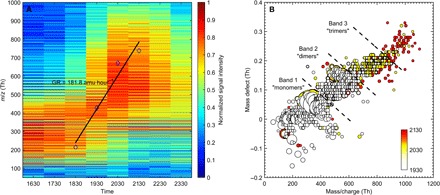
(A) Averaged time evolution of the mass spectra calculated from all 25 event evenings between 1600 and 0000 (local time, UT +2). The solid line and corresponding diamonds illustrate the molecular growth rate resulting from the HOMs build-up process. (B) Mass defect plot for the cluster formation event detected on 20 April. The mass defect, that is, the difference between the exact mass and the nominal mass, is shown on the ordinate. The area of the dots is proportional to the intensity of the observed signal, and the color scale indicates the time at which each of the three mass spectra was measured. The presence of HOM monomers, dimers, and trimers is evidenced on the mass defect plot and their progressive appearance from 1930 to 2130. By contrast, clusters resulting from based-stabilized nucleation of H2SO4 with NH3 or amines are not observed at any time.
We investigated the relationship between the observations of the ion and mass spectrometers by checking the correlation between the APi-TOF signal of selected mass ranges and the charged cluster concentration measured with the NAIS in different size bins. Among the most possible combinations (table S1), strong correlations were found between the concentrations of 1.44-nm ions and HOM dimers (R2 = 0.84; Fig. 3A) and between the concentrations of 1.66-nm ions and HOM trimers (R2 = 0.65; Fig. 3B), consistent with expectations from the mass-to-diameter conversion. The tight connection between the HOMs build-up and the formation of charged clusters was further supported by the similar temporal variation of and HOM dimers signal (Fig. 3C). The median HOM dimers and trimers signals were on average ~2 times higher during the active cluster formation period, that is, ~1900 to 2200, compared to the same period on nonevent evenings (fig. S3, A and C, and table S2A). In addition, although similar signal intensities were observed during all the events regardless of their type, the highest HOM dimers and trimers signals were detected during the active cluster formation period on Maximum growth event evenings. By contrast, similar signals were measured for monomers on event and nonevent evenings (fig. S4 and table S2A), suggesting that monomers were not directly connected to the occurrence of the evening events. The latter supports previous observations reported by Kulmala et al. (2) during daytime NPF. Also, Mohr et al. (25) have discussed the importance of HOM dimers in atmospheric NPF.
Fig. 3. Relationship between ion and mass spectrometers observations.
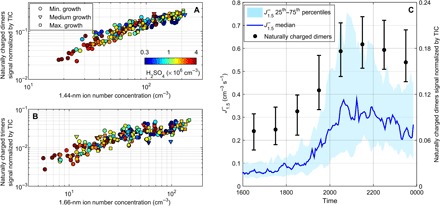
(A) Normalized HOM dimers signal as a function of 1.44-nm negative ion number concentration. Concentrations and signal intensities are 1-hour averages from all event evenings between 1600 and 0000. (B) Same as (A) with HOM trimers and 1.66-nm negatively charged clusters. (C) Averaged time series of the HOM dimers signal normalized by total ion count (TIC) and formation rate of 1.5-nm negatively charged clusters on event evenings. Black circles represent the median of the normalized HOM dimers signal, whereas lower and upper limits of the error bars represent the 25th and 75th percentiles, respectively.
In addition, sulfuric acid was measured with an APi-TOF equipped with a nitrate ion-based chemical ionization (CI) inlet (CI-APi-TOF). As evidenced in Fig. 3, H2SO4 concentration was below ~4 × 106 cm−3 during the observed events, with a median level of 8.4 × 105 cm−3 (fig. S5 and table S2A). These values are slightly higher compared to those reported by Kirkby et al. (10) during ion-induced nucleation of pure biogenic particles in the CLOUD chamber, and thus, we cannot totally exclude participation of H2SO4 in the evening events in Hyytiälä. However, at these concentrations, H2SO4 is neither expected to efficiently participate in the cluster formation process nor significantly influence the formation rates (9, 10), at least without the involvement of bases such as ammonia (NH3) or amines (4, 26). As anticipated, the cluster formation rates measured during evening time in Hyytiälä were several orders of magnitude higher compared to those expected from binary ion induced nucleation of H2SO4–H2O in similar conditions (4, 27). Also, as illustrated on Fig. 2B, the mass defect plots obtained during the observed evening events did not indicate the formation of H2SO4–NH3 nor H2SO4–amine clusters and contrasted with those characteristic of base-stabilized nucleation of H2SO4 in the presence of NH3 or amines (12). This indicates that H2SO4-driven pathways, that is, both acid-base and H2SO4–H2O binary nucleation, could not dominate the evening-time formation of ion clusters, which was instead driven by monoterpene oxidation products that we detected with the APi-TOF. A strong implication of H2SO4 in the cluster formation process together with HOMs was also unlikely because HSO4−-HOM clusters were only observed during daytime in Hyytiälä, whereas HOMs were rather clustered with nitrate radical during the night (13). Instead, slightly higher H2SO4 concentrations observed on event evenings were most likely explained by increased amounts of stabilized Criegee intermediates, whose production was previously reported to be tightly connected to that of HOMs (28). All in all, our observations thus present the first direct evidence of an atmospheric ion cluster (1.5 to 3 nm) formation pathway dominated by biogenic HOMs.
Further insights into the chemical specificities of the HOMs involved in ion cluster formation
We further investigated the chemical specificities of the dimers involved in the formation of the charged clusters. On the basis of earlier work by Yan et al. (15), we used two subsets of peaks: the ozonolysis products of monoterpenes (that is, non-nitrate HOM dimers) and organonitrate HOM dimers (that is, nitrogen-containing compounds; table S3). The median signal of the non-nitrate HOM dimers was on average ~3 times higher during the active ion cluster formation period compared to the same time period on nonevent evenings, with the highest signals recorded during Maximum growth events (table S2A). In addition, a strong correlation was observed between the number concentration of 1.44-nm ion clusters and the signal of non-nitrate dimers (R2 = 0.75; Fig. 4A). By contrast, because of an important variability of their signal, organonitrate dimers did not fully correlate with the 1.44-nm ion number concentration (R2 = 0.07; Fig. 4B), and the difference between event and nonevent evening median signals was not as pronounced as for non-nitrate compounds (fig. S6C and table S2A). As a result, non-nitrate HOM dimers were more abundant relative to organonitrates during Maximum growth events, suggesting that nitrogen-containing compounds could be less efficient in forming and growing the clusters than non-nitrate compounds.
Fig. 4. Insights into the identification of the charged HOMs involved in the formation of negatively charged clusters.
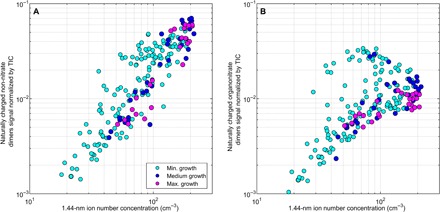
Normalized signals of (A) non-nitrate and (B) organonitrate HOM dimers as a function of 1.44-nm negative ion number concentration. Concentrations and signal intensities are 1-hour averages from all event evenings between 1600 and 0000.
Effect of various atmospheric parameters on HOMs production and subsequent ion cluster formation
To further identify the conditions favoring the production of HOMs and subsequent formation of organic clusters, we investigated the time evolution of several meteorological and atmospheric variables. For simplicity, we compare Maximum growth events and nonevent evenings in Fig. 5 while showing all event types in fig. S7 and table S2B. The medians of monoterpene and ozone concentrations were ~4 and 1.5, respectively, times higher during the active cluster formation period on Maximum growth events compared to the same time period on nonevent evenings, when temperature and global radiation were also higher (Fig. 5, A and B, and table S2B). In contrast to the abovementioned HOM-source related variables, relative humidity and condensation sink (CS) had median values ~2.5 and 4 times lower on event evenings, respectively (Fig. 5C and table S2B). The former observation related to monoterpene and ozone concentrations supported an enhanced production of RO2 on event evenings and subsequent higher probability of RO2–RO2 reaction. This, together with lower CS, most likely explains the higher dimer signals measured on those specific evenings compared to nonevent evenings. Explicitly combining the aforementioned variables in a proxy describing the formation of monoterpene ozonolysis products further highlighted their synergistic effect, both on the occurrence of cluster formation and on the ability of the ion clusters to grow (Fig. 5D, fig. S7, and table S2B; see Materials and Methods). On Maximum growth event evenings, the conditions favored the formation of monoterpene ozonolysis products compared to other evenings, which most probably explained the higher formation and early growth rates of organic ion clusters on those specific evenings (Table 1). The survival probability of the clusters increased as well, resulting in the observation of larger clusters compared to other evenings.
Fig. 5. The effect of various parameters on HOMs production and subsequent ion cluster formation.
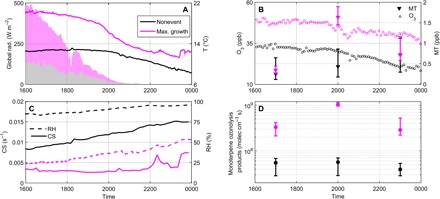
Throughout, colors indicate evening type, that is, nonevent (black) or Maximum growth events (magenta). In (A) to (C), when not specified, reported values are medians calculated over all the evenings belonging to each class. (A) Global radiation (left ordinate) and temperature (right ordinate). (B) Ozone (left ordinate) and monoterpene (right ordinate) concentrations. In addition to median concentrations (triangles), the 25th and 75th percentiles are also reported for monoterpene concentration, corresponding respectively to the lower and upper limits of the error bars. (C) CS (left ordinate) and relative humidity (right ordinate). (D) Proxy for the concentration of monoterpene ozonolysis products. Markers stand for median values, whereas lower and upper limits of the error bars represent the 25th and 75th percentiles, respectively.
DISCUSSION
Consistent with previous observations at the site (18–20), we report the frequent (~78%) evening-time formation of charged clusters at the boreal SMEAR II station in Hyytiälä during spring 2013. Our results demonstrate, for the first time, that the first step of ion-induced NPF, that is, initial ion cluster formation and growth, can be active under atmospheric conditions in a system dominated by biogenic vapors at very low H2SO4 concentrations.
As pointed out earlier in this work, the growth of the ion clusters up to 3 nm was on average faster during evening events compared to that in daytime NPF events at the same site (21). This observation is most likely explained by the fact that dimers, which are more efficiently produced in the evening, represent a significant fraction of the extremely low VOCs (ELVOCs) shown to be the major organic contributor to cluster growth in this size range (8). Nevertheless, in contrast to daytime, the growth of observed ion clusters did not exceed 6 nm. Instrumental limitations prevent a complete understanding of the reasons for this limited growth. We are currently unable to measure the chemical composition of clusters after they have grown out of the size range where they can be detected by ion mass spectrometers, such as the APi-TOF (>~2 nm), and before they are sufficiently large to be characterized by aerosol mass spectrometers (<~ 100 nm). As a result, the compounds, which are involved in the growth of these “intermediate”-sized particles, have not been directly characterized yet. Using a dynamic volatility basis set model, Tröstl et al. (8) were able to demonstrate that, besides ELVOCs, low VOCs (LVOCs) are needed to explain observed particle growth past 2 nm. Among other sources, the reaction of first-generation oxidation products of monoterpenes with OH radicals was reported to produce these compounds in the atmosphere (8, 12). We thus hypothesize that during evening events, when solar radiation is progressively diminishing, the photochemical processes responsible for OH production are inhibited and that less LVOCs are produced, which might be one the main reasons for the limited cluster growth. In addition, the decreasing of ozonolysis products of monoterpenes after 2000 (Fig. 5, B and D) limits the growth of particles during the night.
Our observations, however, do not preclude the possibility of atmospheric clusters growing further in a system dominated by biogenic vapors when photochemistry is active and produces enough HOMs. The observations reported by Kirkby et al. (10) and Tröstl et al. (8) slightly differ from our results because ozonolysis alone was able to support particle growth beyond 20 nm in the CLOUD chamber. This might be, at least partly, related to lower CS in the chamber or the absence of NOx during the discussed experiments, which meant that all the produced HOMs were nitrogen-free. However, in Hyytiälä, cluster formation and further growth seem to be decoupled processes (2).
Assessing the effect of biogenic cluster formation pathways on a global scale will require multiple observations, including, for instance, the analysis of daytime events detected in pristine environments such as the Amazon forest (29). Providing a comprehensive description of biogenic ion cluster formation pathways from atmospheric observations will, above all, improve the understanding of preindustrial climate and predictions of future climate. In climate model simulations, an accurate representation of this source of biogenic particles is especially needed to simulate preindustrial conditions because they form the baseline to calculate the radiative forcing caused by anthropogenic emissions. Getting more insight into the formation of pure biogenic particles will also help predict future climate change because this process will most likely be favored by a strong reduction of anthropogenic SO2 and NOx emissions and the simultaneous increase of BVOC emissions caused by warmer temperatures (30, 31). The intensification of various stressors for plants, such as heat waves, droughts, and infestation, would also cause additional emissions of BVOCs (32), which might result in even larger amounts of HOMs leading to higher significance of biogenic NPF in low-H2SO4 environments.
MATERIALS AND METHODS
Instrumental setup
Measurements were performed during spring 2013 (9 April to 15 June) at the SMEAR II station located in Hyytiälä, Southern Finland (61°510°N, 24°170°E, 180 m above sea level) (33). The site is mainly surrounded by a Scots pine forest representative of the boreal coniferous forest where BVOC emissions are dominated by monoterpenes (14), among which α-pinene is a major HOM precursor (6).
Monoterpene volume mixing ratios (VMRs) were continuously monitored at the station with a quadrupole proton transfer reaction mass spectrometer (PTR-MS; Ionicon Analytik GmbH) (34) dedicated to real-time monitoring of VMRs down to tens of parts per thousand. Sampling was performed every 3 hours, and monoterpene concentrations were derived from the signal obtained at m/z = 137. The instrumental background was determined every 3 hours using a zero-air generator producing VOC-free air (Parker ChromGas, model 3501). More details about the instrument setup and data analysis can be found in the study of Rantala et al. (35).
The detection of ion cluster formation events was achieved from the analysis of the ion size distributions measured with a NAIS (Airel) (36). In “ion mode,” the NAIS simultaneously provides the concentration of both positive and negative ions in the mobility range of 3.2 to 0.0013 cm2V−1s−1, corresponding to 0.8 to 42 nm. In “particle mode,” the instrument measures the number size distribution of total particles in the range of ~2 to 42 nm. Measurements were performed with a time resolution of 3 min. In addition, particle number size distributions in the size range of 3 to 1000 nm were measured using a differential mobility particle sizer (DMPS) with a time resolution of 10 min. On the basis of a previous work by Kulmala et al. (37), the DMPS particle number size distributions were further used to calculate the CS, which describes the loss rate of vapors related to their condensation on aerosols particles.
The chemical composition of naturally charged ions was measured with an APi-TOF (Aerodyne Research Inc. and TOFWERK AG) (38) mass spectrometer. The APi-TOF consists of a TOF mass spectrometer capable of determining m/z with a resolution >3000 Th/Th in high vacuum conditions, coupled to an APi unit designed to sample ions from ambient pressure at ~0.8 liters/min. During the campaign conducted in spring 2013, the instrument was operated to characterize negative ions. The measurements discussed in this study are given as 1-hour averages, all normalized with respect to the TIC to avoid effects related to changes in the TIC, even if they are minimal (see fig. S8).
To evaluate H2SO4 concentration, a second APi-TOF was equipped with a nitrate ion-based CI inlet [CI-APi-TOF (39)]. The CI inlet allowed for the artificial charging of neutral molecules by NO3− ions. Those were produced by exposing clean air (sheath flow) containing nitric acid (HNO3) to α radiation (10-megabecquerel 241Am source) or x-rays, and they were guided into the sample flow by an electric field, where they further ionized neutral molecules. Ionized molecules then enter the TOF mass analyzer through a critical orifice. The CI-APi-TOF calibration was based on H2SO4 detection. The measurements discussed in this study are given as 30-min averages. Both APi-TOF and CI-APi-TOF measurements were analyzed using the MATLAB-based software package tofTools (6.07) developed at the University of Helsinki (38).
Ozone concentration was monitored with an analyzer based on the absorption of ultraviolet light (Thermo Environmental Instruments 49C, Thermo Fisher Scientific). Measurements were performed with a time resolution of 1 min, and detection limit of the instrument is about 1 part per billion. Global radiation (0.3 to 4.8 μm) was measured with a pyranometer (Middleton Solar SK08, Middleton Solar). Temperature was measured using a PT-100 sensor, and relative humidity was monitored with relative humidity sensors (Rotronic HygroMet MP102H with Hygroclip HC2-S3, Rotronic AG). All were measured with a time resolution of 1 min.
Particle and ion number size distributions, together with the chemical composition of negative ions and H2SO4 concentration, were measured at ground level. Other abovementioned measurements were in contrast performed on a mast. Data from the lowest height (4.2 m) were used in the present work for consistency with measurements conducted at ground level, except for global radiation, which was measured at 18 m.
Determination of the ion cluster formation and growth rates from NAIS measurements
The formation rate of 1.5-nm negative ions () was calculated according to Kulmala et al. (40)
| (1) |
is the number concentration of 1.5- to 2.5-nm negative ions, is the number concentration of positive ions smaller than 2.5 nm, and is the number concentration of negative ions smaller than 1.5 nm, all derived from NAIS measurements. CoagS1.5 is the coagulation sink of 1.5-nm charged clusters due to their coagulation on larger pre-existing particles and was calculated using the particle number size distributions measured with the DMPS.
GR1.5 − 3 is the growth rate of the ion clusters between 1.5 and 3 nm. The growth rates were calculated separately for the two polarities using the ion size distributions measured with the NAIS and following the “appearance time” method described in details in Lehtipalo et al. (41). The growth rate values used in the present work were averaged from the two polarities.
The fourth term of Eq. 1 represents the loss of 1.5- to 2.5-nm negative ions due to their recombination with sub–2.5 nm positive ions, whereas the fifth term represents the gain of ions caused by the attachment of sub–1.5 nm negative ions on 1.5- to 2.5-nm neutral clusters. The number concentration of 1.5- to 2.5-nm neutral clusters N1.5 − 2.5 needed for the calculation of this last term was not available for all the events. However, in their recent study, Mazon et al. (18) have shown that the attachment term only accounted for <2% to the overall value of . Assuming a similar effect on the calculation of , the fifth term of Eq. 1 was thus neglected. The value of 1.6 × 10⁻⁶ cm3s−1 was used for the recombination rate coefficient α (42).
Determination of the early ion cluster growth rate from Api-TOF measurements
For this study, we used the APi-TOF spectra, which were collected every hour between 1600 and 0000. The average of all event evenings shown on Fig. 2A was calculated by taking the mean of all spectra collected at each hour. Before the averaging step, each spectrum was converted from high-resolution m/z to unit mass resolution, after which every unit mass was then divided by its maximum signal on each day individually. The resulting normalized spectra allowed for the comparison of the evolution pattern of the signal of each unit mass between the different evenings regardless of potential day-to-day changes in the absolute intensity of the signal.
The early ion cluster growth rate was determined from the averaged mass spectrum shown on Fig. 2A. For each hour in the time range of 1600 to 0000, we first identified the masses with the highest normalized signal intensity and then plotted the probability distribution by fitting a Gaussian to these masses. The growth rate was then determined by a linear least-square fit through the mean of the Gaussians obtained at each hour. The growth rate calculation was restricted to the period of 1800 to 2100. The uncertainty on the growth rate calculation arising from the last linear-fitting step was 117.5 amu hour−1 (95% confidence bound). This value is at the lower limit of the actual uncertainty because other factors were likely to affect the determination of the growth rate, including the mass calibration of the instrument (which directly determines the location of the peaks on the mass axis), the averaging and the normalization of the mass spectra, and the use of a probability distribution. However, the effects of these last factors were complex to quantify and were thus left behind for further investigation.
To compare the growth rate derived from APi-TOF measurements (in amu hour−1) with those reported in the literature (in nm hour−1), we converted APi-TOF–derived atomic mass units per hour values to nanometers per hour values. We based the mass-to-diameter conversion on Tammet (43), using a cluster density of 1400 kg m−3. A similar value was recently used by Tröstl et al. (8). The mean masses of the Gaussians used to determine the growth rate from APi-TOF measurements were converted according to this method. The growth rate in nanometers per hour was then determined by a linear least-square fit through these diameters, being 0.14 nm hour−1 (±0.12 nm hour−1, 95% confidence bounds derived from linear fitting).
Proxy for monoterpene ozonolysis products
The concentration of ozonolysis products of monoterpenes was calculated based on their production in the reaction with ozone and their loss by condensation on pre-existing aerosol particles. The production term was calculated from the measured concentrations of ozone ([O3]) and monoterpenes ([MT]) taking into account the reaction rate between them (kO3+MT), whereas the sink term was represented by the CS calculated from the DMPS number size distributions (37)
| (2) |
The reaction rate kO3+MT was determined following the methodology previously suggested by Kontkanen et al. (44). Briefly, to get the correct diurnal cycle, kO3+MT was first calculated from a temperature-dependent relation developed for α-pinene. The obtained values were then modulated using monthly mean rates to take into account the seasonal changes in the composition of monoterpenes.
Supplementary Material
Acknowledgments
We acknowledge T. Nieminen, H. Manninen, J. Kontkanen, and M. Riva for useful discussions. We also acknowledge the personnel of the Hyytiälä Forestry Field Station and all researchers and students involved in the measurement campaign discussed in the present manuscript for help during field measurements. We thank the tofTools team for providing tools for mass spectrometry analysis. Funding: This work was funded by the Academy of Finland Centre of Excellence Program (grant no. 272041), the Doctoral Programme in Atmospheric Sciences (University of Helsinki), the European Research Council [ERC; GASPARCON (Molecular steps of gas-to-particle conversion: From oxidation to precursors, clusters and secondary aerosol particles) grant no. 714621], and the ERC under the European Union’s Horizon 2020 Research and Innovation Programme (grant agreement no. 742206). In addition, K.L. acknowledges funding from European Commission’s Horizon 2020 programme (Marie Skłodowska-Curie Actions–Individual Fellowships project NanoCAVa, no. 656994), and F.B. acknowledges funding from the Swiss National Science Foundation (grant P2EZP2_168787). Author contributions: M.K., T.P., K.L., and M.S. organized and designed the intensive measurement campaign. N.S., T.J., and H.J. conducted the measurements. H.J. contributed to the analytic tools. C.R., Q.Z., L.D., C.Y., S.B.M., and F.B. analyzed the data. C.R., L.D., V.-M.K., and K.L. wrote the manuscript. Competing interests: The authors declare they have no competing interests. Data and materials availability: All data needed to evaluate the conclusions in the paper are present in the paper and/or the Supplementary Materials. Additional data related to this paper may be requested from the authors. Raw data including meteorological variables, ozone and monoterpene concentrations, and particle size distributions from DMPS are available at https://avaa.tdata.fi/web/smart/smear. In addition, a time series of HOMs signal from APi-TOF and sulfuric acid concentration from CI-APi-TOF are available from the authors upon request.
SUPPLEMENTARY MATERIALS
Supplementary material for this article is available at http://advances.sciencemag.org/cgi/content/full/4/4/eaar5218/DC1
fig. S1. Ion cluster formation rates.
fig. S2. Time of sunset and beginning and event peak times for each of the 25 events.
fig. S3. Naturally charged HOM dimers and trimers.
fig. S4. Naturally charged HOM monomers.
fig. S5. Sulfuric acid concentration.
fig. S6. Non-nitrate and organonitrate HOM dimers.
fig. S7. Conditions favoring HOMs production and subsequent ion cluster formation.
fig. S8. Evolution of the APi-TOF TIC during the course of the measurement campaign.
table S1. Relationship between the observations of the ion and mass spectrometers.
table S2. Characterization of the active cluster formation period.
table S3. Subsets of compounds representative of non-nitrate and organonitrate HOM dimers.
REFERENCES AND NOTES
- 1.Merikanto J., Spracklen D. V., Mann G. W., Pickering S. J., Carslaw K. S., Impact of nucleation on global CCN. Atmos. Chem. Phys. 9, 8601–8616 (2009). [Google Scholar]
- 2.Kulmala M., Kontkanen J., Junninen H., Lehtipalo K., Manninen H. E., Nieminen T., Petäjä T., Sipilä M., Schobesberger S., Rantala P., Franchin A., Jokinen T., Järvinen E., Äijälä M., Kangasluoma J., Hakala J., Aalto P. P., Paasonen P., Mikkilä J., Vanhanen J., Aalto J., Hakola H., Makkonen U., Ruuskanen T., Mauldin R. L. III, Duplissy J., Vehkamäki H., Bäck J., Kortelainen A., Riipinen I., Kurtén T., Johnston M. V., Smith J. N., Ehn M., Mentel T. F., Lehtinen K. E. J., Laaksonen A., Kerminen V.-M., Worsnop D. R., Direct observations of atmospheric aerosol nucleation. Science 339, 943–946 (2013). [DOI] [PubMed] [Google Scholar]
- 3.Sipilä M., Berndt T., Petäjä T., Brus D., Vanhanen J., Stratmann F., Patokoski J., Mauldin R. L. III, Hyvärinen A.-P., Lihavainen H., Kulmala M., The role of sulfuric acid in atmospheric nucleation. Science 327, 1243–1246 (2010). [DOI] [PubMed] [Google Scholar]
- 4.Kirkby J., Curtius J., Almeida J., Dunne E., Duplissy J., Ehrhart S., Franchin A., Gagné S., Ickes L., Kürten A., Kupc A., Metzger A., Riccobono F., Rondo L., Schobesberger S., Tsagkogeorgas G., Wimmer D., Amorim A., Bianchi F., Breitenlechner M., David A., Dommen J., Downard A., Ehn M., Flagan R. C., Haider S., Hansel A., Hauser D., Jud W., Junninen H., Kreissl F., Kvashin A., Laaksonen A., Lehtipalo K., Lima J., Lovejoy E. R., Makhmutov V., Mathot S., Mikkilä J., Minginette P., Mogo S., Nieminen T., Onnela A., Pereira P., Petäjä T., Schnitzhofer R., Seinfield J. H., Sipilä M., Stozhkov Y., Stratmann F., Tomé A., Vanhanen J., Viisanen Y., Vrtala A., Wagner P. E., Walther H., Weingartner E., Wex H., Winkler P. M., Carslaw K. S., Worsnop D. R., Baltensperger U., Kulmala M., Role of sulphuric acid, ammonia and galactic cosmic rays in atmospheric aerosol nucleation. Nature 476, 429–433 (2011). [DOI] [PubMed] [Google Scholar]
- 5.Kulmala M., Toivonen A., Mäkelä J. M., Laaksonen A., Analysis of the growth of nucleation mode particles observed in Boreal forest. Tellus B 50, 449–462 (1998). [Google Scholar]
- 6.Ehn M., Thornton J. A., Kleist E., Sipilä M., Junninen H., Pullinen I., Springer M., Rubach F., Tillmann R., Lee B., Lopez-Hilfiker F., Andres S., Acir I.-H., Rissanen M., Jokinen T., Schobesberger S., Kangasluoma J., Kontkanen J., Nieminen T., Kurtén T., Nielsen L. B., Jørgensen S., Kjaergaard H. G., Canagaratna M., Dal Maso M., Berndt T., Petäjä T., Wahner A., Kerminen V.-M., Kulmala M., Worsnop D. R., Wildt J., Mentel T. F., A large source of low-volatility secondary organic aerosol. Nature 506, 476–479 (2014). [DOI] [PubMed] [Google Scholar]
- 7.Riipinen I., Yli-Juuti T., Pierce J. R., Petäjä T., Worsnop D. R., Kulmala M., Donahue N. M., The contribution of organics to atmospheric nanoparticle growth. Nat. Geosci. 5, 453–458 (2012). [Google Scholar]
- 8.Tröstl J., Chuang W. K., Gordon H., Heinritzi M., Yan C., Molteni U., Ahlm L., Frege C., Bianchi F., Wagner R., Simon M., Lehtipalo K., Williamson C., Craven J. S., Duplissy J., Adamov A., Almeida J., Bernhammer A.-K., Breitenlechner M., Brilke S., Dias A., Ehrhart S., Flagan R. C., Franchin A., Fuchs C., Guida R., Gysel M., Hansel A., Hoyle C. R., Jokinen T., Junninen H., Kangasluoma J., Keskinen H., Kim J., Krapf M., Kürten A., Laaksonen A., Lawler M., Leiminger M., Mathot S., Möhler O., Nieminen T., Onnela A., Petäjä T., Piel F. M., Miettinen P., Rissanen M. P., Rondo L., Sarnela N., Schobesberger S., Sengupta K., Sipilä M., Smith J. N., Steiner G., Tomè A., Virtanen A., Wagner A. C., Weingartner E., Wimmer D., Winkler P. M., Ye P., Carslaw K. S., Curtius J., Dommen J., Kirkby J., Kulmala M., Riipinen I., Worsnop D. R., Donahue N. M., Baltensperger U., The role of low-volatility organic compounds in initial particle growth in the atmosphere. Nature 533, 527–531 (2016). [DOI] [PMC free article] [PubMed] [Google Scholar]
- 9.Bianchi F., Tröstl J., Junninen H., Frege C., Henne S., Hoyle C. R., Molteni U., Herrmann E., Adamov A., Bukowiecki N., Chen X., Duplissy J., Gysel M., Hutterli M., Kangasluoma J., Kontkanen J., Kürten A., Manninen H. E., Münch S., Peräkylä O., Petäjä T., Rondo L., Williamson C., Weingartner E., Curtius J., Worsnop D. R., Kulmala M., Dommen J., Baltensperger U., New particle formation in the free troposphere: A question of chemistry and timing. Science 352, 1109–1112 (2016). [DOI] [PubMed] [Google Scholar]
- 10.Kirkby J., Duplissy J., Sengupta K., Frege C., Gordon H., Williamson C., Heinritzi M., Simon M., Yan C., Almeida J., Tröstl J., Nieminen T., Ortega I. K., Wagner R., Adamov A., Amorim A., Bernhammer A.-K., Bianchi F., Breitenlechner M., Brilke S., Chen X., Craven J., Dias A., Ehrhart S., Flagan R. C., Franchin A., Fuchs C., Guida R., Hakala J., Hoyle C. R., Jokinen T., Junninen H., Kangasluoma J., Kim J., Krapf M., Kürten A., Laaksonen A., Lehtipalo K., Makhmutov V., Mathot S., Molteni U., Onnela A., Peräkylä O., Piel F., Petäjä T., Praplan A. P., Pringle K., Rap A., Richards N. A. D., Riipinen I., Rissanen M. P., Rondo L., Sarnela N., Schobesberger S., Scott C. E., Seinfield J. H., Sipilä M., Steiner G., Stozhkov Y., Stratmann F., Tomé A., Virtanen A., Vogel A. L., Wagner A. C., Wagner P. E., Weingartner E., Wimmer D., Winkler P. M., Ye P., Zhang X., Hansel A., Dommen J., Donahue N. M., Worsnop D. R., Baltensperger U., Kulmala M., Carslaw K. S., Curtius J., Ion-induced nucleation of pure biogenic particles. Nature 533, 521–526 (2016). [DOI] [PMC free article] [PubMed] [Google Scholar]
- 11.Gordon H., Sengupta K., Rap A., Duplissy J., Frege C., Williamson C., Heinritzi M., Simon M., Yan C., Almeida J., Tröstl J., Nieminen T., Ortega I. K., Wagner R., Dunne E. M., Adamov A., Amorim A., Bernhammer A.-K., Bianchi F., Breitenlechner M., Brilke S., Chen X., Craven J. S., Dias A., Ehrhart S., Fischer L., Flagan R. C., Franchin A., Fuchs C., Guida R., Hakala J., Hoyle C. R., Jokinen T., Junninen H., Kangasluoma J., Kim J., Kirkby J., Krapf M., Kürten A., Laaksonen A., Lehtipalo K., Makhmutov V., Mathot S., Molteni U., Monks S. A., Onnela A., Peräkylä O., Piel F., Petäjä T., Praplan A. P., Pringle K. J., Richards N. A. D., Rissanen M. P., Rondo L., Sarnela N., Schobesberger S., Scott C. E., Seinfield J. H., Sharma S., Sipilä M., Steiner G., Stozhkov Y., Stratmann F., Tomé A., Virtanen A., Vogel A. L., Wagner A. C., Wagner P. E., Weingartner E., Wimmer D., Winkler P. M., Ye P., Zhang X., Hansel A., Dommen J., Donahue N. M., Worsnop D. R., Baltensperger U., Kulmala M., Curtius J., Carslaw K. S., Reduced anthropogenic aerosol radiative forcing caused by biogenic new particle formation. Proc. Natl. Acad. Sci. U.S.A. 113, 12053–12058 (2016). [DOI] [PMC free article] [PubMed] [Google Scholar]
- 12.Schobesberger S., Junninen H., Bianchi F., Lönn G., Ehn M., Lehtipalo K., Dommen J., Ehrhart S., Ortega I. K., Franchin A., Nieminen T., Riccobono F., Hutterli M., Duplissy J., Almeida J., Amorim A., Breitenlechner M., Downard A. J., Dunne E. M., Flagan R. C., Kajos M., Keskinen H., Kirkby J., Kupc A., Kürten A., Kurtén T., Laaksonen A., Mathot S., Onnela A., Praplan A. P., Rondo L., Santos F. D., Schallhart S., Schnitzhofer R., Sipilä M., Tomé A., Tsagkogeorgas G., Vehkamäki H., Wimmer D., Baltensperger U., Carslaw K. S., Curtius J., Hansel A., Petäjä T., Kulmala M., Donahue N. M., Worsnop D. R., Molecular understanding of atmospheric particle formation from sulfuric acid and large oxidized organic molecules. Proc. Natl. Acad. Sci. U.S.A. 110, 17223–17228 (2013). [DOI] [PMC free article] [PubMed] [Google Scholar]
- 13.Bianchi F., Garmash O., He X., Yan C., Iyer S., Rosendahl I., Xu Z., Rissanen M. P., Riva M., Taipale R., Sarnela N., Petäjä T., Worsnop D. R., Kulmala M., Ehn M., Junninen H., The role of highly oxygenated molecules (HOMs) in determining the composition of ambient ions in the boreal forest. Atmos. Chem. Phys. 17, 13819–13831 (2017). [Google Scholar]
- 14.Hakola H., Tarvainen V., Bäck J., Ranta H., Bonn B., Rinne J., Kulmala M., Seasonal variation of mono- and sesquiterpene emission rates of Scots pine. Biogeosciences 3, 93–101 (2006). [Google Scholar]
- 15.Yan C., Nie W., Äijälä M., Rissanen M. P., Canagaratna M. R., Massoli P., Junninen H., Jokinen T., Sarnela N., Häme S. A. K., Schobesberger S., Canonaco F., Yao L., Prévôt A. S. H., Petäjä T., Kulmala M., Sipilä M., Worsnop D. R., Ehn M., Source characterization of highly oxidized multifunctional compounds in a boreal forest environment using positive matrix factorization. Atmos. Chem. Phys. 16, 12715–12731 (2016). [Google Scholar]
- 16.Ehn M., Kleist E., Junninen H., Petäjä T., Lönn G., Schobesberger S., Dal Maso M., Trimborn A., Kulmala M., Worsnop D. R., Wahner A., Wildt J., Mentel T. F., Gas phase formation of extremely oxidized pinene reaction products in chamber and ambient air. Atmos. Chem. Phys. 12, 5113–5127 (2012). [Google Scholar]
- 17.Tammet H., Hõrrak U., Kulmala M., Negatively charged nanoparticles produced by splashing of water. Atmos. Chem. Phys. 9, 357–367 (2009). [Google Scholar]
- 18.Mazon S. B., Kontkanen J., Manninen H. E., Nieminen T., Kerminen V.-M., Kulmala M., A long-term comparison of nighttime cluster events and daytime ion formation in a boreal forest. Boreal Environ. Res. 21, 242–261 (2016). [Google Scholar]
- 19.Junninen H., Hulkkonen M., Riipinen I., Nieminen T., Hirsikko A., Suni T., Boy M., Lee S.-H., Vana M., Tammet H., Kerminen V.-M., Kulmala M., Observations on nocturnal growth of atmospheric clusters. Tellus B 60, 365–371 (2008). [Google Scholar]
- 20.Lehtipalo K., Sipilä M., Junninen H., Ehn M., Berndt T., Kajos M. K., Worsnop D. R., Petäjä T., Kulmala M., Observations of Nano-CN in the Nocturnal Boreal Forest. Aerosol Sci. Technol. 45, 499–509 (2011). [Google Scholar]
- 21.Yli-Juuti T., Nieminen T., Hirsikko A., Aalto P. P., Asmi E., Hõrrak U., Manninen H. E., Patokoski J., Dal Maso M., Petäjä T., Rinne J., Kulmala M., Riipinen I., Growth rates of nucleation mode particles in Hyytiälä during 2003−2009: Variation with particle size, season, data analysis method and ambient conditions. Atmos. Chem. Phys. 11, 12865–12886 (2011). [Google Scholar]
- 22.Rissanen M. P., Kurtén T., Sipilä M., Thornton J. A., Kangasluoma J., Sarnela N., Junninen H., Jørgensen S., Schallhart S., Kajos M. K., Taipale R., Springer M., Mentel T. F., Ruuskanen T., Petäjä T., Worsnop D. R., Kjaergaard H. G., Ehn M., The formation of highly oxidized multifunctional products in the ozonolysis of cyclohexene. J. Am. Chem. Soc. 136, 15596–15606 (2014). [DOI] [PubMed] [Google Scholar]
- 23.Frege C., Ortega I. K., Rissanen M. P., Praplan A. P., Steiner G., Heinritzi M., Ahonen L., Amorim A., Bernhammer A.-K., Bianchi F., Brilke S., Breitenlechner M., Dada L., Dias A., Duplissy J., Ehrhart S., El-Haddad I., Fischer L., Fuchs C., Garmash O., Gonin M., Hansel A., Hoyle C. R., Jokinen T., Junninen H., Kirkby J., Kürten A., Lehtipalo K., Leiminger M., Mauldin R. L., Molteni U., Nichman L., Petäjä T., Sarnela N., Schobesberger S., Simon M., Sipilä M., Stolzenburg D., Tomé A., Vogel A. L., Wagner A. C., Wagner R., Xiao M., Yan C., Ye P., Curtius J., Donahue N. M., Flagan R. C., Kulmala M., Worsnop D. R., Winkler P. M., Dommen J., Baltensperger U., Influence of temperature on the molecular composition of ions and charged clusters during pure biogenic nucleation. Atmos. Chem. Phys. 18, 65–79 (2018). [Google Scholar]
- 24.Ehn M., Junninen H., Petäjä T., Kurtén T., Kerminen V.-M., Schobesberger S., Manninen H. E., Ortega I. K., Vehkamäki H., Kulmala M., Worsnop D. R., Composition and temporal behavior of ambient ions in the boreal forest. Atmos. Chem. Phys. 10, 8513–8530 (2010). [Google Scholar]
- 25.Mohr C., Lopez-Hilfiker F. D., Yli-Juuti T., Heitto A., Lutz A., Hallquist M., D’Ambro E. L., Rissanen M. P., Hao L., Schobesberger S., Kulmala M., Mauldin R. L. III, Makkonen U., Sipilä M., Petäjä T., Thornton J. A., Ambient observations of dimers from terpene oxidation in the gas phase: Implications for new particle formation and growth. Geophys. Res. Lett. 44, 2958–2966 (2017). [Google Scholar]
- 26.Almeida J., Schobesberger S., Kürten A., Ortega I. K., Kupiainen-Määttä O., Praplan A. P., Adamov A., Amorim A., Bianchi F., Breitenlechner M., David A., Dommen J., Donahue N. M., Downard A., Dunne E., Duplissy J., Ehrhart S., Flagan R. C., Franchin A., Guida R., Hakala J., Hansel A., Heinritzi M., Henschel H., Jokinen T., Junninen H., Kajos M., Kangasluoma J., Keskinen H., Kupc A., Kurtén T., Kvashin A. N., Laaksonen A., Lehtipalo K., Leiminger M., Leppä J., Loukonen V., Makhmutov V., Mathot S., McGrath M. J., Nieminen T., Olenius T., Onnela A., Petäjä T., Riccobono F., Riipinen I., Rissanen M., Rondo L., Ruuskanen T., Santos F. D., Sarnela N., Schallhart S., Schnitzhofer R., Seinfeld J. H., Simon M., Sipilä M., Stozhkov Y., Stratmann F., Tomé A., Tröstl J., Tsagkogeorgas G., Vaattovaara P., Viisanen Y., Virtanen A., Vrtala A., Wagner P. E., Weingartner E., Wex H., Williamson C., Wimmer D., Ye P., Yli-Juuti T., Carslaw K. S., Kulmala M., Curtius J., Baltensperger U., Worsnop D. R., Vehkamäki H., Kirkby J., Molecular understanding of sulphuric acid–amine particle nucleation in the atmosphere. Nature 502, 359–363 (2013). [DOI] [PMC free article] [PubMed] [Google Scholar]
- 27.Duplissy J., Merikanto J., Franchin A., Tsagkogeorgas G., Kangasluoma J., Wimmer D., Vuollekoski H., Schobesberger S., Lehtipalo K., Flagan R. C., Brus D., Donahue N. M., Vehkamäki H., Almeida J., Amorim A., Barmet P., Bianchi F., Breitenlechner M., Dunne E. M., Guida R., Henschel H., Junninen H., Kirkby J., Kürten A., Kupc A., Määttänen A., Makhmutov V., Mathot S., Nieminen T., Onnela A., Praplan A. P., Riccobono F., Rondo L., Steiner G., Tome A., Walther H., Baltensperger U., Carslaw K. S., Dommen J., Hansel A., Petäjä T., Sipilä M., Stratmann F., Vrtala A., Wagner P. E., Worsnop D. R., Curtius J., Kulmala M., Effect of ions on sulfuric acid-water binary particle formation: 2. Experimental data and comparison with QC-normalized classical nucleation theory. J. Geophys. Res. Atmos. 121, 1752–1775 (2016). [Google Scholar]
- 28.Mauldin R. L. III, Berndt T., Sipilä M., Paasonen P., Petäjä T., Kim S., Kurtén T., Stratmann F., Kerminen V.-M., Kulmala M., A new atmospherically relevant oxidant of sulphur dioxide. Nature 488, 193–196 (2012). [DOI] [PubMed] [Google Scholar]
- 29.Martin S. T., Andreae M. O., Althausen D., Artaxo P., Baars H., Borrmann S., Chen Q., Farmer D. K., Guenther A., Gunthe S. S., Jimenez J. L., Karl T., Longo K., Manzi A., Müller T., Pauliquevis T., Petters M. D., Prenni A. J., Pöschl U., Rizzo L. V., Schneider J., Smith J. N., Swietlicki E., Tota J., Wang J., Wiedensohler A., Zorn S. R., An overview of the Amazonian Aerosol Characterization Experiment 2008 (AMAZE-08). Atmos. Chem. Phys. 10, 11415–11438 (2010). [Google Scholar]
- 30.Lin G., Penner J. E., Zhou C., How will SOA change in the future? Geophys. Res. Lett. 43, 1718–1726 (2016). [Google Scholar]
- 31.Rogelj J., Rao S., McCollum D. L., Pachauri S., Klimont Z., Krey V., Riahi K., Air-pollution emission ranges consistent with the representative concentration pathways. Nat. Clim. Chang. 4, 446–450 (2014). [Google Scholar]
- 32.Zhao D. F., Buchholz A., Tillmann R., Kleist E., Wu C., Rubach F., Kiendler-Scharr A., Rudich Y., Wildt J., Mentel T. F., Environmental conditions regulate the impact of plants on cloud formation. Nat. Commun. 8, 14067 (2017). [DOI] [PMC free article] [PubMed] [Google Scholar]
- 33.Hari P., Kulmala M., Station for measuring ecosystem-atmosphere relations (SMEAR II). Boreal Environ. Res. 10, 315–322 (2005). [Google Scholar]
- 34.Taipale R., Ruuskanen T. M., Rinne J., Kajos M. K., Hakola H., Pohja T., Kulmala M., Technical Note: Quantitative long-term measurements of VOC concentrations by PTR-MS - measurement, calibration, and volume mixing ratio calculation methods. Atmos. Chem. Phys. 8, 6681–6698 (2008). [Google Scholar]
- 35.Rantala P., Aalto J., Taipale R., Ruuskanen T. M., Rinne J., Annual cycle of volatile organic compound exchange between a boreal pine forest and the atmosphere. Biogeosciences 12, 5753–5770 (2015). [Google Scholar]
- 36.Mirme S., Mirme A., The mathematical principles and design of the NAIS – a spectrometer for the measurement of cluster ion and nanometer aerosol size distributions. Atmos. Meas. Tech. 6, 1061–1071 (2013). [Google Scholar]
- 37.Kulmala M., Dal Maso M., Mäkelä J. M., Pirjola L., Väkevä M., Aalto P., Miikkulainen P., Hämeri K., O’Dowd C. D., On the formation, growth and composition of nucleation mode particles. Tellus B 53, 479–490 (2001). [Google Scholar]
- 38.Junninen H., Ehn M., Petäjä T., Luosujärvi L., Kotiaho T., Kostiainen R., Rohner U., Gonin M., Fuhrer K., Kulmala M., Worsnop D. R., A high-resolution mass spectrometer to measure atmospheric ion composition. Atmos. Meas. Tech. 3, 1039–1053 (2010). [Google Scholar]
- 39.Jokinen T., Sipilä M., Junninen H., Ehn M., Lönn G., Hakala J., Petäjä T., Mauldin R. L. III, Kulmala M., Worsnop D. R., Atmospheric sulphuric acid and neutral cluster measurements using CI-APi-TOF. Atmos. Chem. Phys. 12, 4117–4125 (2012). [Google Scholar]
- 40.Kulmala M., Petäjä T., Nieminen T., Sipilä M., Manninen H. E., Lehtipalo K., Dal Maso M., Aalto P. P., Junninen H., Paasonen P., Riipinen I., Lehtinen K. E. J., Laaksonen A., Kerminen V.-M., Measurement of the nucleation of atmospheric aerosol particles. Nat. Protoc. 7, 1651–1667 (2012). [DOI] [PubMed] [Google Scholar]
- 41.Lehtipalo K., Leppä J., Kontkanen J., Kangasluoma J., Franchin A., Wimmer D., Schobesberger S., Junninen H., Petäjä T., Sipilä M., Mikkilä J., Vanhanen J., Worsnop D. R., Kulmala M., Methods for determining particle size distribution and growth rates between 1 and 3 nm using the Particle Size Magnifier. Boreal Environ. Res. 19, 215–236 (2014). [Google Scholar]
- 42.Tammet H., Kulmala M., Simulation tool for atmospheric aerosol nucleation bursts. J. Aerosol Sci. 36, 173–196 (2005). [Google Scholar]
- 43.Tammet H., Size and mobility of nanometer particles, clusters and ions. J. Aerosol Sci. 26, 459–475 (1995). [Google Scholar]
- 44.Kontkanen J., Paasonen P., Aalto J., Bäck J., Rantala P., Petäjä T., Kulmala M., Simple proxies for estimating the concentrations of monoterpenes and their oxidation products at a boreal forest site. Atmos. Chem. Phys. 16, 13291–13307 (2016). [Google Scholar]
Associated Data
This section collects any data citations, data availability statements, or supplementary materials included in this article.
Supplementary Materials
Supplementary material for this article is available at http://advances.sciencemag.org/cgi/content/full/4/4/eaar5218/DC1
fig. S1. Ion cluster formation rates.
fig. S2. Time of sunset and beginning and event peak times for each of the 25 events.
fig. S3. Naturally charged HOM dimers and trimers.
fig. S4. Naturally charged HOM monomers.
fig. S5. Sulfuric acid concentration.
fig. S6. Non-nitrate and organonitrate HOM dimers.
fig. S7. Conditions favoring HOMs production and subsequent ion cluster formation.
fig. S8. Evolution of the APi-TOF TIC during the course of the measurement campaign.
table S1. Relationship between the observations of the ion and mass spectrometers.
table S2. Characterization of the active cluster formation period.
table S3. Subsets of compounds representative of non-nitrate and organonitrate HOM dimers.