. 2018 Mar 22;7:e32785. doi: 10.7554/eLife.32785

Figure 7. The HSN regulatory signature can be used to de novo identify HSN expressed genes.

(A) Position weight matrix logos of the HSN TF collective calculated from the functional binding sites in Figure 5. (B) HSN regulatory signature is more prevalent in the set of 96 known HSN expressed genes (yellow dot) compared to the distribution in 10,000 sets of random comparable genes (grey violin plot) (p<0.05). Considering phylogenetic conservation of HSN regulatory signature increases the enrichment of the HSN regulatory signature in the HSN expressed genes (p<0.01). See also Figure 7—figure supplement 1 for additional data. (C) HSN regulatory signature is enriched in neuronal genes compared to the non-neuronal genome. Inclusion of the conservation criteria in the HSN regulatory signature analysis strongly increases the difference between neuronal and non-neuronal genome. Pearson’s chi-squared test. ***p-value<0.0001. See also Figure 7—figure supplement 2 for additional data. (D) Gene ontology analysis of genes with HSN regulatory signature. p-values and number of genes corresponding to the biological processes enriched in genes with HSN regulatory signature. (E) Four representative examples of de novo identified HSN active enhancers. Black lines represent the coordinates covered by bioinformatically predicted HSN regulatory signature windows (indicated by ‘w’ and a number). Green lines mark the region used in our analysis. Dark blue bar profiles represent sequence conservation in C. briggsae, C. brenneri, C. remanei and C. japonica. n > 60 cells per line. See Figure 7—source data 1 for a list of all reporters and raw scoring data. Expression level of most of these reporters is regulated by unc-86 (Figure 7—figure supplement 3).

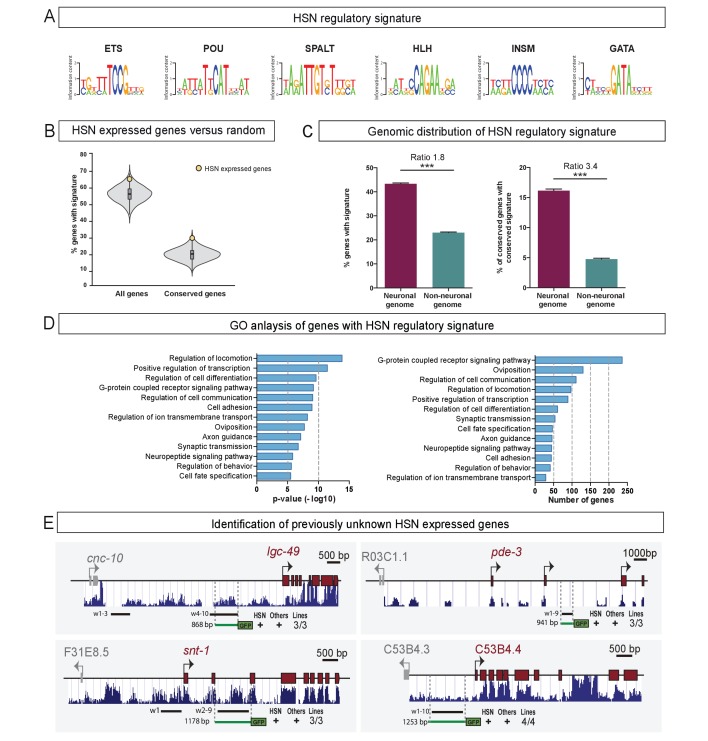
Figure 7—source data 1. Scripts for HSN regulatory signature analysis.
Related to Figure 7.
DOI: 10.7554/eLife.32785.022
Figure 7—source data 2. Raw scoring data of de novo finding of HSN enhancers and dependency on unc-86 function.
Related to Figure 7.
DOI: 10.7554/eLife.32785.023

Figure 7.

Figure 7—figure supplement 1. HSN regulatory signature distribution in HSN expressed genes.

Figure 7—figure supplement 1.

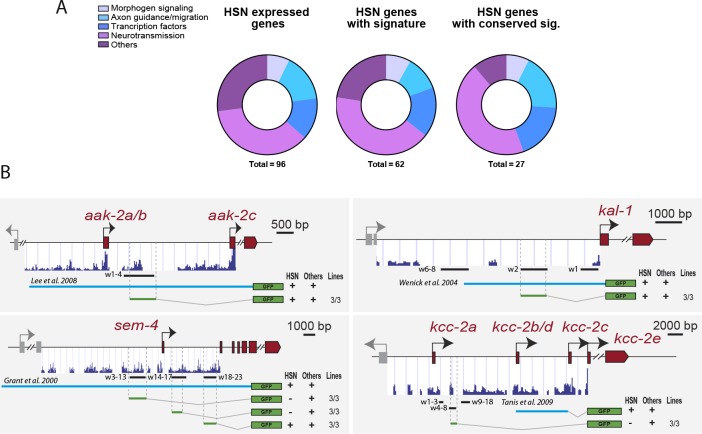
(A) No significant difference was found in the functional distribution of all HSN expressed genes compared tothe subset og genes with HSN regulatory signature or HSN expressed genes with conserved signature (chi-squared test computing p-values by Monte Carlo simulation p-value=0.59). (B) Reporter analysis to test functionality of HSN signature windows in HSN expressed genes. Black lines represent the coordinates covered by bioinformatically predicted HSN signature windows (indicated by w and a number). Light blue lines indicate the published reporter construct(PMID:18408008, PMID: 15177025, PMID: 10926783 and PMID:19675228) . Green lines mark the region used in our analysis. Dark blue bar profiles represent sequence conservation in C. briggsae, C. brenneri, C. remanei and C. japonica. See Figure 7—source data 1 for a list of all reporters and raw scoring data.
Figure 7—figure supplement 2. Analysis of the HSN regulatory signature including windows missing one or two TFBS motifs.

Figure 7—figure supplement 2.

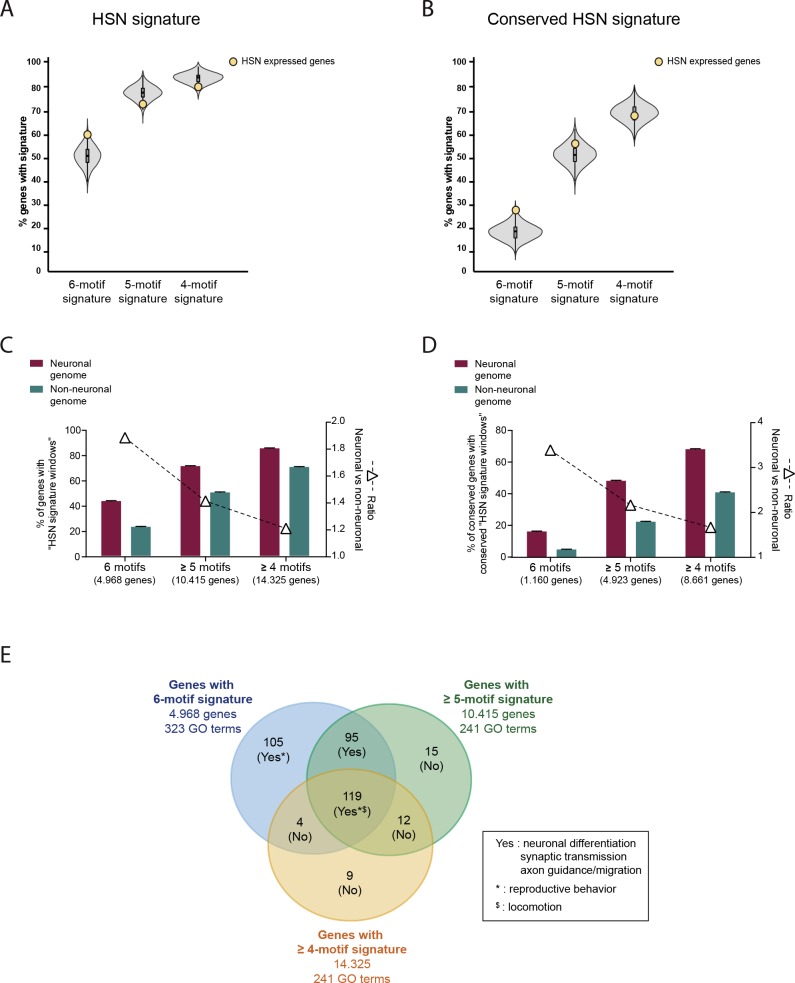
(A) HSN regulatory signature distribution in HSN expressed gene set (yellow dot) compared to 10,000 random sets of genes (grey violin plot). HSN signature windows with all six types of motifs (6-motif regulatory signature) are more prevalent in HSN expressed genes compared to random sets but this difference is not present when analyzing windows with only five types or four types of motifs (5-motif and 4-motif regulatory signature). (B) 5-motif and 4-motif regulatory signature is not preferentially found in HSN expressed genes even after filtering for conservation. (C) Genome distribution of 6-motif HSN regulatory signature windows compared to the signature distribution considering windows with five or more different types of motifs and windows with four or more types of motifs. Distribution of windows with six different motifs shows the highest enrichment in neuronal genes compared to the rest of the genome. (D) After filtering for conservation 6-motif windows still show the strongest bias towards neuronal genome. (E) Comparative GO term analysis of genes with 6-motif, >5-motif or >4-motif HSN regulatory signature. 6-motif signature distribution is associated with neuronal functions related to HSN while new GO terms identified by including >5-motif or >4-motif HSN windows are not related to neuronal functions.
Figure 7—figure supplement 3. Expression of identified HSN regulatory windows depends on unc-86.

Figure 7—figure supplement 3.

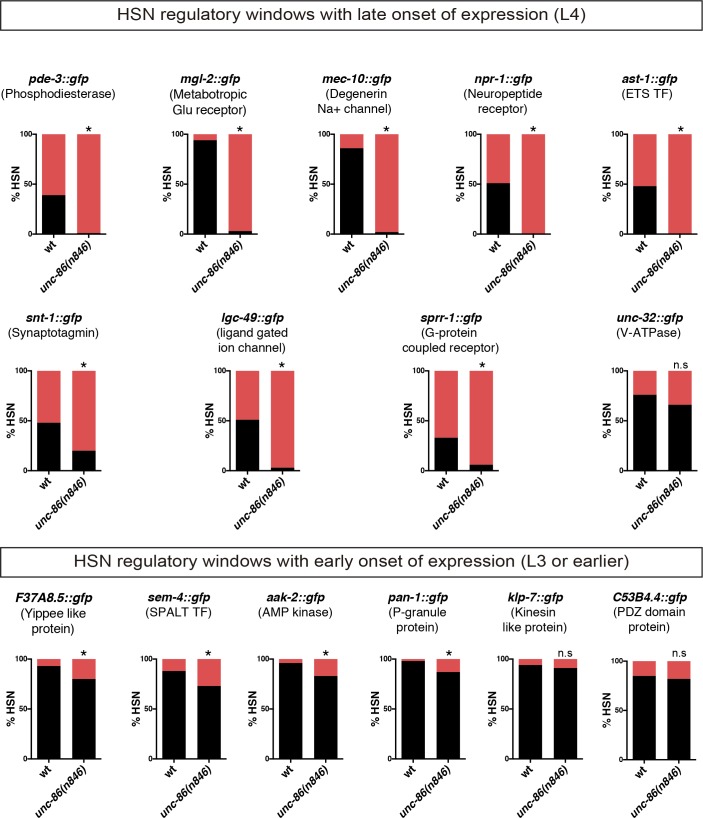
Expression of HSN regulatory window reporter constructs is affected in unc-86(n846) mutants. Reporter constructs with onset of expression at larval L4 are more dependent on unc-86 function than constructs already expressed at earlier stages. n > 100 cells per condition. Fisher's exact test, *: p-value<0.05.