Abstract
In reconstructive surgery, impeded blood flow in microvascular free flaps due to a compromise in arterial or venous patency secondary to blood clots or vessel spasms can rapidly result in flap failures. Thus, the ability to detect changes in microvascular free flaps is critical. In this paper, we report progress on in vivo pre-clinical testing of a compact, multimodal, fiber-based diffuse correlation and reflectance spectroscopy system designed to quantitatively monitor tissue perfusion in a porcine model’s surgically-grafted free flap. We also describe the device’s sensitivity to incremental blood flow changes and discuss the prospects for continuous perfusion monitoring in future clinical translational studies.
Keywords: Diffuse Correlation Spectroscopy, Diffuse Reflectance Spectroscopy, vascular occlusion, in vivo perfusion monitoring
1. INTRODUCTION
Microvascular free flaps harvested with a patient’s vascular supply (i.e., artery and vein) allow for the reconstruction of complex patient defects secondary to complications from trauma or ablative surgery. Flap placement at the reconstruction site (i.e., recipient site) requires the anastomosis of vessels from the donor with vessels at the recipient site in order to allow for continued blood flow to the transferred tissue. Impeded blood flow to the flaps secondary to arterial or venous occlusion can rapidly result in flap failures. Thus, the ability to detect changes in blood perfusion in free flaps is critical. A clinically-compatible device capable of detecting full and partial occlusion in tissue flaps could serve to alert surgeons when a flap requires intervention in order to restore vascular perfusion.
In this paper, we report progress on the pre-clinical testing of a compact, multimodal, optical fiber-coupled diffuse correlation (DCS) and reflectance spectroscopy (DRS) system designed to quantitatively monitor tissue perfusion in surgically-grafted porcine model free flaps (n = 6). DCS is a coherence based technique that measures intensity fluctuations induced by light reflecting off of moving particles REF[1,2]. DRS is a well established technique for analyzing reflectance spectra to obtain quantitative information about the reflecting medium’s biochemical composition. REF[1]. DRS has been widely employed in many clinical applications REF[3–5].
We describe the in vivo protocol, including optical measurements at 2 different tissue sites (artery and skin in the porcine flaps) as the flap’s blood supply was slowly altered. The technology (including hardware and software), data acquisition, and analysis are discussed. We also quantify device sensitivity to incremental changes in blood flow, and discuss the prospects for continuous perfusion monitoring in future clinical translational studies.
2. METHODS
2.1 Instrumentation
We have developed a multimodal device capable of taking measurements on in vivo tissues using DRS and DCS in rapid succession. A DCS instrument was constructed consisting of two near-infrared (785 nm) diode lasers, two cooled avalanche photodiodes for single photon detection, and a custom-made correlation and laser control board. The instrument automates DRS spectral collection using a white LED as a broadband source and a miniaturized spectrometer (Avantes) to acquire a reflectance spectrum (450 ~ 650 nm). All raw photon counts, time stamps, as well as correlation curves and DRS spectra, are collected and saved by the device to a laptop running a custom GUI written in C#. Further details on instrument construction can be found in [REF 6–9]. Two such instruments were used in this study to monitor four DCS channels at three patch placements on and around the flap simultaneously.
There are 2 optical probe designs. The first set of designs (Figure 1 (A) and (B)), is intended for monitoring the pedicle, artery, and/or vein supplying the flap. The depth of interrogation, and therefore the source- detector fiber spacing, must be small compared to the depths used on the skin or flap itself. This is a direct result of the lower concentration of absorbing and scattering blood cells in tissue versus blood vessels. In this case, we restrict the source-detector fiber spacing to ~1mm. The fibers are immobilized in Hysol epoxy in both designs, which were found to produce equivalent results.
Figure 1.
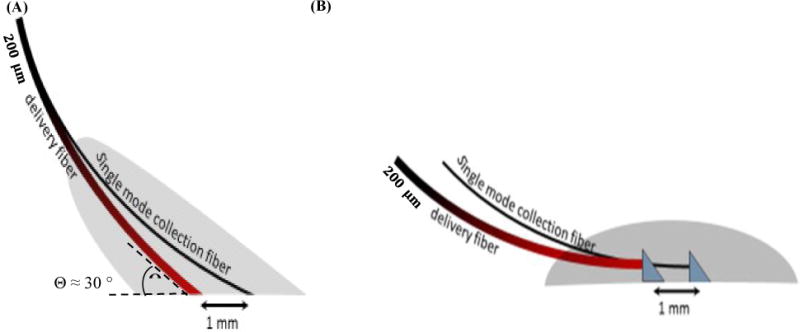
(A) Implantable probe design using angle-polished fibers – final entry angle is ~ 60° from normal. Aramid sutures are potted within the grey epoxy block. (B) Implantable probe design using silvered RA prisms potted in epoxy – also potted within the epoxy is a collar of polytetrafluoroethylene for securing to tissue or vein/artery. Signal levels from each device were similar, as were ad-hoc DCS evaluations on the human thumb.
For skin and patch monitoring, a larger silicone encapsulated patch was designed and fabricated (Figure 2). A 200 μm multimode optical fiber was used to introduce light into the tissue. Single mode fibers (5 μm) were spaced 1, 2, 5, and 10 mm from the source to collect scattered light at respective depths. A second delivery fiber was paired with a 105 μm multimode collection fiber at a distance of 1 mm for DRS measurements. For external probes, fibers were potted in a thin layer of hard epoxy (Loctite 9460), situated in a flexible silicone patch (Sylgard 186), and attached using adjustable Velcro straps or sutures. The design of the probes allows for varying geometries when investigating different areas of the body. We have also started developing implantable probes using bioresorbable materials.
Figure 2.
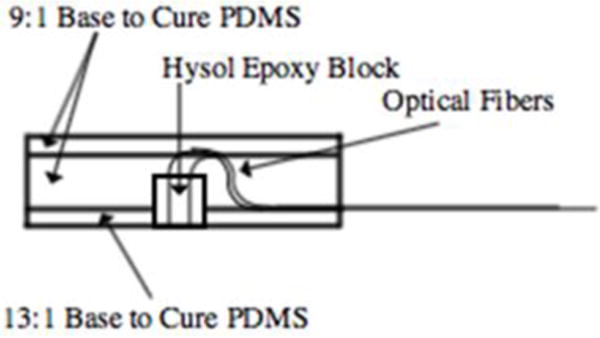
Surface probe design utilizing bare fibers encased in epoxy at fixed spacings. The epoxy chuck is then encased in medical-grade silicone, to which sutures are attached.
2.2 Animal studies
This project was approved by the University of Michigan Institutional Animal Care and Use Committee. We performed surgeries to isolate a section of porcine tissue from the animal to create an axial based latissimus dorsi composite tissue flap containing a major artery and vein. The resulting free flap consisted of a muscular site and a skin site connected to the main circulatory system through a single artery and vein. DCS measurements were taken from artery, muscle, and skin sites using fiber optic probes. DRS measurements were simultaneously taken from an adjacent skin site.
To demonstrate the device’s sensitivity to incremental changes in blood flow, we performed a series of occlusion studies (n=6). During the occlusion studies, a Hoffman clamp was positioned over the artery, tightened incrementally to simulate vascular occlusion, and then loosened incrementally. The entire occlusion procedure lasted for 30 minutes. The experimental setup is depicted in Figures 3 and 4 below.
Figure 3.
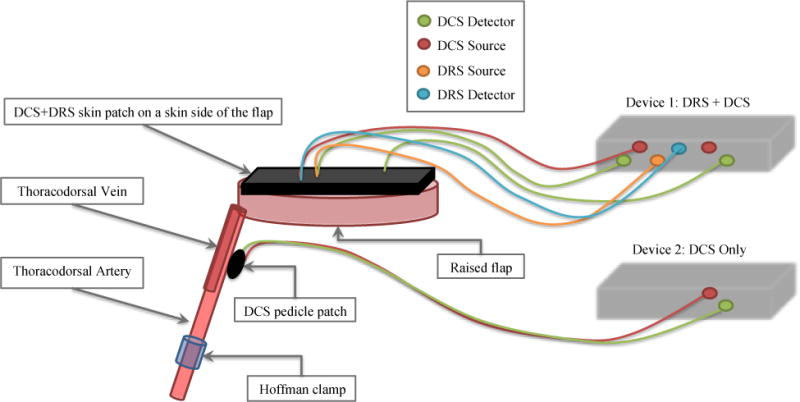
DRS/DCS device setup on porcine free flap – DRS and DCS measurements were taken in rapid succession via skin patches placed atop the free flap. DCS measurements were also taken on artery and muscle sites via pedicle patches. A more detailed description of the devices and patches can be found in section 2.1.
Figure 4.
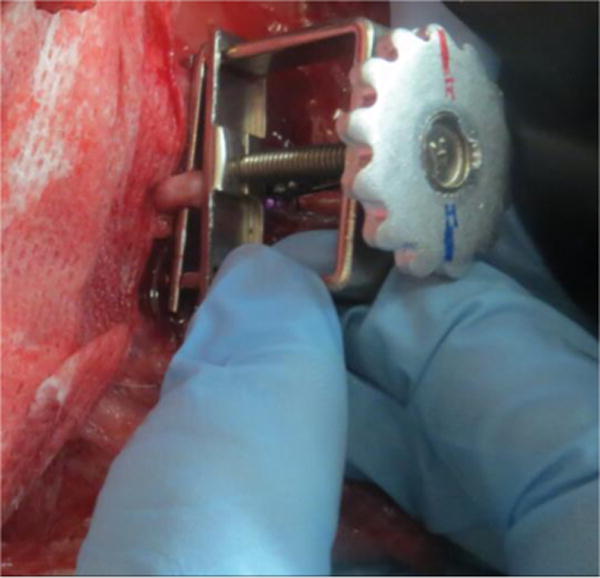
Positioning Hoffman clamp on thoracodorsal artery – the free flap consisting of a skin site and muscle site remained connected to the animal’s circulatory system through a single artery and vein. The Hoffman clamp slowly varied the rate of blood flow into the free flap during occlusion studies.
2.3 Data analysis: DCS
We developed an algorithm to convert photon intensity into a meaningful value that describes a change in blood flow. Photons are scattered and absorbed by moving objects as they diffuse through a medium. The rate at which these photons reach the sensor forms the basis for the raw data. A fast Fourier Transform is used to convert the raw pulse chain into a temporal intensity autocorrelation function. This process generates the autocorrelation function (g2) from the intensity trace by equation 2.31.
| (2.31) |
An autocorrelation function is then generated for each scan in the experiment. The scan is then normalized according to its β value defined by the Seigert equation (2.32). β is analogous to a quality factor: it depends on the coherence, overall geometry and alignment of the laser beam in the light scattering setup.
| (2.32) |
A feature scaling technique was used to normalize the Beta values for each scan by fitting a sigmoidal curve to the calculated g2 function. Specifically, Min-Max scaling was used to fix the bounds of the autocorrelation function from 0 to 1. A nonlinear least-squares solver was used to find the parameters of the sigmoid given by equation 2.33. These parameters were used to calculate the maximum and minimum values needed for normalization. These maximum and minimum values were then used to scale the calculated autocorrelation curves by equation 2.34, with the normalized autocorrelation curve denoted by .
| (2.33) |
| (2.34) |
A tau-half value was then calculated for each scan from the scaled autocorrelation function. The tau-half value is the tau value that corresponds to one half the maximum of g2. This algorithm allows for quantitative comparisons of flow conditions across the experiment. A more in depth description of the theory behind the DCS analysis can be found in [Ref 10–14].
2.4 Data analysis: DRS
A DRS measurement was taken on the skin site after every DCS measurement. System software allowed for this process to occur in a rapid and automated fashion. To estimate total hemoglobin concentration and tissue oxygen saturation, we employed a Monte Carlo lookup table (MCLUT)-based inverse method to fit the measured reflectance spectra7,15. Technical details on algorithm implementation are described in [Ref 5 and 16] and phantom verification of the method is found in [Ref 17].
3. RESULTS
3.1 DCS results
The DCS measurements for occlusion studies carried out on two separate animals are displayed in Figure 5. The autocorrelation curves suggest that as practiced on these subjects, the device can detect whether the artery is fully occluded but does not respond as strongly to intermediate clamp positions. There also appears to be some inconsistency in site sensitivity. For example, measurements taken at the artery site of Pig 3 (Figure 5 (A)) show that the autocorrelation curve shifted to the right as the Hoffman clamp was tightened over the artery. Average tau-half values were also observed to increase as the clamp was tightened for this dataset (Figure 5 (C)). However, no such results were observed for the artery site of Pig 4 (Figure 5 (B) and 5 (D)) despite an identical occlusion protocol. Looking at the skin data, the inconsistency is inverted: Pig 4 skin data exhibits trends consistent with our experimental protocol (Figure 5 (F) and Figure 5 (H)), while Pig 3 skin data exhibits no response to arterial occlusion (Figure 5 (E) and Figure 5 (G)).
Figure 5.

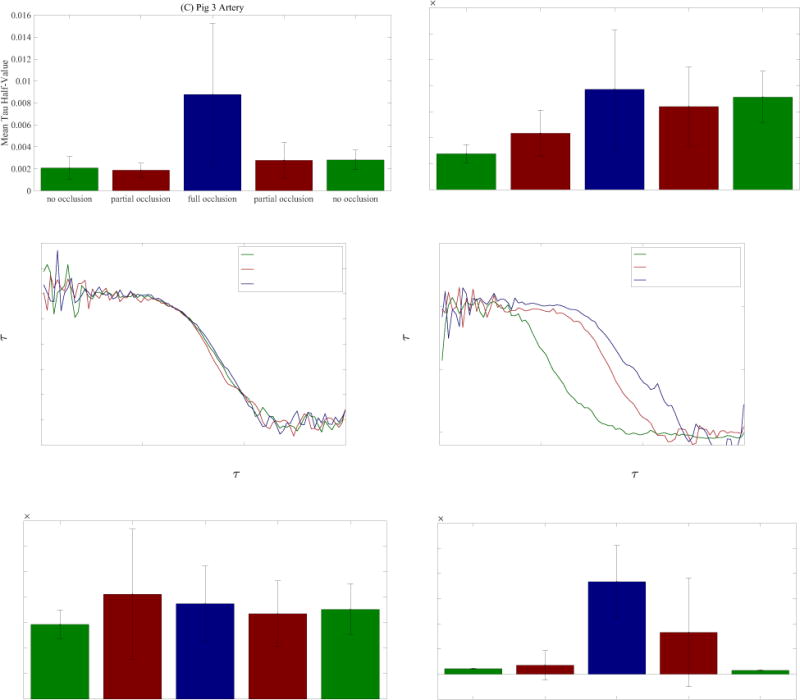
(A), (B), (E), (F) Autocorrelation curves obtained from occlusion studies on artery and skin sites from two animals – curves were renormalized using a feature scaling technique described in section 2.3. (C), (D), (G), (H) Mean tau-half values computed from autocorrelation curves of artery and skin sites for occlusion studies on two animals – the error bars represent the standard deviation from the mean.
There are a number of possible explanations for these observations. Because the blood flow rate was altered directly at the artery, we expected arterial site measurements to exhibit the largest response. However, our surgical team found it difficult to secure the pedicle patch to the artery. It is possible that the inconsistencies between arterial sites were caused by inconsistent contact between the optical fibers and the tissue. Likewise, for the skin sites, the presence of dried blood or hair could result in poor contact between fibers and tissue. An additional source of experimental error may be the occlusion protocol itself. As the Hoffman clamp was tightened, the clamped section of the artery was deformed. While we are confident that the No Occlusion and Full Occlusion statuses represent unhindered flow and no flow respectively, it is likely that for a certain clamping window within the Partial Occlusion status the deformation of the cross-area of the artery did not significantly impact the flow rate.
3.2 DRS Results
The DRS measurements on skin for two occlusion studies carried out on separate animals are displayed in Figure 6. Figure 6 (A) and Figure 6(C) feature corrected reflectance spectra representative of each of the three occlusion statuses. Comparing the reflectance spectra of Pig 3 and Pig 4, with their corresponding autocorrelation curves (Figure 5 (E) and 5 (F)), it appears that the DRS results follow the same trend as the DCS skin results – for Pig 3 the DRS results do not display a clear response to the occlusion procedure, but they do for Pig 4.
Figure 6.
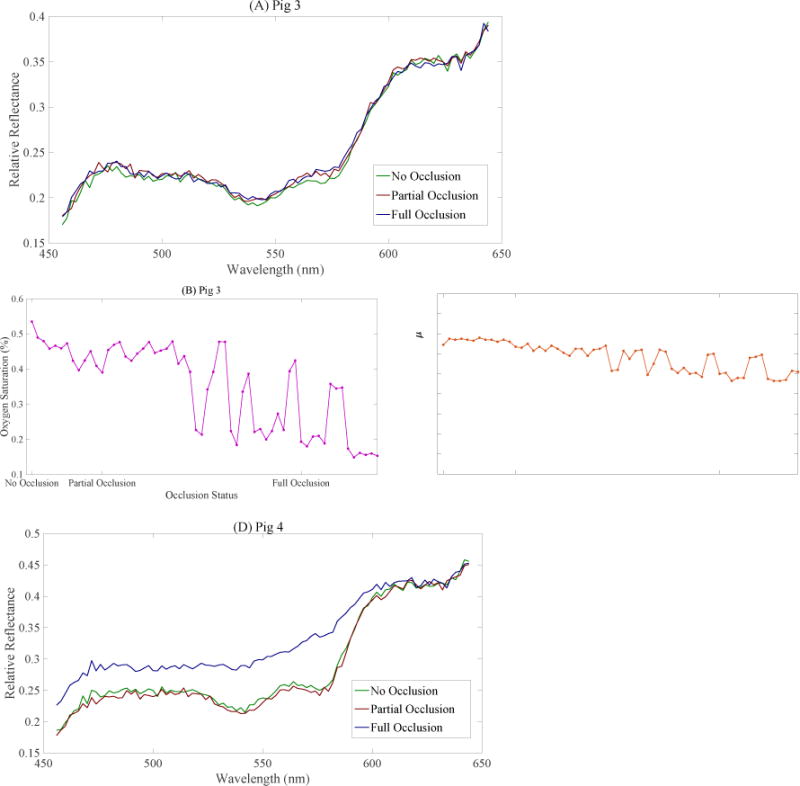

(A) Pig 3 DRS spectra representative of three different occlusion statuses. (B) Estimated oxygen saturation during first half of occlusion study on Pig 3 (C) Total Hb concentration estimated during first half of occlusion study on Pig 3. (D) Pig 4 DRS spectra representative of three different occlusion statuses. (E) Estimated oxygen saturation during first half of occlusion study on Pig 4 (F) Total Hb concentration estimated during first half of occlusion study on Pig 4.
Figure 6 (B), (C), (E), and (F) show the tissue oxygen saturation (StO2) and total hemoglobin concentration [THb] estimated by the inverse MCLUT algorithm applied on the corrected reflectance over the first half of the occlusion procedure – starting at no occlusion and ending at fully occluded. For Pig 3, the estimated StO2 displays oscillations that suggest poor fitting by the MCLUT algorithm (Figure 6 (B)). The estimated [THb] for Pig 3 decreases slightly from 19 μM to 16 μM over the first half of the procedure (Figure 6 (C)). For Pig 4, both StO2 and [THb] (Figure 6 (E) and (F)) decrease rapidly near the fully occluded point. Excluding Figure 6 (B), the results from the StO2 and [THb] estimates support the trends observed in the DCS data.
4. CONCLUSION
Initial results suggest that the device is capable of measuring significant blood flow changes in artery and skin sites. However, we observed inconsistencies in the device’s response to our occlusion protocol. We postulate that this may have resulted from difficulties in optimizing patch-tissue contact, or from physiological differences between the two animals. Further studies involving multiple patch designs, as well as pre-occlusion patch alignment verification protocols, should be pursued to eliminate artifacts from patch movement. Verification against a clinical standard such as a Doppler probe may also confer flow calibration.
Acknowledgments
This work was supported by the National Institute of Health (R44-DE021935).
References
- 1.Wilson RH, Vishwanath K, Mycek MA. Optical methods for quantitative and label-free sensing in living human tissues: principles, techniques, and applications. Advances in Physics: X. 2016;1(4):523–543. doi: 10.1080/23746149.2016.1221739. [DOI] [PMC free article] [PubMed] [Google Scholar]
- 2.Boas DA, Yodh AG. Spatially varying dynamical properties of turbid media probed with diffusing temporal light correlation. J Opt Soc Am A. 1997;14(1):192–215. [Google Scholar]
- 3.Brown JQ, Vishwanath K, Palmer GM, Ramanujam N. Advances in quantitative UV-visible spectroscopy for clinical and pre-clinical application in cancer. Current Opinion in Biotechnology. 2009;20(1):119–131. doi: 10.1016/j.copbio.2009.02.004. [DOI] [PMC free article] [PubMed] [Google Scholar]
- 4.Zonios G, Perelman LT, Backman V, Manoharan R, Fitzmaurice M, Dam JV, Feld MS. Diffuse reflectance spectroscopy of human adenomatous colon polyps in vivo. Applied Optics. 1999;38(31):6628–6637. doi: 10.1364/ao.38.006628. [DOI] [PubMed] [Google Scholar]
- 5.Lee SY, Lloyd WR, Chandra M, Wilson RH, McKenna B, Simeone D, Scheiman J, Mycek MA. Characterizing human pancreatic cancer precursor using quantitative tissue optical spectroscopy. Biomedical Optics Express. 2013;4(12):2828–2834. doi: 10.1364/BOE.4.002828. [DOI] [PMC free article] [PubMed] [Google Scholar]
- 6.Kolodziejski NJ, Stapels CJ, McAdams DR, Fernandez DE, Podolsky MJ, Farkas D, Ward BB, Vartarian M, Feinberg SE, Lee SY, Parikh U, Mycek MA, Christian JF. A compact instrument to measure perfusion of vasculature in transplanted maxillofacial free flaps. Proc SPIE. 2016;9715:97150L. doi: 10.1117/12.2212872. [DOI] [PMC free article] [PubMed] [Google Scholar]
- 7.Stapels CJ, Kolodziejski NJ, McAdams DR, Podolsky MJ, Fernandez DE, Farkas D, Christian JF. A scalable correlator for multichannel diffuse correlation spectroscopy. Proc SPIE. 2016;9698:969816. doi: 10.1117/12.2213114. [DOI] [PMC free article] [PubMed] [Google Scholar]
- 8.McAdams DR, Kolodziejski NJ, Stapels CJ, Fernandez DE, Podolsky MJ, Farkas D, Christian JF, Joyner MJ, Johnson CP, Paradis NA. Instrument to detect syncope and the onset of shock. Proc SPIE. 2016;9707:970706. doi: 10.1117/12.2212803. [DOI] [PMC free article] [PubMed] [Google Scholar]
- 9.Farkas DL, Kolodziejski NJ, Stapels CJ, McAdams DR, Fernandez DE, Podolsky MJ, Christian JF, Ward BB, Vartarian M, Feinberg SE, Lee SY, Parikh U, Mycek MA, Joyner MJ, Johnson CP, Paradis NA. A disposable flexible skin patch for clinical optical perfusion monitoring at multiple depths. Proc SPIE. 2016;9715:97151H. doi: 10.1117/12.2230988. [DOI] [PMC free article] [PubMed] [Google Scholar]
- 10.Boas DA, Pitris C, Ramanujam N, Yu G, Durduran T, Zhou C, Cheng R, Yodh AG. Handbook of Biomedical Optics. CRC Press; Boca Raton, FL: 2011. Near-Infrared Diffuse Correlation Spectroscopy for Assessment of Tissue Blood Flow; pp. 185–216. [Google Scholar]
- 11.Boas DA, Campbell LE, Yodh AG. Scattering and imaging with diffusing temporal field correlations. Phys Rev Lett. 1995;75(9):1855–1858. doi: 10.1103/PhysRevLett.75.1855. [DOI] [PubMed] [Google Scholar]
- 12.Buckley EM, Parthasarathy AB, Grant PE, Yodh AG, Franceschini MA. Diffuse correlation spectroscopy for measurement of cerebral blood flow: future prospects. Neurophoton. 2014;1(1):011009. doi: 10.1117/1.NPh.1.1.011009. [DOI] [PMC free article] [PubMed] [Google Scholar]
- 13.Durduran T, Yodh AG. Diffuse correlation spectroscopy for non-invasive, micro-vascular cerebral blood flow measurement. NeuroImage. 2014;85(1):51–63. doi: 10.1016/j.neuroimage.2013.06.017. [DOI] [PMC free article] [PubMed] [Google Scholar]
- 14.Verdecchia K, Diop M, St Lawrence K. Investigation of the best model to characterize diffuse correlation spectroscopy measurements acquired directly on the brain. Medical Biophysics Publications; 2015. Paper 63. [DOI] [PMC free article] [PubMed] [Google Scholar]
- 15.Hennessy R, Lim SL, Markey MK, Tunnel JW. Monte Carlo lookup table-based inverse model for extracting optical properties from tissue-simulating phantoms using diffuse reflectance spectroscopy. J Biomed Opt. 2013;18(3):037003. doi: 10.1117/1.JBO.18.3.037003. [DOI] [PMC free article] [PubMed] [Google Scholar]
- 16.Bender JE, Vishwanath K, Moore LK, Brown JQ, Chang V, Palmer GM, Ramanujam N. A Robust Monte Carlo Model for the Extraction of Biological Absorption and Scattering In Vivo. IEEE Transactions on Biomedical Engineering. 2009;56(4):960–968. doi: 10.1109/TBME.2008.2005994. [DOI] [PMC free article] [PubMed] [Google Scholar]
- 17.Pakela JM, Hedrick TL, Lee SY, Vishwanath K, Zanfardino S, Chung YG, Helton MC, Kolodziejski NJ, Stapels CJ, McAdams DR, Fernandez DE, Christian JF, Feinberg SE, Mycek MA. Design verification of a compact system for detecting tissue perfusion using bimodal diffuse optical technologies. SPIE; 2017. pp. 10072–42. [DOI] [PMC free article] [PubMed] [Google Scholar]


