Abstract
Background
Recent studies show that peroxiredoxin 1 (Prdx1) contributes to the progression and poor prognosis of carcinoma through multiple mechanisms. However, there is little information on its expression and prognostic value in gastric cancer. This study investigated the expression of Prdx1 in gastric cancer, along with evaluating its clinical-pathological and prognostic importance.
Material/Methods
A total of 189 pairs of gastric cancer and paracarcinomatous tissues were assessed for Prdx1 expression and its association with clinical characteristics. The molecular mechanism was further investigated through in vitro experimentation.
Results
The mRNA and protein levels of Prdx1 in the GC tissues were higher than in the peri-tumor tissues. We also found that high Prdx1 expression was positively correlated with the lymph node invasion and poor prognosis. It also served as an autonomous prognostic factor for patients with gastric cancer. Moreover, Prdx1 regulates the invasion and metastasis of GC cell lines through inhibiting E-Ca expression.
Conclusions
Prdx1 can promote epithelial-mesenchymal transition and gastric cancer progression. Therefore, it might be a therapeutic target and prognostic indicator for gastric cancer patients.
MeSH Keywords: Cadherins, Peroxiredoxins, Prognosis, Stomach Neoplasms
Background
Gastric cancer (GC) is considered the 4th most prevalent malignancy and the 2nd foremost trigger of cancer deaths globally [1]. Accordingly, surgical treatment is the only curative therapeutic option for GC [2,3]. Even though some advances have been made in its retreatment in the recent past, most patients with GC eventually die from recurrence [3]. As such, finding an effective biomarker that can predict the behavior of the tumor is urgently needed in clinical practice.
Peroxiredoxin 1 (Prdx1) is an affiliate of the thiol-dependent peroxiredoxin family of antioxidant enzymes, which regulates the levels of cytokine-induced peroxide. It also facilitates transduction of signal in mammalian cells [4]. Prdx1 activity has previously been reported to be involved in several biological processes, such as differentiation of cells, apoptosis, and proliferation [5]. Many studies have also proposed that Prdx1 can be decontrolled in different cancer types like prostate cancer [6], bladder cancer [7], lung cancer [8], and liver cancer [9].
In the present study, Prdx1 expression was detected and its associations with clinicopathological factors as well as prognosis in GC tissues were examined. Prdx1 was found to be overexpressed in GC tissues at mRNA and protein levels. It was also found to be correlated with a high degree of differentiation and advanced TNM stage. Importantly, Prdx1 overexpression predicted an inferior overall and disease-free survival, and could therefore be a latent self-regulating GC prognostic biomarker. Our study results also suggest that Prdx1 may improve the progression of GC through the mechanism of epithelial-mesenchymal transition (EMT).
Material and Methods
Clinical and tissue samples
Specimens of GC were selected from 189 cases, which were gathered together with the paracarcinomatous tissues, from patients diagnosed at the Anhui Provincial Cancer Hospital (Hefei, China) during the period of 2008 to 2012. From this, comprehensive pathological and clinical data (e.g., age, sex, tumor size, Borrmann type, level of differentiation, histological type, invasion depth, lymph node metastasis, and TNM stage) were acquired from medical records of the patients. The samples were from 134 male and 55 female patients with an average age of 68 years (range: 24–83 years). Tumor stage was then determined as per the 7th edition of the tumor-node-metastasis (TNM) classification of the International Union Against Cancer. None of the patients had undergone radiotherapy or chemotherapy prior to the surgery. Specimens were fixed in formalin, then embedded in paraffin awaiting pathological analysis and diagnosis confirmation. Comprehensive clinical sequel data were obtained from the Anhui Provincial Cancer Hospital GC database. The study was approved by the Human Research Ethics Committee of Anhui Provincial Cancer Hospital, and an informed consent was acquired from every patient.
Immunohistochemistry and scoring
Immunohistochemistry for Prdx1 and E-cadherin (E-Ca) was carried out on every tumor specimen. The tumor samples were cut into sections (4-μm thick) and placed onto silanized glass slides. Then, two-step immunohistochemical was used to detect expression of proteins. In brief, deparaffinized and hydrated sections were preserved with 0.3% hydrogen peroxide in methanol for 15 min at room temperature to obstruct activities of endogenous peroxidase. Then, they were washed in phosphate-buffered saline (PBS; 3×3 min). Antigen retrieval was performed in citrate buffer (pH 6.0). Following washing in PBS (3×3 min), the sections were stained with an Prdx1 monoclonal antibody (Abcam, Cambridge, MA, United States) and E-Ca monoclonal antibody (Beijing Zhongshan Biotechnology, Beijing, China) for about 2 h at 37°C. Then, they were washed in PBS (3 ×3 min). The sections were incubated using the Universal IgG antibody-HRP polymer for about 15 min at 37°C. Subsequently, they were washed 3 times (PBS; 3×3 min). Ultimately, every section was treated using 50 μl diaminobenzidine (DAB) working solution at room temperature for about 3–10 min before washing in PBS. All the sections were counterstained by hematoxylin.
Each of the sections were scored according to the portion of stained tumor cells and the intensity of staining. The proportion of stained tumor cells was categorized as 0 (≤1%), 1 (2% to 25%), 2 (26% to 50%), 2 (51% to 75%), and 4 (≥76%). The intensity of staining was scored as 0 (no staining), 1 (weak), 2 (moderate), and 3 (strong). The outcome of expression was established by use of the following formula: percentage score × intensity score. A general score of 0–12 was considered as low (score: 0–3) or high (score: 4–12). All the stained portions were assessed by 2 pathologists blinded to the data.
Western blotting analysis
Cells were washed in PBS and lysed in RIPA lysis buffer (20 mM HEPES, pH 7.5, 150 mM NaCl, 10% glycerol, 50 mM EDTA, 1% Triton X-100) at 4°C for 30 min. Then, whole-cell extracts were collected and centrifuged at 12 000 rpm for 15 min at 4°C. Afterwards, the supernatants were removed with a pipette and protein concentration was detected using the Bradford method. Equal amounts of lysate protein were resolved by SDS-PAGE and transferred to a nitrocellulose membrane. After that, the membrane was blocked with 5% BSA and incubated in primary antibodies against E-cadherin, Vimentin, Snail, Prx1, and GAPDH overnight at 4°C. On the next day, the membrane was incubated in a horseradish peroxidase-conjugated secondary antibody and immunoreactive proteins were visualized by an ECL system.
Quantitative real-time PCR
Total RNA was isolated from carcinoma and para-carcinoma tissue treated by TRIzol and DNase I. Total RNA was reverse-transcribed to cDNA by a high-capacity cDNA reverse transcription kit according to the manufacturer’s instructions. Snail and Slug mRNA levels were examined by real-time PCR using a SYBR Green quantitative PCR kit (Bio-Rad) and a C1000™ thermal cycler. PCR primer sequences were as follow: human Prdx1, forward 5′-CCACGGAGATCATTGCTTTCA-3′ and reverse 5′-AGGTGTATTGACCCATGCTAGAT-3′. Each sample was tested in triplicate and expression of each target was normalized to that of the human GAPDH gene.
Cell culture and treatment
The human Prx1 gene sequence was ascertained in a human placental cDNA library. The human gastric cancer cell line was cultured in DMEM medium supplemented with 10% fetal bovine serum (FBS), penicillin (100 units/mL), and streptomycin (100 lg/mL). The cells were incubated at 37°C and in a humidified environment of 5% CO2. We used 20 nM siRNA or pC3.1-myc-hPrx1 plasmid in the transfection with Lipofectamine 2000 according with the manufacturer’s protocol. Prx1 siRNA (si-Prx1) oligos were as follow: sense 5′-GCCGAAUUGUGGUGUCUUAUU-3′ and antisense 5′-UAAGACACCACAAUUCGGCUU-3′. Cell morphology was observed using an inverted phase-contrast microscope.
Transwell invasion and metastasis experiments
Cells were cultured in 6-well plates at 37°C with 5% CO2 in 1640 medium with 1% penicillin and streptomycin and 10% FBS until the cells had grown to confluence. Then, the monolayer of cells was wounded with pipette tips, washed with PBS to wipe off the deciduous cells, and incubated for 24 h. The degree of cell migration was determined by the images of the wounded area taken by microscopy (Leica DMi8, Solms, Germany).
Transwell inserts (Corning Costar, Cambridge, MA, USA) were coated with Matrigel Basement Membrane Matrix and incubated for 30 min at 37°C. We pipetted 2×10⁵ cells suspended in serum-free 1640 medium into the upper chamber and 500 μl 1640 medium with 10% FBS was added in the bottom chambers. After 24-h incubation, the Transwell plates were fixed by paraformaldehyde for 5 min and stained with crystal violet for 1 min. After that, the cells in the upper chamber were eliminated using a cotton swab and invasive cells were photographed using a digital camera (OLYMPUS BX43, Tokyo, Japan).
Statistical analysis
All the statistical evaluations were carried out using the statistical package SPSS 17.0 (SPSS, Inc., Chicago, IL, USA). We used the chi-square test and Spearman correlation test in analyzing the results of immunohistochemistry. Then, the Kaplan-Meier technique and log-rank test were used in survival analysis. The Cox regression model was used in determining the value of independent prognostic factors. All P values were 2-sided and P<0.05 was regarded as statistically significant.
Results
Prdx1 and E-Ca expression in cancerous gastric tissues
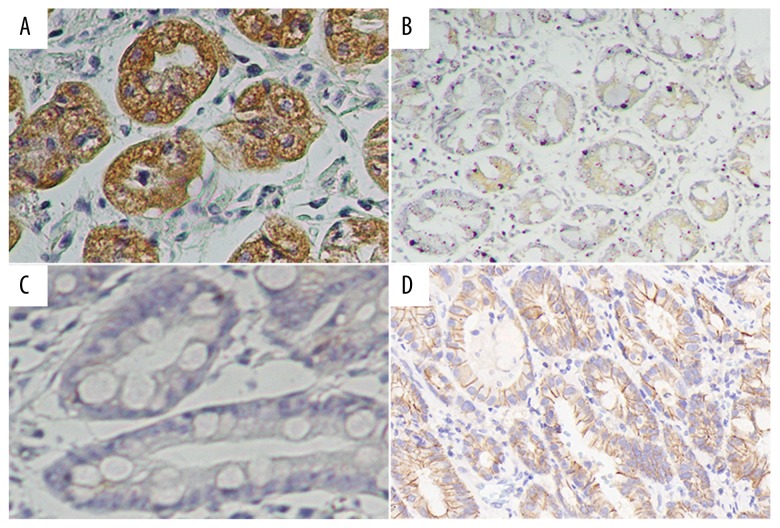
In further evaluating the expression level of Prdx1 and E-Ca in GC tissues, we detected the protein expression of Prdx1 and E-Ca in 189 GC tissue samples compared with matched adjacent non-cancerous gastric tissue samples. High and low expressions of Prdx1 and E-Ca in GC tissues are displayed in Figure 1, showing that Prdx1 staining was greatest in the tumor cells’ cytoplasm. Consistent with the above observation, the mRNA and protein levels of Prdx1 in the GC tissues were higher than in the corresponding peri-tumor tissues (Figures 2, 3). High expression of Prdx1 was found in most of the GC tissue samples (127/189) but was found in fewer of the non-cancerous gastric tissue samples (43/189). Accordingly, the Prdx1 expression in GC was substantially higher as compared with that of the non-cancerous tissue samples (P<0.001). There was also an observable significant correlation between the expression of Prdx1 and E-Ca, as shown in Table 1. High expression of Prdx1 was associated with low expression of E-Ca (r=−0.154, P=0.035) in GC tissues.
Figure 1.
Expression of Prdx1 and E-Ca protein in GC tissue. Immunohistochemistry staining revealed Prdx1 and E-Ca high expression (A, D) and low expression (B, C).
Figure 2.
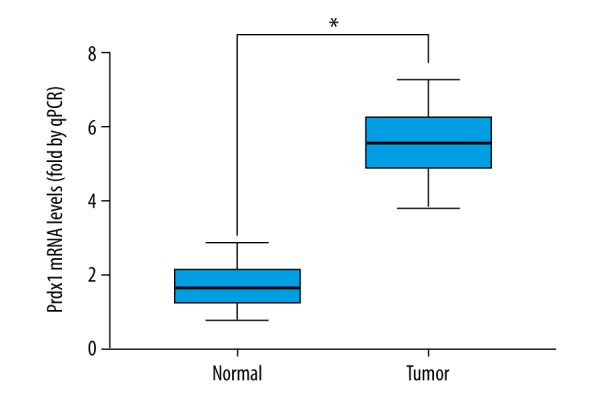
The levels of Prdx1 mRNA in 60 paired GC and corresponding adjacent normal tissues were measured by RT-PCR.
Figure 3.
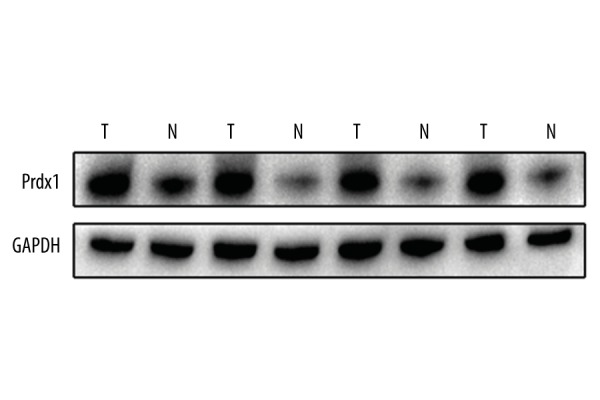
The levels of Prdx1 protein in 4 paired GC and corresponding adjacent normal tissues were measured by Western blotting.
Table 1.
Expression correlation of Prdx 1 with E-ca in gastric cancer tissues.
| Group | Prdx 1 expression | r | P-value | |
|---|---|---|---|---|
| High | Low | |||
| E-Ca expression | −0.154 | 0.035 | ||
| High | 49 | 34 | ||
| Low | 78 | 28 | ||
Association of Prdx1 and E-Ca expression with clinicopathological parameters
In examining the functions of Prdx1 and E-Ca in GC tissues, we assessed the relationship of their expressions and the clinicopathological parameters of the GC patients. The expression of Prdx1 was significantly linked to the level of differentiation (P=0.006), invasion depth (P=0.001), lymph node metastasis (P=0.029), and TNM stage (P<0.001), as illustrated in Table 2. In addition, E-Ca expression was higher in early-stage tumors (P=0.037). Statistical analysis showed that expression of E-Ca was correlated with the level of differentiation (P=0.033) and the depth of invasion (P<0.001). The detailed results are shown in Table 2.
Table 2.
Relationships between Prdx 1 and E-Ca protein expressions (immunohistochemical staining) in gastric cancer tissues and various clinicopathological variables.
| Variables | Total | Prdx 1 expression | E-Ca expression | ||||||
|---|---|---|---|---|---|---|---|---|---|
| Low (n=62) | High (n=127) | χ2 | P | Low (n=106) | High (n=83) | χ2 | P | ||
| Gender | |||||||||
| Male | 134 | 42 | 92 | 0.446 | 0.504 | 77 | 57 | 0.355 | 0.551 |
| Female | 55 | 20 | 35 | 29 | 26 | ||||
| Age at surgery (yeas) | |||||||||
| ≤60 | 90 | 34 | 56 | 1.928 | 0.165 | 48 | 42 | 0.528 | 0.467 |
| >60 | 99 | 28 | 71 | 58 | 41 | ||||
| Size of primary tumor (cm) | |||||||||
| ≤5 | 95 | 31 | 64 | 0.003 | 0.959 | 51 | 44 | 0.447 | 0.504 |
| >5 | 94 | 31 | 63 | 55 | 39 | ||||
| Borrmann type | |||||||||
| I+II type | 63 | 21 | 42 | 0.012 | 0.913 | 32 | 31 | 1.074 | 0.300 |
| III+IV type | 126 | 41 | 85 | 74 | 52 | ||||
| Degree of differentiation | |||||||||
| Well/moderate | 86 | 37 | 49 | 7.476 | 0.006* | 41 | 45 | 4.532 | 0.033* |
| Poor and not | 103 | 25 | 78 | 65 | 38 | ||||
| Histological type | |||||||||
| Adenocarcinoma | 160 | 54 | 106 | 0.423 | 0.515 | 92 | 68 | 0.848 | 0.357 |
| Others | 29 | 8 | 21 | 14 | 15 | ||||
| Depth of invasion | |||||||||
| T1 | 8 | 5 | 3 | 15.592 | 0.001* | 1 | 7 | 18.040 | 0.000* |
| T2 | 22 | 14 | 8 | 6 | 16 | ||||
| T3 | 59 | 18 | 41 | 41 | 18 | ||||
| T4 | 100 | 25 | 75 | 58 | 42 | ||||
| Lymph node metastasis | |||||||||
| N0 | 43 | 19 | 24 | 9.060 | 0.029* | 22 | 21 | 0.753 | 0.861 |
| N1 | 47 | 20 | 27 | 26 | 21 | ||||
| N2 | 54 | 14 | 40 | 31 | 23 | ||||
| N3 | 45 | 9 | 36 | 27 | 18 | ||||
| TNM stage | |||||||||
| I | 13 | 9 | 4 | 19.911 | 0.000* | 3 | 10 | 8.502 | 0.037* |
| II | 63 | 29 | 34 | 34 | 29 | ||||
| III | 100 | 22 | 78 | 59 | 41 | ||||
| IV | 13 | 2 | 11 | 10 | 3 | ||||
Correlation of Prdx1 and E-Ca expression with prognosis
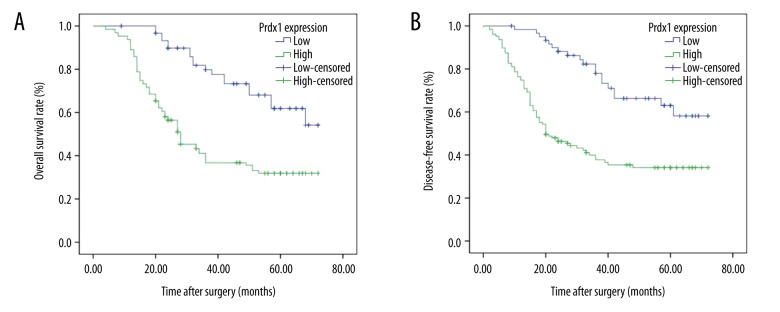
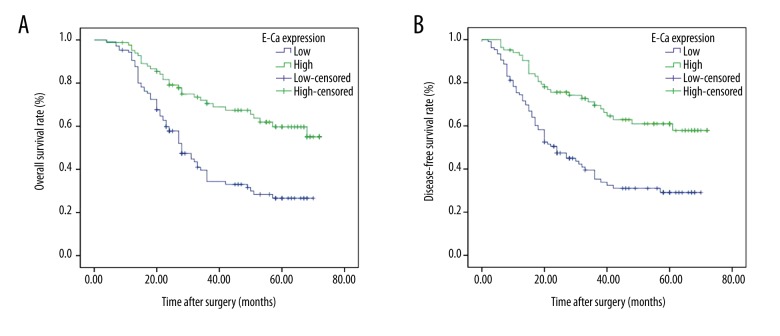
The association of Prdx1 expression with prognosis was further analyzed by use of Kaplan-Meier survival curve and log-rank test. The Kaplan-Meier curves were plotted in comparing the OS and the DFS according to the Prdx1 expression patterns. We found that patients who had high expression of Prdx1 had worse OS (38.207 months, P<0.001) and DFS (35.519 months, P<0.001) than in those who had low Prdx1 expression (58.502 months, P<0.001; 56.937 months, P<0.001), as shown in Tables 3, 4 and Figure 4. In contrast, the low expression of E-Ca was significantly associated with poor OS (P<0.001) and poor DFS (P<0.001) (Figure 5). In the multivariate analysis, depth of invasion (P=0.004 for OS, P=0.006 for DFS), lymph node metastasis (P=0.005 for OS, P=0.006 for DFS), Prdx1 expression (P=0.001 for OS, P=0.001 for DFS), and E-Ca expression (P=0.021 for OS, P=0.013 for DFS) were the independent factors (Tables 5, 6).
Table 3.
Univariate analysis of the correlation between clinicopathological parameters and overall survival time of patients with gastric cancer.
| Variable | Mean survival time (m) | 95% CI | Log-rank test | P |
|---|---|---|---|---|
| Gender | ||||
| Male | 45.176 | 40.777–49.575 | 0.185 | 0.667 |
| Female | 43.625 | 36.506–50.743 | ||
| Age at surgery(yeas) | ||||
| ≤60 | 46.517 | 41.149–51.886 | 0.728 | 0.394 |
| >60 | 43.265 | 38.076–48.455 | ||
| Size of primary tumor (cm) | ||||
| ≤5 | 43.930 | 38.878–48.983 | 0.269 | 0.604 |
| >5 | 45.856 | 40.346–51.367 | ||
| Borrmann type | ||||
| I+II type | 46.424 | 39.813–53.036 | 0.383 | 0.536 |
| III+IV type | 43.865 | 39.332–48.398 | ||
| Degree of differentiation | ||||
| Well/moderate | 50.851 | 45.619–56.084 | 9.127 | 0.003 |
| Poor and not | 39.423 | 34.335–44.511 | ||
| Histological type | ||||
| Adenocarcinoma | 43.538 | 39.499–47.577 | 2.325 | 0.127 |
| Others | 50.305 | 41.127–59.483 | ||
| Depth of invasion | ||||
| T1 | 71.000 | 69.303–72.697 | 26.470 | 0.000 |
| T2 | 62.943 | 54.835–71.051 | ||
| T3 | 44.625 | 37.253–51.997 | ||
| T4 | 42.050 | 36.672–47.428 | ||
| Lymph node metastasis | ||||
| N0 | 53.041 | 45.855–60.226 | 19.629 | 0.000 |
| N1 | 53.249 | 46.494–60.005 | ||
| N2 | 40.014 | 33.478–46.550 | ||
| N3 | 33.437 | 25.676–41.198 | ||
| TNM stage | ||||
| I | 71.200 | 69.798–72.602 | 58.227 | 0.000 |
| II | 49.310 | 43.488–55.132 | ||
| III | 41.753 | 36.547–46.959 | ||
| IV | 14.115 | 10.384–17.846 | ||
| Prdx 1 expression | ||||
| Low | 58.502 | 53.447–63.556 | 20.998 | 0.000 |
| High | 38.207 | 33.658–42.756 | ||
| E-Ca expression | ||||
| Low | 36.536 | 31.926–41.146 | 19.155 | 0.000 |
| High | 54.224 | 48.989–59.458 | ||
Table 4.
Multivariate analysis of the correlation between clinicopathological parameters and overall survival time of patients with gastric cancer.
| Covariates | HR | 95% CI for HR | P |
|---|---|---|---|
| Gender (Male vs. Female) | 0.913 | 0.579–1.439 | 0.694 |
| Age (≥60 vs. <60 cm) | 1.080 | 0.718–1.624 | 0.713 |
| Tumor size (≥5 vs. <5 cm) | 0.839 | 0.548–1.284 | 0.418 |
| Borrmann type (type I, II vs. III, IV) | 1.075 | 0.691–1.672 | 0.748 |
| Degree of differentiation | 0.728 | 0.475–1.114 | 0.144 |
| Histological type | 1.759 | 0.920–3.363 | 0.088 |
| Depth of invasion (T3, T4 vs. T1, T2) | 0.236 | 0.088–0.638 | 0.004 |
| Lymph node metastasis | 0.333 | 0.156–0.711 | 0.005 |
| TNM stage (stage I vs. II vs. III vs. IV) | 1.911 | 0.851–4.292 | 0.117 |
| Prdx 1 expression (low vs. high) | 0.411 | 0.242–0.700 | 0.001 |
| E-Ca expression (low vs. high) | 1.698 | 1.082–2.664 | 0.021 |
Figure 4.
Kaplan-Meier survival curves for OS and DFS according to the high and low expression of Prdx1 from 189 patients with GC. (A) Patients with high expression of Prdx1 showed a poor OS (P<0.001). (B) Patients with high expression of Prdx1 had a poor DFS (P<0.001).
Figure 5.
Kaplan-Meier survival curves for OS according to the high and low expression of E-Ca from 189 patients with GC. (A) Patients with high expression of E-Ca showed a favorable OS (P<0.001). (B) Patients with high expression of E-Ca had a favorable DFS (P<0.001).
Table 5.
Univariate analysis of the correlation between clinicopathological parameters and disease-free survival time of patients with gastric cancer.
| Variable | Mean survival time (m) | 95% CI | Log-rank test | P |
|---|---|---|---|---|
| Gender | ||||
| Male | 42.675 | 37.864–47.487 | 0.026 | 0.873 |
| Female | 41.668 | 34.077–49.260 | ||
| Age at surgery (yeas) | ||||
| ≤60 | 44.413 | 38.562–50.265 | 0.624 | 0.430 |
| >60 | 40.824 | 35.209–46.439 | ||
| Size of primary tumor (cm) | ||||
| ≤5 | 41.283 | 35.785–46.781 | 0.274 | 0.601 |
| >5 | 43.781 | 37.813–49.748 | ||
| Borrmann type | ||||
| I+II type | 44.407 | 37.282–51.531 | 0.469 | 0.493 |
| III+IV type | 41.486 | 36.547–46.424 | ||
| Degree of differentiation | ||||
| Well/moderate | 48.799 | 43.077–54.521 | 7.959 | 0.005 |
| Poor and not | 37.144 | 31.616–42.671 | ||
| Histological type | ||||
| Adenocarcinoma | 41.130 | 36.762–45.499 | 1.961 | 0.161 |
| Others | 47.854 | 37.543–58.165 | ||
| Depth of invasion | ||||
| T1 | 69.250 | 64.582–73.918 | 28.117 | 0.000 |
| T2 | 62.579 | 54.201–70.958 | ||
| T3 | 42.457 | 34.491–50.423 | ||
| T4 | 39.473 | 33.659–45.287 | ||
| Lymph node metastasis | ||||
| N0 | 50.574 | 42.663–58.485 | 18.060 | 0.000 |
| N1 | 51.080 | 43.649–58.510 | ||
| N2 | 37.015 | 29.857–44.173 | ||
| N3 | 31.325 | 22.864–39.787 | ||
| TNM stage | ||||
| I | 70.429 | 67.577–73.280 | 45.520 | 0.000 |
| II | 46.928 | 40.568–53.289 | ||
| III | 39.531 | 33.837–45.225 | ||
| IV | 10.846 | 6.640–15.052 | ||
| Prdx 1 expression | ||||
| Low | 56.937 | 51.396–62.477 | 21.481 | 0.000 |
| High | 35.519 | 30.553–40.484 | ||
| E-Ca expression | ||||
| Low | 33.797 | 28.696–38.898 | 18.717 | 0.000 |
| High | 52.490 | 46.853–58.127 | ||
Table 6.
Multivariate analysis of the correlation between clinicopathological parameters and disease-free survival time of patients with gastric cancer.
| Covariates | HR | 95% CI for HR | P |
|---|---|---|---|
| Gender (Male vs. Female) | 1.014 | 0. 645–1.595 | 0.952 |
| Age (≥60 vs. <60 cm) | 1.092 | 0. 726–1. 642 | 0.673 |
| Tumor size (≥5 vs. <5 cm) | 0.871 | 0. 571–1. 329 | 0.523 |
| Borrmann type (type I, II vs. III, IV) | 1.030 | 0. 664–1. 597 | 0.897 |
| Degree of differentiation | 0.761 | 0. 497–1.165 | 0.208 |
| Histological type | 1.483 | 0. 879–3.218 | 0.116 |
| Depth of invasion (T3, T4 vs. T1, T2) | 0.248 | 0.092–0.664 | 0.006 |
| Lymph node metastasis | 0.342 | 0.160–0.733 | 0.006 |
| TNM stage (stage I vs. II vs. III vs. IV) | 1.846 | 0.825–4.131 | 0.135 |
| Prdx 1 expression (low vs. high) | 0.405 | 0.239–0.687 | 0.001 |
| E-Ca expression (low vs. high) | 1.762 | 1.125–2.762 | 0.013 |
Prdx1 promotes GC cell invasion and metastasis through EMT mechanism
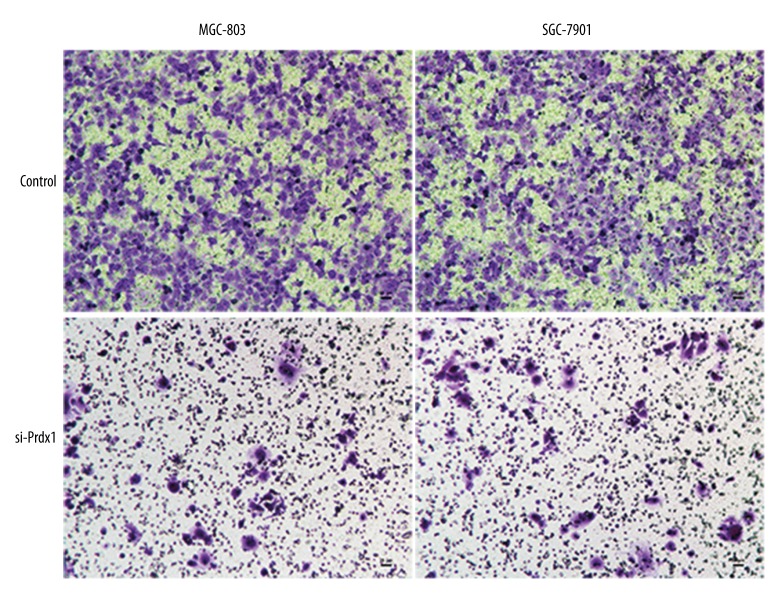
To further explore the role of Prdx1 in GC, the GC cell lines (SGC-7901 and MGC-803) were used. As shown in Figure 6, inhibition of Prdx1 significantly attenuated the invasion and metastasis ability of SGC-7901 and MGC-803 cell lines. Additionally, we also detected the EMT-related markers (E-Ca, Snail, and Vimentin) in the GC cells after inducing Prdx1 deficiency. The Western blotting results revealed that the protein levels of these EMT-related markers were significantly downregulated at 48 h after transfection with si-Prdx1 in the GC cells in comparison with the blank control cells (Figure 7).
Figure 6.
Transwell experiment revealed that the invasion and metastasis ability of GC cell lines was attenuated by inhibiting Prdx1 expression.
Figure 7.
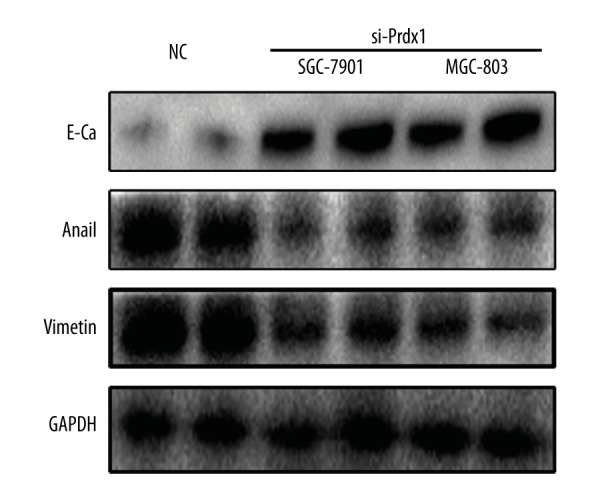
EMT-related markers expression in the GC cells transfected with si-Prdx1 or controls were measured by Western blotting.
Discussion
It is well known that gastric cancer is among the foremost causes of cancer-related deaths globally [1]. In assessing prognosis for GC patients, the TNM staging system and the Lauren classification system have been extensively used in clinical practice [10]. Nonetheless, these predictive models are not helpful indicators of prognosis in GC patients. As such, identifying molecules with tumorigenic properties has contributed to the understanding of tumor progression in gastric cancer.
Recent evidence from several publications show that Prdx1 expression patterns are associated with human cancers [11]. Prdx1 facilitates the tumor-suppressive role of PTEN through binding PTEN and shielding its lipid phosphatase activity from H2O2-induced inactivation [12]. Additionally, Prdx1 hypermethylation and abridged expressions have been noted in oligodendroglial tumors. Knockdown of Prdx1 substantially amplifies apoptosis and reduces viability of Hs683 glioma cells subjected to ionizing irradiation or temozolomide in vitro [13]. Prdx1 averts ROS-induced senescence in breast cancer by stimulating MKP-5 activity [14].
Many studies have shown that Prdx1 is overexpressed in ESCC cells compared to non-cancerous esophageal epithelial cells [15,16]. In the same way, elevated Prdx1 tends to facilitate tumorigenesis by controlling mTORp70S6K pathway activity in ESCC [16]. Also, Prdx1 is upregulated in NSCLC tissue interstitial fluid, and a high degree of Prdx1 expression may be associated with lymph node metastasis and tumor differentiation, which suggests that Prdx1 is a neoplastic progression marker [17]. Elevated Prdx1 advances prostate tumor vasculature and exhibits upregulation of antigenic proteins, including VEGF, in the tumor region. On the other hand, suppressing of Prdx1 in prostate cancer cell lines tends to reduce formation of tumor vascular, and brings about VEGF downregulation [18,19]. Our study is the first to demonstrate a link between high Prdx1 expression and poor prognosis in GC patients after surgery. Our work demonstrates that Prdx1 plays a role in advancement of GC. Nonetheless, further studies are needed to advance understanding of the molecular mechanism and the latent roles of Prdx1 in GC.
EMT is a central driver of epithelial-derived tumor malignancies. It has been shown to trigger the dissociation of carcinoma cells from primary carcinomas, which subsequently migrate and disseminate to distant sites [20,21]. There has also been a number of confirmed associations between EMT activation and improved tumorigenesis in different human cancer cell lines [22]. As such, carcinoma cells with activated EMT program might uphold its continual expression in a cell-independent way by means of self-reinforcing positive-feedback loops [23]. For instance, for breast cancer, achievement of mesenchymal facets is positively correlated with more destructive subtypes of this disease and tumor development [24–26]. Different studies have also demonstrated that EMT participates in the generation, development, and metastasis of GC [27–29]. Emerging evidence shows that human Prdx1 modulates epithelial-mesenchymal transition through its peroxides activity in A549 lung adenocarcinoma cells [30]. The present study illustrates the association between EMT and Prdx1 in GC and shows high expression of Prdx1 (67.2%) but low expression of E-Ca (56.1%) in gastric cancer tissues. We established a substantial relationship between Prdx1 and EMT based on the expression of Prdx1 and E-Ca. High expression of Prdx1 was found to be related to poor differentiation, deeper invasion, and advanced TNM stage of GC, along with significant association of low expression of E-Ca. High expression of Prdx1 or low expression of E-Ca suggests a poor prognosis. In vitro experimentation validated that Prdx1 promotes the invasion and metastasis activity of GC cell through the mechanism of EMT. Taken all together, our findings suggest a connection between Prdx1 and EMT in GC tissues.
One of the main limitations of our single-center study is the relatively small sample size. In addition, the retrospective design may have contributed to selection bias. Accordingly, a prospective study with a larger cohort of patients is needed to confirm our findings. Also, more studies are needed to determine the mechanism by which EMT and Prdx1 interact with each other.
Conclusions
Our study has demonstrated that upregulation of Prdx1 is correlated with progression of tumors in GC. We carried out primary research to explore the relationship between EMT and Prdx1. Further studies on the biological significance of elevated expression of Prdx1 in GC are needed and will help determine if the expression level of Prdx1 can be used as a prognostic biomarker for GC.
Abbreviations
- Prdx1
Peroxiredoxin 1
- GC
gastric cancer
- EMT
epithelial-mesenchymal transition
- E-Ca
E-cadherin
- PBS
phosphate-buffered saline
- DAB
diaminobenzidine
Footnotes
Source of support: Departmental sources
References
- 1.Torre LA, Siegel RL, Ward EM, et al. Global cancer incidence and mortality rates and trends – an update. Cancer Epidemiol Biomarkers Prev. 2016;25(1):16–27. doi: 10.1158/1055-9965.EPI-15-0578. [DOI] [PubMed] [Google Scholar]
- 2.Van CE, Sagaert X, Topal B, et al. Gastric cancer. Lancet. 2016;388(10060):2654–64. doi: 10.1016/S0140-6736(16)30354-3. [DOI] [PubMed] [Google Scholar]
- 3.Bertuccio P, Liliane C, Levi F, et al. Recent patterns in gastric cancer: A global overview. Int J Cancer. 2009;125(3):666–73. doi: 10.1002/ijc.24290. [DOI] [PubMed] [Google Scholar]
- 4.Hirotsu S, Abe Y, Okada K, et al. Crystal structure of a multifunctional 2-Cys peroxiredoxin heme-binding protein 23 kDa/proliferation-associated gene product. Proc Natl Acad Sci USA. 1999;96(22):12333–38. doi: 10.1073/pnas.96.22.12333. [DOI] [PMC free article] [PubMed] [Google Scholar]
- 5.Jang HH, Lee KO, Chi YH, et al. Two enzymes in one; 2 yeast peroxiredoxins display oxidative stress-dependent switching from a peroxidase to a molecular chaperone function. Cell. 2004;117(5):625–35. doi: 10.1016/j.cell.2004.05.002. [DOI] [PubMed] [Google Scholar]
- 6.Riddell JR, Bshara W, Moser MT, et al. Peroxiredoxin 1 controls prostate cancer growth through Toll-like receptor 4-dependent regulation of tumor vasculature. Cancer Res. 2011;71(5):1637–46. doi: 10.1158/0008-5472.CAN-10-3674. [DOI] [PMC free article] [PubMed] [Google Scholar]
- 7.Quan C, Cha EJ, Lee HL, et al. Enhanced expression of peroxiredoxin I and VI correlates with development, recurrence and progression of human bladder cancer. J Urol. 2006;175(4):1512–16. doi: 10.1016/S0022-5347(05)00659-2. [DOI] [PubMed] [Google Scholar]
- 8.Kim JH, Bogner PN, Baek SH, et al. Up-regulation of peroxiredoxin 1 in lung cancer and its implication as a prognostic and therapeutic target. Clin Cancer Res. 2008;14(8):2326–33. doi: 10.1158/1078-0432.CCR-07-4457. [DOI] [PubMed] [Google Scholar]
- 9.Sun QK, Zhu JY, Wang W, et al. Diagnostic and prognostic significance of peroxiredoxin 1 expression in human hepatocellular carcinoma. Med Oncol. 2014;31(1):1–9. doi: 10.1007/s12032-013-0786-2. [DOI] [PubMed] [Google Scholar]
- 10.Edge SB, Compton CC. The American Joint Committee on Cancer: The 7th Edition of the AJCC Cancer Staging Manual and the Future of TNM. Ann Surg Oncol. 2010;17(6):1471–74. doi: 10.1245/s10434-010-0985-4. [DOI] [PubMed] [Google Scholar]
- 11.Ding C, Fan X, Wu G. Peroxiredoxin 1 – an antioxidant enzyme in cancer. J Cell Mol Med. 2016;21(1):193–202. doi: 10.1111/jcmm.12955. [DOI] [PMC free article] [PubMed] [Google Scholar]
- 12.Cao J, Schulte J, Knight A, et al. Prdx1 inhibits tumorigenesis via regulating PTEN/AKT activity. EMBO J. 2009;28(10):1505–17. doi: 10.1038/emboj.2009.101. [DOI] [PMC free article] [PubMed] [Google Scholar]
- 13.Dittmann LM, Danner A, Gronych J, et al. Downregulation of PRDX1 by promoter hypermethylation is frequent in 1p/19q-deleted oligodendroglial tumours and increases radio- and chemosensitivity of Hs683 glioma cells in vitro. Oncogene. 2012;31(29):3409–18. doi: 10.1038/onc.2011.513. [DOI] [PubMed] [Google Scholar]
- 14.Turnerivey B, Manevich Y, Schulte J, et al. Role for Prdx1 as a specific sensor in redox-regulated senescence in breast cancer. Oncogene. 2013;32(45):5302–14. doi: 10.1038/onc.2012.624. [DOI] [PMC free article] [PubMed] [Google Scholar]
- 15.Gong FH, Liu HT, Li J, et al. Peroxiredoxin 1 is involved in disassembly of flagella and cilia. Biochem Biophys Res Commun. 2014;444(3):420–26. doi: 10.1016/j.bbrc.2014.01.081. [DOI] [PubMed] [Google Scholar]
- 16.Gong F, Hou G, Liu H, et al. Peroxiredoxin 1 promotes tumorigenesis through regulating the activity of mTOR/p70S6K pathway in esophageal squamous cell carcinoma. Med Oncol. 2015;32(2):455. doi: 10.1007/s12032-014-0455-0. [DOI] [PubMed] [Google Scholar]
- 17.Li S, Wang R, Zhang M, et al. Proteomic analysis of non-small cell lung cancer tissue interstitial fluids. World J Surg Oncol. 2013;11:173. doi: 10.1186/1477-7819-11-173. [DOI] [PMC free article] [PubMed] [Google Scholar]
- 18.Riddell JR, Bshara W, Moser MT, et al. Peroxiredoxin 1 controls prostate cancer growth through Toll-like receptor 4-dependent regulation of tumor vasculature. Cancer Res. 2011;71(5):1637–46. doi: 10.1158/0008-5472.CAN-10-3674. [DOI] [PMC free article] [PubMed] [Google Scholar]
- 19.Riddell JR, Maier P, Sass SN, et al. Peroxiredoxin 1 stimulates endothelial cell expression of VEGF via TLR4 dependent activation of HIF-1α. PLoS One. 2012;7(11):e50394. doi: 10.1371/journal.pone.0050394. [DOI] [PMC free article] [PubMed] [Google Scholar]
- 20.Cano A, Pérezmoreno MA, Rodrigo L, et al. The transcription factor snail controls epithelial-mesenchymal transitions by repressing E-cadherin expression. Nat Cell Biol. 2000;2(2):76–83. doi: 10.1038/35000025. [DOI] [PubMed] [Google Scholar]
- 21.Thiery JP, Acloque H, Huang RY, et al. Epithelial-mesenchymal transitions in development and disease. Cell. 2009;139(5):871–90. doi: 10.1016/j.cell.2009.11.007. [DOI] [PubMed] [Google Scholar]
- 22.Creighton CJ, Chang JC, Rosen JM. Epithelial-mesenchymal transition (EMT) in tumor-initiating cells and its clinical implications in breast cancer. J Mammary Gland Biol Neoplasia. 2010;15(2):253–60. doi: 10.1007/s10911-010-9173-1. [DOI] [PubMed] [Google Scholar]
- 23.Scheel C, Eaton EN, Li SH, et al. Paracrine and autocrine signals induce and maintain mesenchymal and stem cell states in the breast. Cell. 2011;145(6):926–40. doi: 10.1016/j.cell.2011.04.029. [DOI] [PMC free article] [PubMed] [Google Scholar]
- 24.Aleskandarany MA, Negm OH, Green AR, et al. Epithelial mesenchymal transition in early invasive breast cancer: An immunohistochemical and reverse phase protein array study. Breast Cancer Res Treat. 2014;145(2):339–48. doi: 10.1007/s10549-014-2927-5. [DOI] [PubMed] [Google Scholar]
- 25.Blanco MJ, Moreno BGD, Locascio A, et al. Correlation of Snail expression with histological grade and lymph node status in breast carcinomas. Oncogene. 2002;21(20):3241–46. doi: 10.1038/sj.onc.1205416. [DOI] [PubMed] [Google Scholar]
- 26.Blick T, Widodo E, Hugo H, et al. Epithelial mesenchymal transition traits in human breast cancer cell lines. Clin Exp Metastasis. 2008;25(6):629–42. doi: 10.1007/s10585-008-9170-6. [DOI] [PubMed] [Google Scholar]
- 27.Liu X, Li Z, Song Y, et al. AURKA induces EMT by regulating histone modification through Wnt/β-catenin and PI3K/Akt signaling pathway in gastric cancer. Oncotarget. 2016;7(22):33152–64. doi: 10.18632/oncotarget.8888. [DOI] [PMC free article] [PubMed] [Google Scholar]
- 28.Xie R, Wang X, Qi G, et al. DDR1 enhances invasion and metastasis of gastric cancer via epithelial-mesenchymal transition. Tumor Biol. 2016;37(9):12049–59. doi: 10.1007/s13277-016-5070-6. [DOI] [PubMed] [Google Scholar]
- 29.Guo W, You X, Xu D, et al. PAQR3 enhances Twist1 degradation to suppress epithelial-mesenchymal transition and metastasis of gastric cancer cells. Carcinogenesis. 2016;37(4):397–407. doi: 10.1093/carcin/bgw013. [DOI] [PubMed] [Google Scholar]
- 30.Ha B, Kim EK, Kim JH, et al. Human peroxiredoxin 1 modulates TGF-β1-induced epithelial-mesenchymal transition through its peroxidase activity. Biochem Biophys Res Commun. 2012;421(1):33–37. doi: 10.1016/j.bbrc.2012.03.103. [DOI] [PubMed] [Google Scholar]


