Abstract
Mass spectral data sets often contain experimental artefacts, and data filtering prior to statistical analysis is crucial to extract reliable information. This is particularly true in untargeted metabolomics analyses, where the analyte(s) of interest are not known a priori. It is often assumed that chemical interferents (i.e. solvent contaminants such as plasticizers) are consistent across samples, and can be removed by background subtraction from blank injections. On the contrary, it is shown here that chemical contaminants may vary in abundance across each injection, potentially leading to their misidentification as relevant sample components. With this metabolomics study, we demonstrate the effectiveness of hierarchical cluster analysis (HCA) of replicate injections (technical replicates) as a methodology to identify chemical interferents and reduce their contaminating contribution to metabolomics models. Pools of metabolites with varying complexity were prepared from the botanical Angelica keiskei Koidzumi and spiked with known metabolites. Each set of pools was analyzed in triplicate and at multiple concentrations using ultraperformance liquid chromatography coupled to mass spectrometry (UPLC-MS). Before filtering, HCA failed to cluster replicates in the data sets. To identify contaminant peaks, we developed a filtering process that evaluated the relative peak area variance of each variable within triplicate injections. These interferent peaks were found across all samples, but did not show consistent peak area from injection to injection, even when evaluating the same chemical sample. This filtering process identified 128 ions that appear to originate from the UPLC-MS system. Data sets collected for a high number of pools with comparatively simple chemical composition were highly influenced by these chemical interferents, as were samples that were analyzed at a low concentration. When chemical interferent masses were removed, technical replicates clustered in all data sets. This work highlights the importance of technical replication in mass spectrometry-based studies, and presents a new application of HCA as a tool for evaluating the effectiveness of data filtering prior to statistical analysis.
Keywords: Hierarchical cluster analysis, technical replicates, dendrogram, chemical interferents, data filtering, principal component analysis
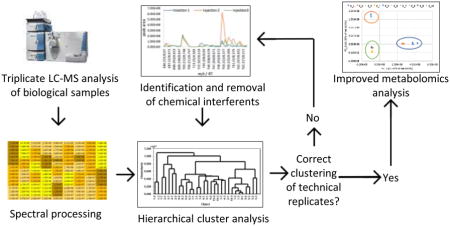
Graphical Abstract
1. Introduction
Metabolomics is a growing field in which analysts seek to comprehensively analyze and compare quantities of metabolites (small molecules) in biological samples [1–6]. Creative applications of metabolomics span over a wide range of subjects, and this tool has been applied to facilitate the understanding of disease pathogenesis [3], to study the effects of diet and drug interactions [7], for biomarker identification [8–10], and for natural products drug discovery [1,11–12]. Mass spectrometry is often the analytical technology of choice for metabolomics research, due to its unparalleled ability to detect metabolites present at low levels [5]. The large data sets generated using untargeted mass spectrometry metabolomics can, however, be difficult to deconvolute.
Because metabolites are not directly coded in to an organism’s DNA and are often influenced by stage of life, source of material, and environmental conditions, it is quite difficult to define the number of metabolites in a given biological sample [14]. As such, a central challenge in the metabolomics field is data analysis [2,6,15,16]. The data sets generated from metabolomics analysis may contain tens of thousands of individually detected compounds, which may include many experimental artefacts [4,17]. The effective handling of such large data sets is a unique challenge [5], and investigation into these data sets requires advanced statistical tools capable of extracting relevant information from the vast quantity of data produced [15]. Unfortunately, these multivariate techniques are often used incorrectly and lack proper validation [15]. False positives are likely to occur when performing statistical analyses on these types of data sets [5] since the number of samples analyzed is typically much lower than the number of variables analyzed. As a consequence, overfitting the data is a serious concern [4,15]. The problem of false positives grows when peaks not associated with the sample are included in the dataset, and effective filtering of contaminants is a critically important step to increase the accuracy of multivariate modeling [13].
Removing interferents prior to statistical analysis has numerous advantages. The filtering process allows for a more comprehensive annotation, and if artefacts are not removed, the relationships between samples may be distorted, potentially leading to a different biological interpretation [6,13,15]. Typically a two-step process is required to remove random analytical noise. First, chromatograms must be visually inspected to identify the signal intensity of the baseline. Following baseline signal assessment, any signals at or below the assigned baseline cutoff are then subtracted from the dataset. The remaining peaks should represent compounds associated with true chemical signals, although interpreting whether these signals originate from the sample or from background contamination remains a challenge [5].
Numerous types of chemical interferents can confound statistical analysis. Many interfering species are introduced as part of the sample preparation process itself, and may include solvent contaminants or polymeric interferents originating from sample vials, pipette tips or filter membranes. These contaminants will be consistent across samples, and are not the focus of this study. Some chemical interferents are not incorporated into the sample during sample preparation, but are introduced during the sample analysis step. These interferents originate from the analytical instrumentation, including silica capillaries, tubing, and HPLC column packing materials used for chromatographic separation [18–19]. We predict that chemical signals from these types of interferents may vary from sample to sample, and, consequently, will not be removable by blank subtraction [20].
Numerous approaches exist for identifying peaks exclusively associated with sample. One approach utilizes isotope-enriched nutrients in the growing media for mammalian cell culture [15,21], plant tissue culture [22], or fungal culture [23]. This approach produces labeling patterns that enable identification of which compounds are associated with the organism, and can highlight systematic changes in metabolic processes due to various factors including environmental stress, genetic mutations, and disease state [15]. Isotope labeling is an undeniably useful tool, but is only appropriate for applications assessing organisms grown in controlled environments.
Hierarchical cluster analysis (HCA) is a tool that uses an algorithm to produce a dendrogram that assembles variables or objects into a single tree, allowing users to visualize the similarity of the samples under analysis [5,24]. The HCA approach is usually used as a clustering tool to evaluate intra- and inter-group similarities and differences, similar to principal component analysis (PCA) [5,25]. In one study, HCA was used as a filtering tool to identify fragment ions associated with contaminant peaks [26]. This process was used to overcome a common problem in gas chromatography-mass spectrometry GC-MS analysis, which is the production of molecular fragments originating from background contaminants such as fiber material. Using HCA, the investigators clustered the fragments in their samples, and identified and subsequently removed a cluster of masses associated with non-sample molecular fragments [26].
Here we present a new application of HCA, that of identifying chemical interferents in LC-MS analyses. We have chosen to use HCA over other clustering tools due to some distinct advantages for this application. First, HCA is a quantitative method to assess chemical similarity of different samples under analysis and the visualization in terms of a dendrogram makes it easy to assess if the removal of interferents has been successful. In other approaches, including K-Means clustering, density-based special clustering of applications with noise (DBSCAN), and PCA, the similarity of individual points is often difficult to determine by visual inspection. Furthermore, supervised analyses such as partial least squares-discriminant analysis (PLS-DA) require dependent variables that are able to separate contaminating interferents from discriminating compounds originating in the samples, and are not possible for this application. The goal of this study is to identify interferents that are introduced to the sample during the analysis process. This is achieved by comparing triplicate injections of the same sample (technical replicates) using HCA. Because the sample composition across replicate injections is identical, it is our expectation that chemical entities that vary across replicates will be interferents originating from analytical instrumentation, and that their removal will improve the quality of the data.
2. Experimental Section
2.1 Sample Preparation
The sample used for this study was produced as part of a separate project with the goal of optimizing the workflow for chemometric analysis in natural products research. These same samples were selected as a basis for the current study because they provided a good test case for evaluating chemical interference. To prepare the samples, a simplified extract of the botanical Angelica keiskei Koidzumi was spiked with four known compounds: alpha-mangostin (1% of total extract mass), cryptotanshinone (2% of total extract mass), magnolol (7% of total extract mass), and berberine (15% of total extract mass). Details about the method of extract preparation and can be found under Supporting Information.
2.2 Fractionation Procedure
The spiked Angelica keiskei root extract was divided into three equal portions and subjected to reversed-phase HPLC separations. All three separations were conducted using the same gradient using a Gemini-NX reversed phase preparative HPLC column (5μm C18, 250 × 21.20 mm; Phenomenex, Torrance, CA, USA) at a flow rate of 21.4 mL min−1. Starting conditions were 30:70 ACN:H2O, which was increased to 55:45 over 8 min. Over the next two min., conditions were increased to 75:25, after which they were increased to 100% ACN by 28 min. Finally, the solvent composition was held at 100% ACN for two min.
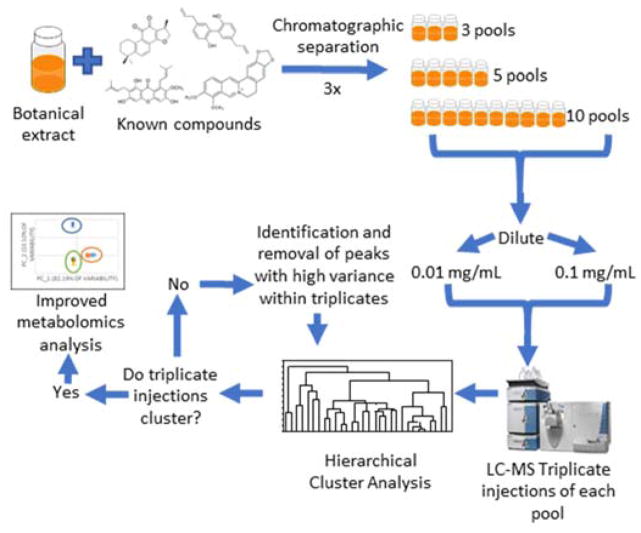
Chromatographic separation was completed three times, with each separation yielding 90 test tubes. To evaluate the effect of sample complexity on hierarchical clustering analysis and data filtering approaches, we varied the number of pools in which the resulting tubes were combined. A “pool” is defined as a set of chromatographic fractions (in this case, multiple individual test tubes) that are combined together following chromatographic separation. The first set of 90 tubes was combined into three pools containing 30 tubes each, representing our most chemically complex samples. The second set of 90 tubes was combined into five pools consisting of 18 tubes each, and the final set of 90 tubes was combined into ten pools, each containing 9 tubes (Scheme 1). Each pool was dried under nitrogen and resuspended prior to LC-MS analysis.
Scheme 1. Workflow for subset preparation and subsequent analysis.
A botanical mixture spiked with the known compounds berberine, magnolol, cryptotanshinone, and alpha-mangostin was fractionated three times and separated into equal sample sets containing 3, 5, or 10 final pools. The resulting pools were suspended at 0.1 or 0.01 mg mL−1 (reported as mass of dry extract per volume solvent) in methanol for UPLC-MS analysis. Each data subset was analyzed using hierarchical cluster analysis (HCA) before and after filtering to remove chemical interferents.
2.3 Mass Spectral Analysis
Full scan ultraperformance liquid chromatography-mass spectrometry (UPLC-MS) analysis was conducted on each pool using a Thermo-Fisher Q-Exactive Plus Orbitrap mass spectrometer (ThermoFisher Scientific, MA, USA) connected to an Acquity UPLC system (Waters, Milford, MA, USA) with reversed phase UPLC column (BEH C18, 1.7 μm, 2.1 × 50 mm, Waters Corporation, Milford, MA, USA). All pools were analyzed in triplicate at two different concentrations (0.1 mg mL−1 and 0.01 mg mL−1 in methanol, where concentration is expressed as mass of pool per volume of solvent), with 3 μL injections. The gradient was comprised of solvent A (water with 0.1% formic acid) and solvent B (acetonitrile with 0.1% formic acid). The gradient began with 90:10 (A:B) from 0–0.5 min, and increased to 0:100 (A:B) from 0.5–8.0 min. The gradient was held at 100% B for 0.5 min, before returning to starting conditions over 0.5 min and held from 9.0–10.0 min. Mass analysis was performed separately in both positive and negative ion modes over a m/z range of 150–1500 with the following settings: capillary voltage at −0.7 V, capillary temperature at 310°C, S-lens RF level at 80.00, spray voltage at 3.7 kV, sheath gas flow at 50.15, and auxiliary gas flow at 15.16. The top four most intense ions were fragmented with CID of 35.0.
2.4 Baseline Correction and Hierarchical Cluster Analysis
2.4.1. Baseline Correction/MZMine Parameters
UPLC-MS data collected in both negative and positive modes were individually analyzed, aligned, and filtered utilizing MZmine 2.21.2 software (http://mzmine.sourceforge.net/) [27]. Raw mass spectral data from triplicate injections of each pool within the three sets were uploaded for peak picking into MZmine. Chromatograms were constructed for all m/z values with peak widths greater than 0.1 minute, after which they were simplified using algorithms applied to recognize individual peaks. The peak detection parameters were set as follows: noise level (absolute value) at 2.0 × 10⁶ (positive mode, 0.1 mg mL−1 samples), 1.0 × 10⁷ (positive mode, 0.01 mg mL−1 samples), and 1.0 × 10⁶ (negative mode, both 0.1 mg mL−1 and 0.01 mg mL−1 samples), m/z tolerance of 0.0001 Da or 5 ppm, and an intensity variation tolerance at 20%. Peaks were aligned if their masses were within 5 ppm and their retention times differed by less than 0.2 min from one another. Peak list filtering and retention time alignment were completed to produce an aligned peak list. The resulting data matrix, consisting of m/z, retention time, and peak area, was imported into Excel (Microsoft, Redmond, WA, USA). Peak lists for positive and negative ions were combined, and separate data sets were generated for high and low concentration samples. No further pre-processing of data sets was completed before hierarchical cluster analysis and data filtering.
2.4.2. Hierarchical Cluster Analysis and Chromatogram Visualization
Hierarchical clustering analysis and resulting filtering protocols were completed using Sirius version 10.0 statistical software (Pattern Recognition Systems AS, Bergen, Norway) [28–29]. For this analysis, an average-linkage algorithm [30] was used to cluster objects. Euclidean distance was used as a metric to evaluate object similarity. There are numerous other metrics and similarity measures that could potentially be effective for this purpose, but the method selected here has the advantage of being transparent and easy to understand even for a user who is not mathematically inclined.
Six data sets were produced (three high-concentration and three low-concentration data sets containing 3-, 5-, or 10-pools and their triplicate injections) and inspected using HCA. A dataset was considered correctly clustered only when all triplicate injections were linked to each other before being linked to other samples in the dendrogram. If triplicate injections did not cluster, spectral variables (mass/retention time pairs) were inspected for each set of triplicates. Since highly abundant or highly ionizable compounds inherently have higher count variance, the contaminant masses were identified by examining relative variance within each set of technical replicates, defined by Equation 1. Variance (sk2) represents the sum of the squared differences of each compound’s peak area (xk) from the mean of its peak area within replicate injections (x̄k), divided by the number of replicates (Nr). Relative variance of peak k in sample i (RVk,i) was calculated by dividing the variance within replicates by the mean.
| (Equation 1) |
Notably, it is possible that a non-interferent peak may show high variability in peak area from injection to injection, particularly if it co-elutes with another sample component that impacts its ionization. To minimize the risk of removing false positives, we chose to sort variables from high to low RV based on their average relative variance values ( ), defined by Equation 2. Even if in one sample the ionization of a given sample component was affected by matrix effects, it is unlikely that this response would be consistent across samples with different chemical constituents. Average relative variance for the peak was calculated by dividing the sum of the relative variances (calculated within each pool’s set of replicate injections: RVk,1, RVk,2, … RVk,p) by the number of pools (Np).
| (Equation 2) |
Using Equation 2, the variables with the highest average relative variance were identified and removed, and intermittent hierarchical cluster analysis was conducted. To assist the analysis, spectral variable plots were utilized to visualize mass/retention time pairs identified using the selected relative variance cutoff as contaminants as well as their corresponding ions. The ions that demonstrated peak area variability within triplicate sets higher than the selected threshold, as well as their associated isotopes, in-source clusters, or fragments were removed from analysis. HCA was repeated to visualize how well samples clustered once the contaminants were removed. This process was repeated until triplicate injections of each sample were linked to one another before being linked to other samples in all data sets.
3. Results and Discussion
3.1 Hierarchical Cluster Analysis and Data Filtering
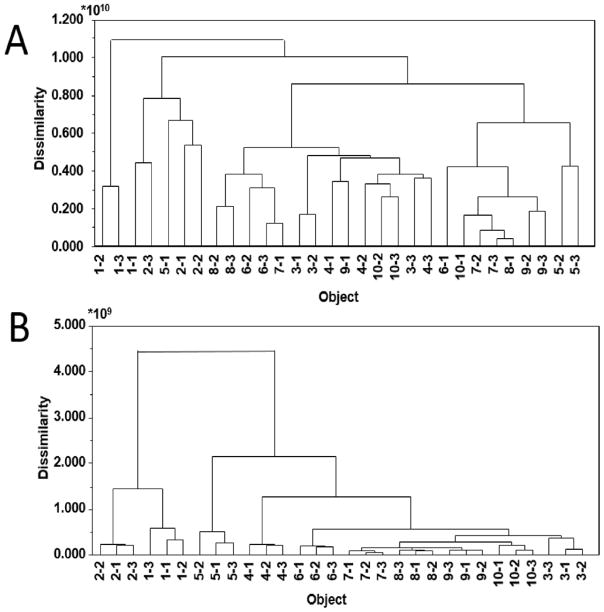
The goal of this study was to identify and remove chemical contaminants from mass spectral data sets. Towards this goal, HCA was conducted on six sets of pools, where each pool was injected in triplicate (technical replicates) into the UPLC-MS system. Each dataset was analyzed by HCA after baseline correction and peak alignment.5 It was expected that the replicates would show high chemical similarity and cluster together in the dendrogram. Before filtering out chemical interferents with high peak area variability within technical replicates, however, triplicate injections clustered together in only one of the six data sets—the three-pool subset analyzed at 0.1 mg mL−1 (Table 1, Figure 1).
Table 1.
Summary of hierarchical clustering analysis results before and after data filtering.
| Sample Set | Percentage of Correct Triplicate Clusters Before & After Filtering Analysis (Before, After) | Average Dissimilarity Score* Before & After Filtering Analysis (Before, After) |
|---|---|---|
| Three pool set, 0.1 mg mL−1 | 100%, 100% | 5.23 × 10⁹, 3.23 × 10⁹ |
| Three pool set, 0.01 mg mL−1 | 33%, 100% | 6.17 × 10⁹, 8.62 × 10⁸ |
| Five pool set, 0.1 mg mL−1 | 60%, 100% | 6.18 × 10⁹, 2.34 × 10⁹ |
| Five pool set, 0.01 mg mL−1 | 20%, 100% | 5.71 × 10⁹, 4.54× 10⁸ |
| Ten pool set, 0.1 mg mL−1 | 40%, 100% | 3.05 × 10⁹, 1.36 × 10⁹ |
| Ten pool set, 0.01 mg mL−1 | 0%, 100% | 8.13 × 10⁹, 3.72 × 10⁸ |
Figure 1. Euclidean dendrograms of the ten-pool, 0.01 mg mL−1 data subset before (A) and after (B) filtering analysis *.
* Samples have been identified first by their pool number followed by the injection number. For example, 1-1 is the first pool, and first injection of three technical replicates.
On inspecting the data sets, it was determined that certain masses were present in all samples but did not display consistent peak area across triplicates. We hypothesized that these masses were chemical interferents, and not truly components of the sample. Thus, removing these masses from the data sets should result in the expected clustering of replicates. To identify the variables representing chemical interference, we inspected triplicate injections in two ways. First, the relative variance of each variable was calculated for each set of triplicate injections as defined in Equations 1 and 2. The relative variance cutoff was determined reducing the threshold until the dendrograms showed the expected classification of replicate injections. The dataset was considered filtered when replicates clustered together before clustering to additional samples. Using this method, contaminant peaks were assigned as those that had an average relative variance ratio (across all pools) greater than 1.0 × 10⁷ for low concentration data sets, and 4.1× 10⁷ for high concentration data sets. The same interferents were identified in both subsets, though more interferents were identified using the low concentration data subsets.
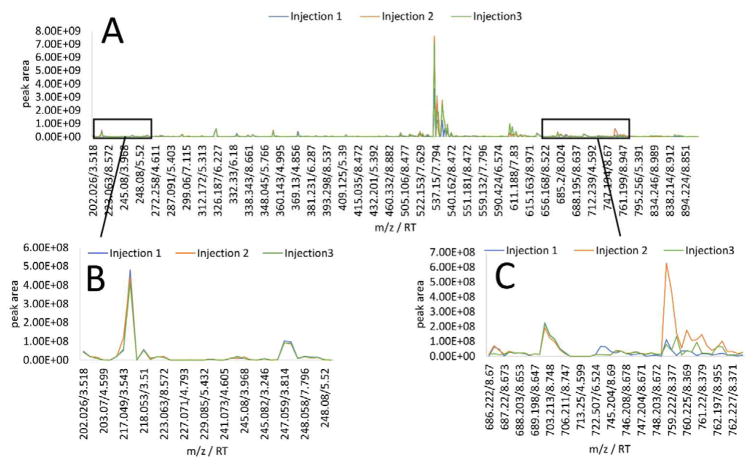
In addition, each chromatogram was visually inspected using a spectral variable plot, in which the mass/retention time of each unique spectral variable was plotted on the x-axis, and corresponding peak area of that variable was plotted on the y-axis (Figure 2A). Ions that were part of the sample, including the known compounds spiked into the mixture, showed consistent peak area across triplicate injections (Figure 2B), whereas purported contaminants typically did not (Figure 2C). Spectral variable visualization also enabled the identification of peaks associated with the contaminant masses, such as 13C isotopes and in source clusters and fragments, which were not identified based solely on the mathematical approach. For example, two mass/retention time pairs were identified at m/z 744.201 and 744.211 using the relative variance cutoff. Upon spectral variable inspection, additional isotope peaks and mass spectral artefacts associated with this contaminant were identified (e.g. m/z 746.188, 746.198, and 746.208, Table S-1), despite their low relative variance (Figure 2C). Removing these ions improved clustering, allowing for a more complete representation of contaminants. Background contaminants with high peak area variation between triplicate injections, as well as their associated masses, were removed from the peak list, and HCA was repeated. Following the removal of these compounds, triplicates clustered in all six sample subsets and the average dissimilarity score of technical replicates decreased (Table 1). An example dendrogram before and after filtering is shown in Figure 1. It is important to note that there is the possibility that true sample components may share the same m/z and retention times as isotopes and mass spectral artefacts and be accidentally removed during this process. In some cases, fragmentation patterns can be evaluated to assess whether or not these masses are truly associated with contaminant peaks showing high relative variance. This may not always be possible, however, so users familiar with the analytical instrumentation and the biological sample under analysis should conduct this part of the filtering process carefully, with the goals of the project in mind.
Figure 2. Spectral variable inspection of triplicate injections from the second pool from the five-pool, 0.01 mg mL−1 data subset.
2A. Overlaid spectral variable plots of triplicate injections in which peak areas of each variable are plotted for comparison. 2B. Spectral variables associated with the sample under analysis. Overlapping traces are consistent from injection to injection. 2C. Spectral region associated with chemical contamination showing a variance/mean peak area ratio greater than 1.0 × 10⁷.
3.2 Sources of Contamination
3.2.1. Source of Chemical Interferents with High Peak Area Variability
As analytical instruments have become more sensitive and more high throughput, the list of potential interferents detected grows [31]. During chromatographic separation and mass spectral analysis, the sample comes into contact with a variety of surfaces that could lead to chemical contamination not associated with the sample, such as polymeric interferences from plasticware and tubing [31]. We hypothesized that ions demonstrating high peak area variation between triplicate injections were due to chemical interferents coming from sources such as these. These contaminants (Table S-1) were consistent in their identity (although not peak area) across data sets. Of the 128 contaminant peaks removed from analysis, 22 were tentatively identified (using accurate mass data) as associated with polysiloxanes as reported by Keller et al. [31]. Indeed, polysiloxanes are found in silica capillary tubes such as those used for UPLC-MS analysis as well as in column packing materials [18–19].
To investigate our hypothesis that these contaminants originated from the analytical instrumentation, the accurate masses and retention times of common interferents were compared to blank injections containing methanol with no sample. Methanol blanks were included throughout the run. Of the 128 contaminants identified, 121 were present in at least one of the blanks. Interestingly, forty-four of the chemical interferent features were not found in every blank. Thus, it appears that the interferents originate from the UPLC-MS system itself, and not from the solvent alone (although it is possible that both the solvent and the UPLC-MS system might contain some of the same contaminants).
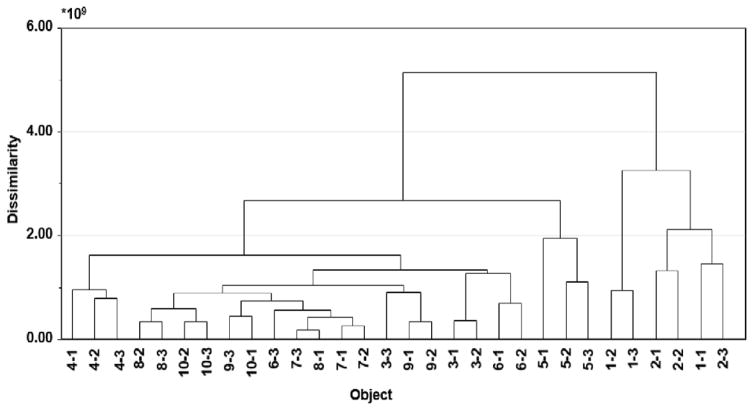
It is common practice in metabolomics analysis to subtract peaks contained within the blank from the data sets under study [20]. However, our results (Figure 2) show that ion abundance of chemical contaminants can vary from injection to injection, so the list of contaminants removed will likely not be comprehensive using a simple blank subtraction. Indeed, when we produced a dendrogram of the 0.01 mg mL−1, ten-pool set after subtracting peaks contained within one of the blanks, the triplicate injections only clustered together for two out of ten pools (Figure 3). Additionally, in cases where carryover occurs between sample and blank injections, it is possible that ions contained in the sample can be inadvertently removed by blank subtraction. The method proposed here in which replicate injections are compared to identify potential contaminants circumvents the problems associated with subtracting the peaks from a single blank injection.
Figure 3. Euclidean dendrogram of the ten-pool, 0.01 mg mL−1 data subset following subtraction of masses contained in one blank from analysis.
This example illustrates that blank subtraction was insufficient since replicates do not cluster correctly.
3.2.2. The Potential for False Positives
We have illustrated that an important type of chemical interference originates from the LC-MS equipment itself, and have developed a method to minimize its contribution to metabolomics datasets. However, there is the potential for this approach to remove actual sample components that show high variability among replicate injections. Peak area variance can occur for a number of reasons, including matrix ionization effects, injection errors, and sample carryover from previous injections [32]. Matrix effects leading to changes in compound ionization efficiency or mobility can result from interactions with other components of the sample. If a particular compound co-elutes with another sample component that impacts its ionization, for example, it may not show consistent peak area from injection to injection and could be identified as a false positive. Similarly, injection errors, in which the actual sample volume analyzed via LC-MS is different than expected, can lead to large differences in peak area across injections, even for true sample components [32].
Although there is a risk for removing false positives with the method proposed herein, the use of average relative variance as a metric to define contaminants (Equation 2) reduces this risk. It is likely, for example, that in at least one set of triplicate injections a real sample component may be affected by matrix effects and consequently show a high relative variance. It is unlikely, however, for this matrix effect to be consistent across all samples under analysis, and the high relative variance value from one sample should be normalized by averaging with low relative variance values from other samples. The same is true for injection errors and sample carryover.
It is of course possible that even when using average relative variance, we may unintentionally remove important sample components from our datasets. To reduce this risk further, we recommend the use of internal standards. These internal standards should consist of compounds possessing diverse properties and should not be found in the biological sample under analysis [32]. Differences in peak areas of these internal standards can allow researchers to identify samples that may have been compromised by sample injection errors or matrix effects.
3.2.3. Complementary Quality Control Practices to Improve Metabolomics Datasets
It is important to note that the types of chemical contaminants identified using the approach presented here are only those contaminants that vary distinctly from replicate injection to injection. Interferents that originate from the sample preparation process will be consistent across technical replicates and not identified with the HCA approach demonstrated here. Complex calibrants such as process blanks, which do not contain biological material but have undergone the same chemical treatment as biological samples [32] should be included in LC-MS analyses to identify interferents resulting from sample preparation. Compounds found in process blanks may represent some of the same contaminants identified using this HCA approach (if the sample had gone through some sort of chromatographic separation step before LC-MS analysis, for example), but will likely contain additional chemical contaminants including pipette tip contaminants and extraction solvent impurities [32–33]. Although we have illustrated that the inclusion of solvent blanks is not sufficient to remove all contaminants from analysis, blank runs are still undeniably important, as they allow researchers to define an appropriate baseline cutoff, estimate background noise, and evaluate carryover effects [20, 32].
3.3 Effects of Sample Number and Concentration on Dendrogram Analysis
To evaluate the effect of sample number and concentration on filtering analysis, we compared sets containing three-, five-, or ten-pools at concentrations of 0.1 mg mL−1 and 0.01 mg mL−1 (expressed as mass of the mixture per volume solvent). Because the three-, five-, and ten-pool subsets all originated from the same starting mixture, the resulting pools will be the most complex with the lowest number of pools (Scheme 1).
Data sets containing greater numbers of samples were more impacted by chemical interferents, as were samples injected at the lower concentration of 0.01 mg mL−1 (Table 1). For example, the average dissimilarity scores, calculated by averaging scores from the 0.1 mg mL−1 subsets and the 0.01 mg mL−1 subsets, respectively, were higher in low-concentration groups when compared to their high-concentration counterparts (6.67 × 10⁹ versus 4.82 × 10⁹, respectively). Following filtering analysis, high-concentration groups showed greater dissimilarity scores than the low- concentration subsets (2.71 × 10⁹ and 8.39 × 10⁸, respectively). After filtering, both high- and low-concentration subsets displayed lower dissimilarity scores than they did preceding data filtering, indicating that the contaminant peaks contributed to the high dissimilarity between triplicate injections.
The results of these comparisons are illuminating, and suggest that metabolomics studies of simpler samples may be more impacted by chemical interferents. Indeed, the three-pool dataset, regardless of injection concentration, consistently showed the highest number of correct clusters before filtering analysis. Because they contain more compounds that are consistent between triplicate injections, the varying concentrations of contaminants have less effect on the overall clustering of more complex pools. With the simpler pools in the ten-pool dataset, the effect of high variability in peak area of contaminant peaks has a greater influence on the overall model. Similarly, the effect of contaminant interference appears to be greater with low-concentration injections, presumably because the contaminant peaks have larger relative peak areas in these subsets. This is an important point, because metabolomics analysis is often focused on identifying very low-abundant peaks from highly complicated samples. As such, filtering analysis to remove interferents may be critical for success.
3.4 PCA Scores and Loadings
Principal Component Analysis (PCA) is one of the most commonly employed tools in metabolomics data analysis and is used to group objects by chemical similarity [11]. Groupings of objects can be visualized in a PCA scores plot, and the variables contributing to the groupings can be assessed using a PCA loadings plot. PCA was used here as an alternative technique to HCA to assess the similarity of triplicate injections.
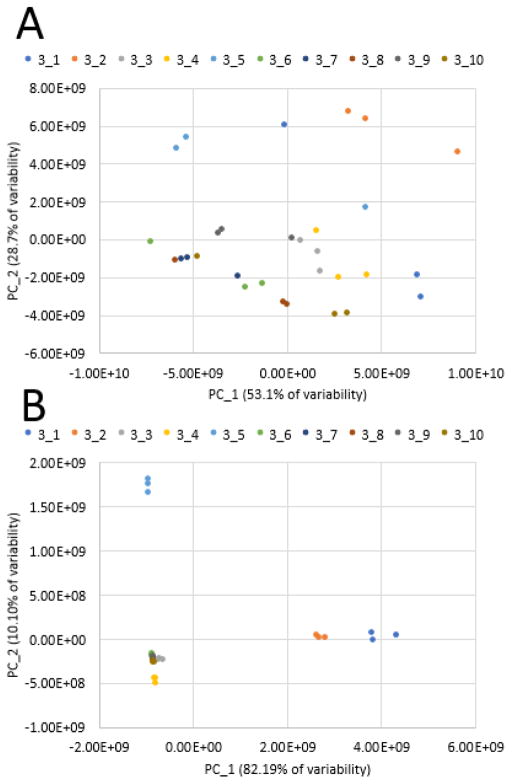
As an example, the ten-pool, low-concentration dataset was subjected to PCA before and after removal of the chemical interference ions. Before filtering, untargeted metabolomics analysis of these pools yielded 467 marker ions with unique retention time-m/z pairs. The resulting PCA model comparing the pools was comprised of two components explaining 81.8% of the variance (component 1: 53.1%, component 2: 28.7%). The technical replicates of each pool did not cluster on the resulting scores plot, indicating that chemical interferents have a severe impact on clustering analysis (Figure 4A). Following spectral variable inspection and removal of contaminant masses, a new PCA model was produced, this time containing 339 ions. The two-component model explained 92.29% of the variance (component 1: 82.19%, component 2: 10.10%). With this model, triplicate injections are overlaid on the plot, indicating that statistical analysis was virtually unaffected by chemical interferents (Figure 4B). If chemical interferents that varied from injection to injection were still impacting the analysis, we would expect that triplicates would not cluster in the scores plot, as evidenced with Figure 4A. Any contaminants that remain in the dataset after the filtering and contaminant removal display consistent peak area across all samples under analysis, and will consequently have little or no effect on the clustering of samples observed in principal component analysis.
Figure 4. PCA Scores plots before (A) and after (B) data filtering of the ten-pool, 0.01 mg mL−1 data subset.
4A. Technical replicates are not overlaid on the plot, and clustering of groups is difficult to visualize. 4B. Technical replicates are overlaid as expected, and there is distinct separation between groups.
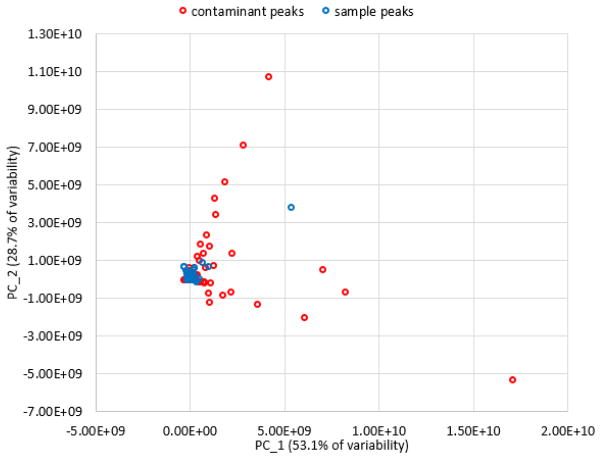
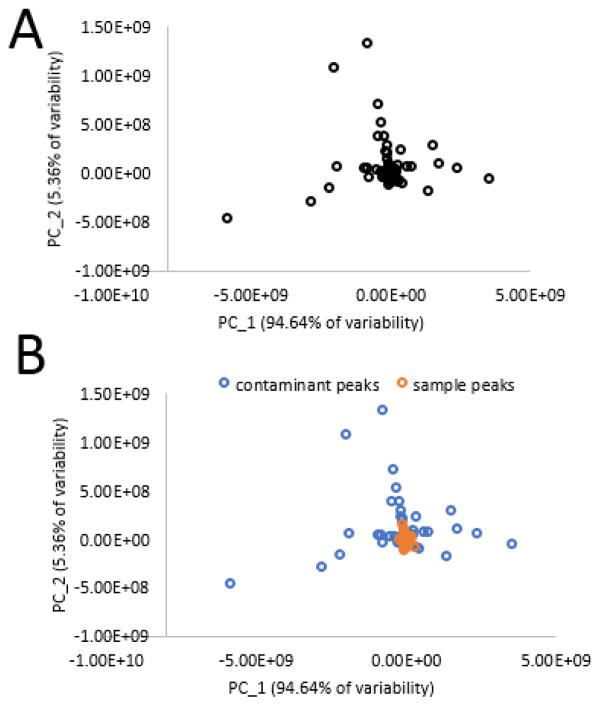
The PCA loadings plot before analysis is also revealing (Figure 5). It shows that many of the loadings resulting in separation of pools are associated with chemical interferents. Hypothetically, it would be possible to utilize PCA loadings plots of triplicate injections to visualize which compounds contribute to separation of chemical replicates (Figure 6). Because this loadings plot is comprised solely of a set of triplicate injections, all variables should be clustered together. However, this is clearly not the case, and any variables that lead to group separation are due to chemical interference introduced after sample injection. From Figure 6B, it is apparent that variables associated with contaminants are responsible for the separation between triplicate injections. However, blue contaminant variables and orange sample variables do begin to overlap in the center of the plot, making visual interpretation virtually impossible without a priori knowledge of the sample mixture components. For example, the loadings plot of one set of triplicate injections (first pool of the ten-pool set, 0.01 mg mL−1) is very difficult to interpret, and contaminant peaks can only be arbitrarily identified (Figure 6). This example is representative of a common problem identified across all data sets under analysis in the current study.
Figure 5. PCA loadings plot of the ten-pool, 0.01 mg mL−1 data subset before filtering of chemical interferents.
Most of the variables contributing to group separation are contaminant peaks.
Figure 6. PCA loadings plot of triplicate technical replicates from pool one of the ten-pool, 0.01 mg mL−1 data subset.
6A. Loadings plot illustrating all variables contributing to group separation. 6B. Color-coded loadings plot allowing visualization of contaminant and sample peak influence on group separation. Many of the chemical contaminants are close to the center cluster, and would not be reliably identified using PCA loadings alone.
4. Conclusions
Robust data pretreatment is necessary to extract reliable information from mass spectrometry data sets. The results presented here demonstrate that HCA of technical replicates is a valuable tool for data pretreatment by enabling the identification and removal of certain interferents. In its current form, however, there is still a considerable amount of user-intervention required. Further developments should focus on automating this approach as much as possible so that users do not have to iteratively filter their data by hand and define the relative variance cutoff. However, identifying peaks that are associated with interferents yet do not show high relative peak area variance will still require identification by the user, and this application will vary from experiment to experiment and depend on the goals of the project itself.
It is often assumed that chemical interference in mass spectral data is consistent across samples, and should, therefore, be removable by blank subtraction. On the contrary, here we show that certain chemical interferents can vary in signal intensity across technical replicates. Such interferents can be identified and removed with the approach presented here. It is particularly important to identify and remove these types of interferents, given that the very premise of metabolomics experiments is that the compounds that vary among samples are likely to be chemically or biologically relevant. Many studies are conducted without technical replicates, and the results of the current study show the potential limitation of such an experimental design and demonstrate a straight-forward alternative strategy.
Supplementary Material
Highlights for Review.
We develop a method to remove interferents in mass spectrometry metabolomics
Interferents are identified when abundance varies among technical replicates
We show that blank subtraction does not remove this type of interference
Hierarchical clustering analysis confirms that filtering has been sufficient
This approach could be used for data pretreatment in other analytical studies
Acknowledgments
The authors would like to thank Strictly Medicinal Seeds® for their provision of plant material used in this project. Research reported in this publication was supported in part by the National Center for Complementary and Integrative Health of the National Institutes of Health under award numbers 5 T32 AT008938 (fellowship to LKC), U54 AT008909 (NaPDI, Center of Excellence for Natural Product Drug Interaction Research), and R01 AT006860.
Footnotes
Author Contributions
The manuscript was written through contributions of all authors. All authors have given approval to the final version of the manuscript.
Notes
The authors declare that there are no conflicts of interest.
A description of the plant material, extraction procedure, and fractionation process can be found in the Supporting Information. A complete list of contaminant masses identified using this approach can be found in Supporting Information, Table S-1.
The Supporting Information is available free of charge on the ACS Publications website.
Publisher's Disclaimer: This is a PDF file of an unedited manuscript that has been accepted for publication. As a service to our customers we are providing this early version of the manuscript. The manuscript will undergo copyediting, typesetting, and review of the resulting proof before it is published in its final citable form. Please note that during the production process errors may be discovered which could affect the content, and all legal disclaimers that apply to the journal pertain.
References
- 1.Matsuda F. Technical Challenges in Mass Spectrometry-Based Metabolomics. Mass Spectrom (Tokyo) 2016;5(2):S0052. doi: 10.5702/massspectrometry.S0052. [DOI] [PMC free article] [PubMed] [Google Scholar]
- 2.Ceglarek U, Leictle A, Brügel M, Kortz L, Brauer R, Bresler K, Thiery J, Fiedler GM. Challenges and developments in tandem mass spectrometry based clinical metabolomics. Cell Endocrinol. 2009;301(1–2):266–271. doi: 10.1016/j.mce.2008.10.013. [DOI] [PubMed] [Google Scholar]
- 3.Li X, Zhang A, Sun H, Liu Z, Zhang T, Qiu S, Liu L, Wang X. Metabolomic characterization and pathway analysis of berberine protects against prostate cancer. Oncotarget. 2017 doi: 10.19632/oncotarget.17531. [DOI] [PMC free article] [PubMed] [Google Scholar]
- 4.Klupczyńska A, Derenziński P, Kokot ZJ. Metabolomics in Medical Sciences—Trends, Challenges, and Perspectives. Acta Pol Pharm. 2015;72(4):629–641. [PubMed] [Google Scholar]
- 5.Boccard J, Veuthey JL, Rudaz S. Knowledge discovery in metabolomics: an overview of MS data handling. J Sep Sci. 2010;33(3):290–304. doi: 10.1002/jssc.200900609. [DOI] [PubMed] [Google Scholar]
- 6.Monteiro MS, Carvalho M, Bastos ML, Guedes de Pinho P. Metabolomics analysis for biomarker discovery: advances and challenges. Curr Med Chem. 2013;20(2):257–271. doi: 10.2174/092986713804806621. [DOI] [PubMed] [Google Scholar]
- 7.Wishart DS. Applications of metabolomics in drug discovery and development. Drugs R D. 2008;9(5):307–322. doi: 10.2165/00126839-200809050-00002. [DOI] [PubMed] [Google Scholar]
- 8.Ackermann BL, Hale JE, Duffin KL. The role of mass spectrometry in biomarker discovery and development. Curr Drug Metab. 2006;7(5):525–539. doi: 10.2174/138920006777697918. [DOI] [PubMed] [Google Scholar]
- 9.van der Greef J, Hankemeier T, McBurney NR. Metabolomics-based systems biology and personalized medicine: moving towards n=1 clinical trials? Pharmacogenomics. 2007;7(7):1087–1094. doi: 10.2217/14622416.7.7.1087. [DOI] [PubMed] [Google Scholar]
- 10.Sreekumar A, Posson LM, Thekkelnaycke M, Rajendiran R, Khan AP, Cao Q, Yu J, Laxman B, Mehra R, Lonigro RJ, Li Y, Mukesh K, Ahan NA, Kalyana-Sundaram S, Han B, Cao X, Byun J, Omenn GS, Ghosh D, Pennathur S, Alexander DC, Berger A, Shuster JR, Wei JT, Varambally S, Beecher C, Chinnaiyan AM. Metabolomic profiles delineate potential role for sarcosine in prostate cancer progression. Nature. 2009;457:910–914. doi: 10.1038/nature07762. [DOI] [PMC free article] [PubMed] [Google Scholar] [Research Misconduct Found]
- 11.Kellogg JJ, Todd DA, Egan JM, Raja HA, Oberlies NH, Kvalheim OM, Cech NB. Biochemometrics for Natural Products Research: Comparison of Data Analysis Approaches and Application to Identification of Bioactive Compounds. J Nat Prod. 2016;79(2):376–386. doi: 10.1021/acs.jnatprod.5b01014. [DOI] [PMC free article] [PubMed] [Google Scholar]
- 12.Chau F-T, Chan H-Y, Cheung C-Y, Xu C-J, Liang Y, Kvalheim OM. Recipe for uncovering the bioactive components in herbal medicine. Anal Chem. 2009;91:7217–7225. doi: 10.1021/ac900731z. [DOI] [PubMed] [Google Scholar]
- 13.McMillan A, Renaud JB, Gloor GB, Reid G, Sumarah MW. Post-acquisition filtering of salt cluster artefacts for LC-MS based human metabolomic studies. J Cheminform. 2016;8(1):44. doi: 10.1186/s13321-016-0156-0. eCollection. [DOI] [PMC free article] [PubMed] [Google Scholar]
- 14.Mikami T, Aoki M, Kimura T. The application of mass spectrometry to proteomics and metabolomics in biomarker discovery and drug development. Curr Mol Pharmacol. 2012;5(2):301–316. doi: 10.2174/1874467211205020301. [DOI] [PubMed] [Google Scholar]
- 15.Marshall DD, Powers R. Beyond the paradigm: Combining mass spectrometry and nuclear magnetic resonance for metabolomics. Prog Nucl Magn Reson Spectrosc. 2017;100:1–16. doi: 10.1016/j.pnmrs.2017.01.001. [DOI] [PMC free article] [PubMed] [Google Scholar]
- 16.Rochford S. Metabolomics reviewed: a new “omics” platform technology for systems biology and implications for natural products research. J Nat Prod. 2005;68(12):1813–1820. doi: 10.1021/np050255w. [DOI] [PubMed] [Google Scholar]
- 17.de Jong F, Beecher C. Addressing the current bottlenecks of metabolomics: Isotopic Ratio Outlier Analysis™, an isotopic-labeling technique for accurate biochemical profiling. Bioanalysis. 2012;4(18):2303–2314. doi: 10.4155/bio.12.202. [DOI] [PMC free article] [PubMed] [Google Scholar]
- 18.Majors RE. LCGC LC Column Technology Supplement. Agilent Technologies; 2006. Developments in HPLC Column Packing Design; pp. 8–15. [Google Scholar]
- 19.Wyndham KD, Walter TH, Iraneta PC, Neue UD, McDonald PD, Morrison D, Baynham M. A Review of Waters Hybrid Particle Technology. Part 2. Ethylene-Bridged [BEH Technology] Hybrids and Their Use in Liquid Chromatography. Waters Corporation; 2004. [Google Scholar]
- 20.Berg M, Vanaerschot M, Jankevics A, Cuypers B, Breitling R, Dujardin J-C. LC-MS metabolomics from study design to data-anlsysi—using a versatile pathogen as a test case. Comput Struct Biotechnol J. 2013;4:e201301002. doi: 10.5936/csbj.201301002. [DOI] [PMC free article] [PubMed] [Google Scholar]
- 21.Aretz I, Meierhofer D. Advantages and Pitfalls of Mass Spectrometry Based Metabolome Profiling in Systems Biology. Int J Mol Sci. 2016;17(5) doi: 10.3390/ijms17050632. pii:E632. [DOI] [PMC free article] [PubMed] [Google Scholar]
- 22.Moran NE, Rogers RB, Lu C-H, Conlon LE, Lila MA, Clinton SK, Erdman JW., Jr Biosythesis of highly enriched 13C-lycopene for human metabolomic studies using repeated batch tomato cell culturing with 13C-glucose. Food Chem. 2013;139(1–4):631–639. doi: 10.1016/j.foodchem.2013.01.016. [DOI] [PMC free article] [PubMed] [Google Scholar]
- 23.Cano PM, Jamin EL, Tadrist S, Bourdaud’hui P, Péans M, Debrauwer L, Oswald IP, Delaforge M, Puel O. New untargeted metabolic profiling combining mass spectrometry and isotopic labeling: application on Aspergillus fumigatus grown on wheat. Anal Chem. 2013;85(17):8412–8420. doi: 10.1021/ac401872f. [DOI] [PubMed] [Google Scholar]
- 24.Eisen MB, Spellman PT, Brown PO, Botstein D. Cluster analysis and display of genome-wide expression patterns. PNAS. 1998;95(25):14863–14868. doi: 10.1073/pnas.95.25.14863. [DOI] [PMC free article] [PubMed] [Google Scholar]
- 25.Beckonert O, Bollard ME, Ebbels TMD, Keun HC, Antii H, Holmes E, Lindon JC, Nicholson JK. NMR-based metabonomic toxicity classification: hierarchical cluster analysis and k-nearest-neighbor approaches. Anal Chim Acta. 2003;490(1–2):3–15. [Google Scholar]
- 26.Tikunov Y, Lommen A, de Vos CH, Verhoeven HS, Bino RJ, Hall RD, Bovy AGA. A novel approach for nontargeted data analysis for metabolomics: Large-scale profiling of tomato fruit volatiles. Plant Physiol. 2005;139(3):1125–1137. doi: 10.1104/pp.105.068130. [DOI] [PMC free article] [PubMed] [Google Scholar]
- 27.Pluskal T, Castillo S, Villar-Briones A, Orešič M. MZmine 2: modular framework for processing, visualizing, and analyzing mass spectrometry-based molecular profile data. BMC Bioinformat. 2010;11:395. doi: 10.1186/1471-2105-11-395. [DOI] [PMC free article] [PubMed] [Google Scholar]
- 28.Kvalheim OM, Karstang TV. Interpretation of latent-variable regression models. Chemom Intell Lab Syst. 1989;7:39–51. [Google Scholar]
- 29.Kvalheim OM, Chan H, Benzie IFF, Szeto Y, Tzang AH, Mok DK, Chau F. Chromatographic profiling and multivariate analysis for screening and quantifying the contributiosn from individual components to the bioactive signature in natural products. Chemom Intell Lab Syst. 2011;107:98–105. [Google Scholar]
- 30.Kaufman L, Rousseeuw PJ. Finding groups in data: An introduction to cluster analysis. New York: Wiley; 1990. [Google Scholar]
- 31.Keller BO, Sui J, Young AB, Whittal RM. Interferences and contaminants encountered in modern mass spectrometry. Anal Chim Acta. 2008;627(1):71–81. doi: 10.1016/j.aca.2008.04.043. [DOI] [PubMed] [Google Scholar]
- 32.Korman A, Oh A, Raskind A, Banks D. Statistical Methods in Metabolomics. Methods in Mol Biol. 2012;856:381–441. doi: 10.1007/978-1-61779-585-5_16. [DOI] [PubMed] [Google Scholar]
- 33.Kuehnbaum NL, Britz-McKibbin P. New advances in separation science for metabolomics: resolving chemical diversity in a post-genomic era. Chem Rev. 2013;113(4):2437–2468. doi: 10.1021/cr300484s. [DOI] [PubMed] [Google Scholar]
Associated Data
This section collects any data citations, data availability statements, or supplementary materials included in this article.


