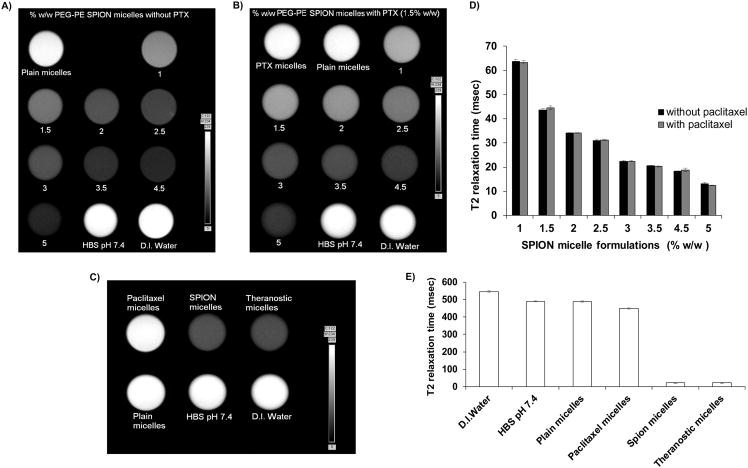
Figure 2. T2-weighted MR image and relaxation times.
MR imaging of contrast agent in the absence (A) and presence (B) of 1.5% w/w PTX during formulation optimization and their T2 relaxation times (D). T2-weighted MR images of 3% SPION-containing micelles and controls (C) along with their respective T2 relaxation times (E). MR images were obtained using a 7T Bruker magnet. T2 relaxation times were calculated using Paravision 5.0 software. (mean ± S.D., n=3).

