

Abstract
Background
HCV prevalence estimates among people who inject drugs (PWID) in Ukraine is high (60%-90%), yet barriers to HCV treatment and care remain substantial including limited access to direct acting antiviral (DAA) medications. A feasibility scale-up project implemented HCV treatment in community-based settings to improve access to DAA treatment for key populations in this context.
Methods
Using program-level data and verified medical records, we describe the development, implementation processes and outcomes for HCV treatment for PWID and other risks groups. Most participants (76%) received a combination of sofosbuvir, pegylated interferon, and ribavirin for 12 weeks. Treatment enrollment started in June 2015; the first two waves are reported. Data on demographics, HIV characteristics, HCV genotype and RNA levels, including sustained virologic response (SVR) were obtained from verified medical records. We used logistic regression to examine the independent correlates of achieving a SVR.
Results
The project was implemented in 19 healthcare institutions from 16 regions of Ukraine, mainly within AIDS specialty centers. Our analytical sample included 1,126 participants who were mostly men (73%) and the majority were HIV co-infected (79%). Treatment retention was 97.7% and the proportion of participants who achieved SVR for the 1,029 (91%) with complete data was 94.3% (95% CI 92.8%–95.7%). PWID who were currently injecting had comparable SVR rates (89.2%, 95% CI 81.5–94.5%) to PWID not injecting (94.4%, 95% CI 92.4–96.1), PWID on methadone (94.4%, 95%CI 92.4–96.1), and ‘other’ risk group (95.2%, 95% CI 91.3–97.7). Independent factors associated with achieving a SVR were females sex (AOR: 3.44, 95% CI 1.45–8.14), HCV genotype 3 (AOR: 4.57, 95% CI 1.97 - 10.59) compared to genotype 1. SVR rates in PWID actively injecting did not differ significantly from any other group.
Conclusion
Both patient-level and structural factors influence HCV treatment scale-up in Ukraine, but patient-level outcomes confirm high levels of achieving SVR in PWID, irrespective of injection and treatment status.
Introduction
Worldwide, hepatitis C virus (HCV) infection is the most prevalent chronic infectious disease affecting 150 million worldwide and over 19 million people in Europe (World Health Organization, 2016). Newer data, however, suggest this number to be lower (71.1 million) due to the revised estimates in Africa (Blach et al., 2017). Since 1990, HCV associated disability-adjusted life years have more than doubled and mortality continues to increase (Stanaway et al., 2016). People who inject drugs (PWID) account for most HCV cases in Eastern Europe and Central Asia with global prevalence of HCV among PWID exceeding 60% (Degenhardt et al., 2016).
Several prospective trials confirm high levels of efficacy and safety of treating HCV using direct-acting antiviral (DAA) medications in PWID receiving opioid agonist therapies (OAT) (Dore et al., 2016; Grebely, Dore, et al., 2016; Grebely, Mauss, et al., 2016), with sustained virological responses (SVR) approaching 96% (Grebely, Dore, et al., 2016). These studies suggest that active drug use during HCV treatment did not impact treatment outcomes (Grebely, Mauss, et al., 2016). Similarly, findings from longitudinal studies in real-world settings confirm these findings with no evidence of association between drug use and treatment non-adherence (Boglione et al., 2017; Mason et al., 2017; Read et al., 2017).
Despite evidence that HCV testing and treatment worldwide are increasing (Milne et al., 2015; Smith, Combellick, Jordan, & Hagan, 2015), PWID continue to lack access to effective treatment in low and middle-income settings (LMIC) (Harris, Albers, & Swan, 2015; Milne et al., 2015). Numerous system-level barriers continue to prevent PWID from receiving HCV treatment, including treatment cost, criminalization of drug use, restrictive treatment protocols, and stigma and discrimination in healthcare settings (Wolfe et al., 2015). To address such obstacles, several strategies have been recommended, including clinical training, outreach support, integrated and flexible treatment services, reduced medication costs, elimination of laws and regulations limiting PWID’s treatment access and retention (Bruggmann & Grebely, 2015; Wolfe et al., 2015).
Non-governmental organizations (NGOs) in Ukraine have been central to increasing access to HIV treatment, scaling-up HIV prevention and overcoming system-level barriers (Dutta et al., 2014; Dutta, Wirtz, Baral, Beyrer, & Cleghorn, 2012; Vitek et al., 2014), becoming a model for program development geared toward increasing access to HCV among PWID. Previous data also support the integration of HCV treatment within prevention and treatment services for PWID (Grebely et al., 2015; Sylla, Bruce, Kamarulzaman, & Altice, 2007), which has been crucial for overcoming barriers to HIV treatment.
Examination here describes the implementation process and assesses the treatment outcomes in an ongoing pilot project designed to expand access and overcome barriers to HCV treatment in Ukraine for the highest risk groups, focusing on several groups of PWID, including active and inactive injectors, those on OAT and other high risk groups.
Methods
The implementation process was guided by the theoretical framework “Promoting Action on Research Implementation” (PARiHS) (Damschroder et al., 2009; Stetler, Damschroder, Helfrich, & Hagedorn, 2011), and was shaped by knowledge of the social and epidemiological context, as well as institutional environments. The evidence for DAAs is substantial. These new medications have revolutionized HCV treatment by virtue of their high cure rates (>90%), tolerability, and shortened treatment duration. Prior to this project, their scale-up, however, has been hampered by their high cost and organizational structures and clinical practices that often exclude PWID from treatment.
Context
Ukraine, a middle-income country of 45 million people in Eastern Europe (World Populatin Review, 2016) is experiencing a volatile opioid injection epidemic with marked HIV and HCV transmission (UNODC, 2016). There are estimated 310,000 PWID in Ukraine (Alliance for Public Health, 2012), yet only 16% of PWID are officially registered by the government (Gural, Mariievskii, Siergieieva, Shaginian, & Kolos, 2008). Even though mandatory HCV reporting started in 2003 (Andrejczyn, Wasyliewa, & Gospodarski, 2005), a national HCV registry or official statistics on HCV prevalence are not available. WHO estimates that ~1.2 million people in Ukraine live with HCV, constituting 2.7% of the country’s population and home to Europe’s highest HCV prevalence (Ministry of Health of Ukraine, 2014). Available data on HCV prevalence among PWID in Ukraine remain limited, ranging from 62% to 86% (Alliance for Public Health, 2015; Dumchev et al., 2009; Luhmann et al., 2015). Ukraine’s National Program on Viral Hepatitis issued HCV treatment guidelines in 2013, initially focusing on interferon-based (IFN) regimens, but scale-up was slow. Ukraine’s new National Program aims to strengthen the overall health system, in particular the care for patients with viral hepatitis; improve strategies for medical and social assistance to Hepatitis B virus (HBV) and HCV patients; improve the system for training medical workers and infectious disease specialists; and increase diagnosis and access and treatment of viral hepatitis for the members of the general population. The program set an ambitious goal to provide treatment access for a minimum of 30% of the people in need of HCV treatment, including 50-60% of those comprising the highest risk groups, especially PWID. Achieving the stated goals has been challenging, as the government has not allocated sufficient funding to achieve this goal.
In reponse to the need to expand DAA treatment among PWID, a pilot project entitled “Scaling up Accessible and Effective HCV Treatment Through a Community-Based Treatement Model for Most Vulnerable Populations in Resource-Constrained Ukraine,” (henceforth, refered to as the “SAE-HCV”) was designed and initated. SAE-HCV deployed a community-involved treatment model with close collaboration between medical staff, representatives from NGOs and patients themselves. Similar strategies have documented effectiveness in providing HCV treatment for PWID (Bruggmann & Grebely, 2015; Bruggmann & Litwin, 2013). Moreover, SAE-HCV objectives and activities target patients from the most vulnerable populations, especially PWID, and align well with other aims set by the National Program.
Participant selection
Two oversight committees were involved, including the International Advisory Board (IAB) and the National Steering Committee (NSC). The IAB included a panel of international and national experts that met annually to provide guidance on the international standards of HCV screening and treatment and oversee the SAE-HCV strategy, outcomes and programmatic issues. The NSC, however, involved a panel of national experts who oversaw the project’s technical issues, including daily operations.
For example, the IAB provided the initial and ongoing guidance for the project, which was facilitated through project staff at Alliance for Public Health (APH) and incorporated into the project’s implementation guide (Alliance for Public Health, 2016a) with the following treatment prioritization guidelines: (1) confirmatory diagnosis of HCV or HIV/HCV co-infection (for first wave: 250 treatment courses), (2) fibrosis ≥ F2 by METAVIR (F3, F4 was the priority) including compensated cirrhosis or extrahepatic manifestations. Additionally, preference was given to (1) PWID who were currently clients of HIV harm-reduction programs (not less than 50% of patients), (2) PWID who were on opioid agonist therapies (OAT) like methadone or buprenorphine irrespective of their ongoing drug use, (3) HIV/HCV coinfected patients on antiretroviral treatment (ART), and (4) commercial sex workers and men who have sex with men (HCV mono or HIV/HCV co-infected). Potential participants could gain access to the program either directly through the medical facility, or be referred by an NGO for diagnosis and treatment. Initially the screening for treatment was offered to NGO clients, however, after more people learned about SAE-HCV from others, new participants contacted the program directly. Participants were ultimately selected by multi-disciplinary teams consisting of physicians, nurses and social workers from local NGOs serving PWID in medical settings within the geographic confines of SAE-HCV and approved by the NSC. Injecting drug use status was defined during the initial patient contact and screening by multi-disciplinary team members and recorded in the patient’s medical chart. Active drug injection was defined as report of at least 1 injection within last 30 days before the screening.
Participants were treated in 16 regions of Ukraine in 19 healthcare institutions and 15 non-governmental organizations provided implementation support for the project. Most (n=15; 79%) treating facilities were AIDS centers due to their interest in treating these patients and experience with PWID. Treatment initiation, based on the national guidelines, required the completion of a mandatory list of medical tests and confirmed no contraindications to treatment (which included pregnancy, active tuberculosis, underlying malignancies and stage 3-5 chronic kidney disease). Initially this process was exhaustive and costly for patients.
The choice of HCV treatment regimen was based on the National Unified Clinical Protocol: HCV in Adults (Ministry of Health of Ukraine, 2016) and SAE-HCV Implementation Guide’s, section Treatment Regimens, Indications and Usage, Precautions, Peculiarities of Treatment (Alliance for Public Health, 2016b), which were developed by the international experts. The IAB was convened before the project started and in between each wave to assess progress, provide guidance on next steps and to revise guidelines to improve implementation. Participants were enrolled over three waves, which operated from June 2015 till January 2016 (n=379), from February 2016 till February 2017 (n=830) and from March 2017 to present, respectively. This report examines 1,126 (93%) of the total 1,209 patients who initiated treatment and who have been observed for at least 12 weeks since the completion of treatment. Figure 1 describes how we achieved our analytical sample.
Figure 1. Flow Diagram for HCV Treatment Outcomes in Ukraine.
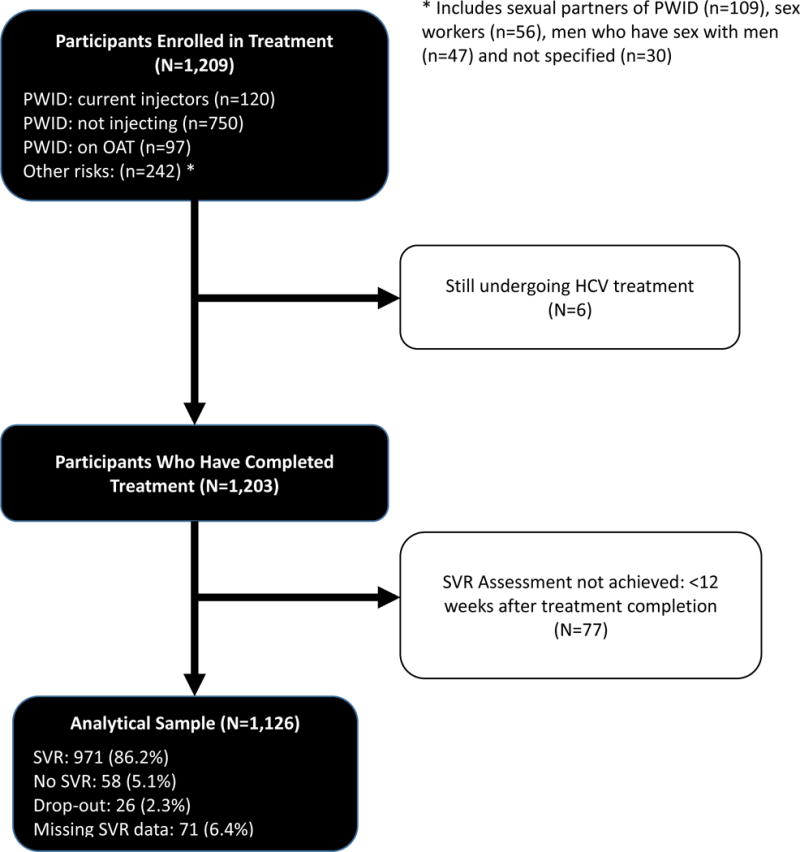
PWID: people who inject drugs, SVR: sustained virologic response.
Ethical Oversight
All study participants underwent standardized informed consent procedures and could terminate participation at any time. All study procedures were approved by the Medical Ethics Committee of the Gromashevskiy State Institute of Epidemiology and Infectious Diseases.
Model of Care and Implementation Plan
Social support with elements of case management was provided to all project participants through partnerships between clinics and local NGOs. NGOs oversaw the patient-level implementation of the project, as social workers from the NGO provided support to patients by helping them overcome barriers to treatment entry and monitor adherence to ensure treatment effectiveness. The NGO social workers organized meetings with potential participants, motivated them to complete medical examinations, provided them with information on drug safety and possible side effects, and scheduled all medical appointments. Once on treatment, the social workers scheduled individual counseling sessions and helped to develop individualized reminder systems to promote medication adherence and completion of laboratory diagnostics. Three information sessions on reinfection prevention were included as well as guidance on addressing relapse to or ongoing drug use. When patients dropped out, clinical staff contacted the patient or his relatives/partners to establish the reason. There were no cases of unidentified reason for dropout.
Data sources and measurement
The patient medical records were used for two distinct time-points: baseline and 12 weeks after the end of treatment when sustained virologic response (SVR) was measured. Each participant was assigned a unique code to protect the identity and ensure participant confidentiality. Outcome data from the medical records were collected retrospectively for wave 1 and prospectively for wave 2. Participant characteristics (age, sex, risk group), OAT enrollment, HIV infection, CD4 lymphocyte count, ART regimen, HCV genotype, and injecting drug use status were collected at baseline from the clinical database. Side effects were collected regularly during treatment from participants’ medical records and HCV RNA level confirmed SVR status 12 weeks after treatment completion, using AmpliSens® HCV-EPh PCR (Russia, Moscow). Treatment discontinuation was defined as medication discontinuation for more than 3 days, including those with missing SVR data. Missing HCV RNA to determine SVR was defined as not having a HCV RNA 12 weeks after the end of treatment.
Continuous variables included age and HCV RNA at baseline and 12 weeks after completing treatment. CD4 count was stratified as <350 (when ART is recommended) and ≥350 cells/mL for those with HIV and compared to a referent of those without HIV. HCV RNA was defined as international units (IU)/mL and was log-transformed for the convenience of comparison with the previous studies and for the logistic regression analysis log RNA was squared to approximate normal distribution. Categorical variables included sex and target group defined as (1) PWID: current injectors, (2) PWID: not injecting, (3) on OAT: injecting status unknown and (4) other risks: including sexual partners of PWID, MSM, CSW and others. HIV, HBV, and history of treatment with pegylated interferon (Peg-IFN) were defined as binary variables. The OAT variable was defined as either receiving methadone or buprenorphine at treatment initiation. HCV genotype variable included three types: 1, 2, 3 or other (4 and mixed infections). The small number of “other” were grouped with genotype 1 since treatment outcome was expected to be similar, resulting in 3 genotypic groupings. Although there were 8 possible DAA-containing treatment regimens that included SOF, we created 3 groups irrespective of treatment duration (12, 16 or 24 weeks) and inclusion of RBV: (1) SOF/DCV±RBV; (2) SOF/RBV; and (3) SOF/RBV/Peg-IFN (referent used in analysis).
The primary outcome, achieving a SVR, was defined as achieving HCV RNA levels <50 HCV RNA IU/mL 12 weeks after treatment completion, except in 4 cases where the limit of detection was <150 IU/mL. A cut-off threshold was selected based on the sensitivity of the HCV RNA test used. Secondary outcomes of interest also included rate of treatment drop-out and percent of missing SVR.
Statistical methods
Fisher’s exact test was used to compare the frequencies of categorical variables, while t-test was used to compare the means of continuous variables. Both intention-to-treat (ITT) and modified intention-to-treat (mITT) analyses were performed. For the ITT analysis, we used the entire sample (N=1,126) and conservatively defined missing SVR data and drop-out as failure (i.e., RNA>50 IU/mL). For the mITT analysis, however, missing SVR data (9%) was excluded and analyzed for 1,029 participants. Additionally, we checked potential predictors of missing SVR data using logistic regression. The predictors of achieving SVR did not differ appreciably between the two groups and the mITT analysis is presented.
Multivariable logistic regressions were used to analyze potential association between explanatory variables and the main outcome (SVR) among mITT population (n=1,029). To avoid selection based on p-values and multiple testing, the final model was selected based on the best subsets variable selection according to the Bayesian information criterion (BIC). The final model fit was checked using goodness-of-fit Hosmer-Lemeshow test (Hosmer, Lemeshow, & Klar, 1988). Statistical analyses were performed using STATAv.14 (2014).
Results
Organizational and Structural Implementation Outcomes
In addition to the implementation plan described in the methods, Table 1 provides key components leading up to participant treatment in SAE-HCV. In late 2015, the DAA sofosbuvir (SOF) became available on the national formulary, which allowed procurement from the state budget (Ministry of Health of Ukraine, 2016). Advocacy efforts resulted in procurement of HCV treatment with SOF at a reduced cost for 1,500 HCV treatment courses for high risk groups, and the local implementation team in APH was equipped to scale-up HCV treatment through this project. Key milestones were achieved as part of the implementation process: development and modification of the National Protocol for both procurement of DAAs and National Treatement Guidelines that were endorsed by the Ukrainian Ministry of Health. These milestones were crucial to allow patients to utlimately be treated since healthcare organization is guided by the Ministry of Health directives.
Table 1.
Key Implementation Strategies and Components for Increasing Access to HCV Treatment for PWID in Ukraine
| Key components | Milestones | Time Frame |
|---|---|---|
| HCV testing | Adding rapid HCV testing to the standard prevention services package for most vulnerable populations. | September 2009 |
|
| ||
| Advocacy | Advocacy campaign to increase access to HCV treatment included high profile meetings with main stakeholders at the national level and discussions of designing national HCV program. | March-May 2012 |
| Negotiations with nationwide laboratory network on price reductions for HCV lab diagnostics | December 2013 – February 2014 | |
| Price reduction negotiations for PEG/RBV and DAA sofosbuvir | ||
|
| ||
| Development of National Program and Guidelines | Approval of National Hepatitis Program by Ministry of Health with allocated funding | April 2013 |
| IFN-based regimens included in HCV treatment National Clinical Guidelines | October 2013 | |
| DAA sofosbuvir included in revised National Clinical Guidelines on HCV Treatment in Adults | July 2015 | |
| DAA sofosbuvir added into nomenclature for procurement at national level | October 2015 | |
|
| ||
| HCV treatment projects | Provision of HCV treatment (PEG/RBV) to HIV-positive patients enrolled in OAT programs | May 2014 – May 2015 |
| Community-involved HCV treatment model using DAA-based regimens (presented project) | ||
|
| ||
| International Advisory board | Comprised of international HCV treatment experts from the European Union, United States, Israel, and Australia and included international organizations like European Association for the Study of Liver, World Health Organization, and U.S. Centers for Disease Control and Prevention | February 2015 |
HCV: Hepatitis C virus; PWID: people who inject drugs; IFN: interferon; PEG: pegylated interferon; RBV: ribavirin; OAT: opioid agonist treatment; DAA: direct-acting antiviral.
Community NGOs were involved locally in identification and referral of potential participants, development of individualized treatment adherence plans, and collaboration with multidisciplinary teams to maximize treatment outcomes. Their involvement fostered an enabling environment to overcome existing system-level barriers (Harris et al., 2015). During these meetings, important patient-level and provider-level barriers were addressed. From the patient perspective, these barriers were related to expensive laboratory diagnostics and costs of commuting to the clinic, myths among patients regarding low effectiveness of new regimens, likelihood of fatality and adverse side effects, and fears that patients are experimented on. The model of care provision allowed social workers to address prevalent myths among patients and provide accurate data about the project’s aims and results of previous research on HCV treatment with DAA. Moreover, their reports to the national implementing team were used to influence structural factors.
Structural factors were addressed in two ways. First, local team leaders from the implementing agency (APH) regularly communicated with clinical and NGO partners to identify and assist with overcoming local barriers. APH also provided feedback to the IAB who met quarterly via teleconferencing and annually in person. The international experts provided ongoing guidance in developing and maintaining the HCV treatment protocols, as well technical support to the local team leaders through regularly scheduled discussions and meetings. During Wave I, when local NGOs observed that the out-of-pocket expenses for diagnostic testing was the major impediment to the uptake, the implementing agency subsidized 50% of the costs. At the end of Wave I, when enrollment was observed to be slow, this committee reduced the unnecessary tests and frequency of testing, which in turn reduced costs, to improve treatment uptake.
Patient-Level Treatment outcomes
Baseline participants’ characteristics stratified by wave of enrollment are presented in Table 2. Participants were mostly men (73%) with a mean age of 40 years. Our sample included PWID: currently injectors (10%), PWID: not injecting (62%), on opioid agonist treatment (OAT): injecting status unknown (8%), and those with other risks (20%). Most participants (76%) received a combination of SOF/PEG/RBV for 12 weeks. SVR data were available for 1,029 participants (91%) from our analytical sample. Table 3 provides participants’ characteristics stratified by SVR status. Participants who did not achieve SVR were more likely to be male, currently injecting, were HIV-infected with higher CD4 counts at baseline, more likely to have HCV genotype 1 and less likely to be treated with SOF+Peg-IFN+RBV. Figure 2 provides point estimates and 95% CI for the primary treatment outcome (SVR) by risk category for both the ITT and mITT analyses. Using more conservative strategy of coding missing=failure (ITT), including for participants who dropped out, the overall SVR was 86.2% (95% CI 84.08%–88.19%, data not shown). Restricting data only for those who had SVR data available (mITT), the proportion of participants who achieved SVR was 94.4% (95% CI 92.8%-95.7%, data not shown). Examination of missing SVR data suggested that older participants and those treated with SOF+RBV were more likely to have missing SVR data, while participants with higher CD4 counts, genotype 2 (vs genotype 1 and other) and prior treatment with Peg-IFN were less likely to have missing SVR data. Attrition from the treatment was low (2.31%; n=26), mostly related to adverse side effects (38.5%; n=10) and disinterest in continuing treatment (30.8%; n=8).
Table 2.
Analytic Sample Characteristics, Stratified by Wave of Enrollment
| Characteristic | Analytical sample N= 1,126 |
Wave 1 N= 379 (34%) |
Wave 2 N=747 (66%) |
P-value |
|---|---|---|---|---|
| Mean age, years (SD) | 40 (7.0) | 39 (6.1) | 40 (7.4) | 0.004‡ |
| Sex | 0.777Ұ | |||
| Female | 303 (27) | 104 (27) | 199 (27) | |
| Male | 823 (73) | 275 (73) | 548 (73) | |
| Drug risk groups | ||||
| PWID: current injectors | 116 (10) | 11 (3) | 105 (14) | <0.001 |
| PWID: not injecting | 697 (62) | 261 (69) | 436 (58) | |
| On OAT: injecting unknown | 88 (8) | 28 (7) | 60 (8) | |
| Other risks | 225 (20) | 79 (21) | 146 (20) | |
| HIV | ||||
| HIV negative | 240 (21) | 12 (3) | 228 (31) | <0.001 |
| HIV positive: CD4<350 | 202 (18) | 72 (19) | 130 (17) | |
| HIV positive: CD4≥350 | 681 (60) | 294 (78) | 387 (52) | |
| Hepatitis B Ag positive | 0.243 | |||
| Yes | 109 (10) | 30 (8) | 79 (11) | |
| No | 1, 016 (90) | 349 (92) | 667 (89) | |
| Type of OAT (N=88) | ||||
| Methadone | 62(6) | 20 (5) | 42 (6) | 0.947 |
| Buprenorphine | 26 (2) | 8 (2) | 18 (2) | |
| HCV genotype | ||||
| 1 | 560 (50) | 169 (45) | 391 (52) | 0.007 |
| 2 | 54 (5) | 28 (7) | 26 (3) | |
| 3 | 501 (44) | 179 (47) | 322 (43) | |
| Other | 11 (1) | 3 (0.8) | 9 (1) | |
| Mean log HCV viral load at baseline (IQR) | 13.5 (12.3-15.0) | 13.9 (12.3-15.1) | 13.5 (12.3-14.9) | 0.571 |
| History of previous HCV treatment with Peg-IFN | 0.709 | |||
| Yes | 148 (13) | 52 (14) | 96 (13) | |
| No | 978 (87) | 327 (86) | 651 (87) | |
| HCV treatment regimen | ||||
| SOF+DCV ± RBV (12W or 24 W) | 43 (4) | 1 (0.2) | 42 (5) | <0.001 |
| SOF+Peg-IFN+RBV 12W | 855 (76) | 289 (76) | 566 (76) | |
| SOF+RBV (12W, 16W, or 24W) | 228 (20) | 89 (23) | 139 (19) |
: for continuous variables p-value is for the t-test comparing Wave 1 and Wave 2;
: p-value is for Fisher’s exact test for the independence of rows and all the columns; HCV: Hepatitis C virus; PWID: people who inject drugs; OAT: opioid agonist treatment; SD: standard deviation; IQR: interquartile range; Peg-IFN: pegylated interferon SOF: sofosbuvir; RBV: ribavirin; DCV: daclatasvir; W: weeks; log HCV viral load – log transformed HCV viral load.
Table 3.
Participants Characteristics, Stratified by Sustained Virologic Response (N=1,126)
| Characteristic | Analytical sample n=1,126 (100%)§ |
No SVR n=58 (5%)† |
SVR n=971 (86%)† |
No data on SVR N=97 (9%)† |
P-value |
|---|---|---|---|---|---|
| Mean age, years (SD) | 40 (7.0) | 41 (7.7) | 39 (7.0) | 41 (7.6) | 0.059‡ |
| Sex | |||||
| Female | 303 (27) | 6 (2) | 269 (89) | 28 (9) | 0.008 Ұ |
| Male | 823 (73) | 52 (6) | 702 (85) | 69 (8) | |
| Risk categories | |||||
| PWID: current injectors | 116 (10) | 11 (10) | 91 (78) | 14 (12) | 0.003 |
| PWID: not injecting | 697 (62) | 36 (5) | 611 (88) | 50 (7) | |
| On OAT: injecting unknown | 88 (8) | 1 (1) | 71 (81) | 16 (18) | |
| Other risks | 225 (20) | 10 (4) | 198 (88) | 17 (8) | |
| Wave | <0.001 | ||||
| 1st | 379 (34) | 23 (6) | 346 (91) | 10 (3) | |
| 2nd | 747 (66) | 35 (5) | 625 (84) | 87 (11) | |
| HIV status | 0.031 | ||||
| HIV negative | 240 (21) | 12 (5) | 200 (83) | 28 (12) | |
| HIV positive: CD4<350 | 202 (18) | 7 (3) | 177 (88) | 18 (9) | |
| HIV positive: CD4≥350 | 681 (60) | 39 (6) | 593 (87) | 49 (7) | |
| Hepatitis B Ag positive | 0.690 | ||||
| Yes | 109 (10) | 5 (5) | 92 (84) | 12 (11) | |
| No | 1,016 (90) | 53 (5) | 878 (87) | 85 (8) | |
| HCV genotype | <0.001 | ||||
| 1 | 560 (50) | 39 (7) | 486 (87) | 35 (6) | |
| 2 | 54 (5) | 8 (15) | 44 (81) | 2 (4) | |
| 3 | 501 (44) | 11 (2) | 430 (86) | 60 (12) | |
| Other | 11 (1) | 0 (0) | 11 (1) | 0 (0) | |
| Mean log HCV viral load at baseline (IQR) | 13.5 (12.3-15.0) | 14.2 (13.1 – 15.4) | 13.5 (12.3 – 15.0) | 13.4 (12.2 – 14.7) | 0.018 |
| History of previous HCV treatment with Peg-IFN | |||||
| Yes | 148 (13) | 13 (9) | 130 (88) | 5 (3) | 0.005 |
| No | 978 (87) | 45 (5) | 841 (86) | 92 (9) | |
| HCV treatment regimen | |||||
| SOF+DCV ± RBV (12W or 24W) | 43 (4) | 1 (2) | 40 (93) | 2 (5) | <0.001 |
| SOF+Peg-IFN+RBV 12W | 855 (76) | 42 (5) | 756 (88) | 57 (7) | |
| SOF+RBV (12W, 16W, or 24W) | 228 (20) | 15 (6) | 175 (77) | 38 (17) |
: percentages are in columns;
: percentages are in rows;
: for continuous variables p-value is for the t-test comparing SVR and noSVR;
: p-value is for Fisher’s exact test for the independence of rows and all the columns; SVR: sustained virologic response; HCV: Hepatitis C virus; PWID: people who inject drugs; OAT: opioid agonist treatment; SD: standard deviation; IQR: interquartile range; Peg-IFN: pegylated interferon SOF: sofosbuvir; RBV: ribavirin; DCV: daclatasvir; W: weeks.
Figure 2. Sustained Virologic Response in Patient Treatment Groups.
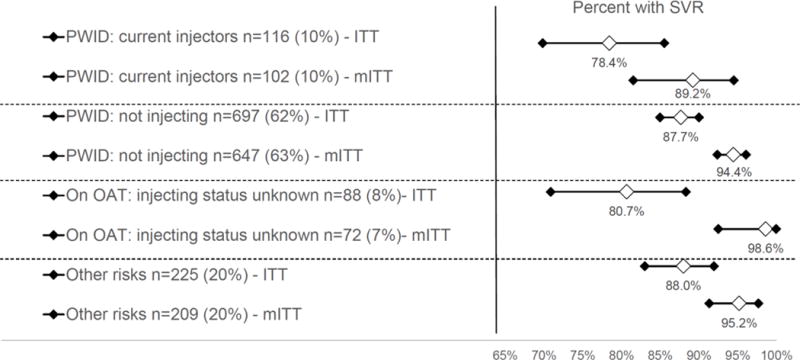
SVR: sustained virologic response; PWID: people who inject drugs; OAT: opioid agonist treatment; ITT: intent to treat analysis; mITT: modified intent to treat analysis
Table 4 presents independent factors associated with achieving a SVR in the mITT population (n=1,029), which did not differ appreciably from the ITT analysis (data not shown). In the final model, being females (AOR: 3.4 95% CI 1.45 – 8.14) and having genotype 3 (AOR: 4.57, 95% CI 1.97 – 10.59), relative to the genotype 1 group, were significantly associated with achieving a SVR. Importantly, HIV status, being an active injector or prescribed OAT and having chronic hepatitis B virus were not associated with achieving a SVR.
Table 4.
Independent Correlates for Achieving a Sustained Virologic Response in Participants with HCV RNA Results (N=1,029)
| Variable | Unadjusted OR | 95% CI | p-value | Adjusted OR | 95% CI | p-value |
|---|---|---|---|---|---|---|
| Age, years | 0.96 | 0.93 – 1.01 | 0.059 | |||
| Sex | ||||||
| Male | 1.00 | |||||
| Female | 3.32 | 1.41 – 7.82 | 0.006 | 3.44 | 1.45 – 8.14 | 0.005 |
| Risk categories | ||||||
| Other risks | 1.00 | |||||
| PWID: current injectors | 0.42 | 0.17-1.02 | 0.055 | |||
| PWID: not injecting | 0.86 | 0.42 - 1.76 | 0.674 | |||
| On OAT: injecting unknown | 3.59 | 0.45 - 28.51 | 0.227 | |||
| Squared log HCV viral load at baseline | 0.99 | 0.98 – 0.99 | 0.021 | |||
| HIV status | ||||||
| HIV negative | 1.00 | |||||
| HIV positive: CD4<350 | 1.52 | 0.58-3.94 | 0.392 | |||
| HIV positive: CD4≥350 | 0.91 | 0.47-1.78 | 0.787 | |||
| HCV genotype* | ||||||
| 1 | 1.00 | |||||
| 2 | 0.43 | 0.19-0.98 | 0.045 | 1.04 | 0.29 – 3.71 | 0.950 |
| 3 | 3.07 | 1.55-6.06 | 0.001 | 4.57 | 1.97 – 10.59 | <0.001 |
| Previous Treatment with Peg-IFN | ||||||
| No | 1.00 | |||||
| Yes | 0.54 | 0.28-1.02 | 0.057 | |||
| HCV treatment regimen | ||||||
| SOF+DCV ± RBV (12W or 24W) | 1.00 | |||||
| SOF+Peg-IFN+RBV (12W) | 0.45 | 0.06-3.35 | 0.436 | 0.44 | 0.06-3.29 | 0.42 |
| SOF+RBV (12W, 16W, or 24W) | 0.29 | 0.03-2.27 | 0.240 | 0.17 | 0.02-1.56 | 0.12 |
SVR: sustained virologic response; HCV: Hepatitis C virus; PWID: people who inject drugs; OAT: opioid agonist treatment; Peg-IFN: pegylated interferon SOF: sofosbuvir; RBV: ribavirin; DCV: daclatasvir; W: weeks;
other HCV category was too small to include in the analysis.
Discussion
HCV treatment scale-up occurred through a progressive process that first began with HCV diagnosis by using targeted and free testing strategies for PWID and their partners. Testing, the first step in the HCV treatment continuum (Meyer et al., 2015), was implemented initially to raise awareness about the scope of HCV epidemic in Ukraine and especially among PWID. After awareness was raised, advocacy efforts targeted HCV treatment costs through efforts to negotiate lower medication prices and leverage political commitment that would enable the program to provide HCV treatment with DAA among PWID. Even though national treatment guidelines do not guarantee that PWID will be included in treatment scale-up efforts (Luhmann et al., 2015), community involvement was crucial to advocate on their behalf throughout the process. Despite extensive advocacy, PWID who were not actively injecting drugs were primarily enrolled in the project. A recent study of PWID on OAT, but for whom the majority had urine drug testing that was positive for active drug use throughout treatment, reported high levels (>90%) of SVR (Dore et al., 2016). Although a large HCV elimination project that is receiving massive amounts of external funding is underway in Georgia (Gvinjilia et al., 2016), to our knowledge, this is the largest real-world implementation assessment of HCV treatment of PWID in Eastern Europe and Central Asia. Unlike the HCV elimination project in Georgia where occupationally-exposed persons and those with advanced liver disease were treated first, SVR rates in our sample were 86%, compared to 82% in Georgia. Previous studies of HCV treatment among PWID with DAA have reported that SVR rates exceed 90% (Boglione et al., 2017; Martin et al., 2013; Mason et al., 2017; Read et al., 2017), which is similar to what we found in Ukraine.
Moreover, our sample had very low attrition and, most importantly, comparable SVR rates between PWID who currently inject, PWID who do not currently inject, PWID who are on OAT, and other high risk groups. These finding support other smaller studies where there was no association between drug use and treatment completion, adherence, and treatment outcomes (Grebely, Mauss, et al., 2016; Mason et al., 2017; Read et al., 2017), but ours further disaggregated the PWID subcategories. Although we were unable to retrieve data on injecting status of those in ‘other’ risks group, there is potential for misclassification due to measurement error in the self-reported risk status among participants of the ASE-HCV, as a recent study by Cakalo (2015) demonstrated that case registration in Ukraine may underestimate the number of HIV cases acquired through unsafe injection practices due to stigmatization of key populations and underreporting of injecting status.
Further, these findings most likely represent the closest approximation to the expected treatment outcomes when scale-up of HCV treatment programs would be implemented at a national level. Our findings strongly speak to the implementation outcomes such as acceptability, adoption and feasibility of HCV treatment among PWID in LMIC (Peters, Tran, & Adam, 2014).
We attribute success of ASE-HCV to both the efficacy and tolerability of DAA treatment regimens and the community-involved treatment model which promoted adherence to treatment over the entire observation period. For example, treatment dropout was low, mostly from adverse side effects, even with majority of our participants being HIV-infected and eligible for ART (Kirk et al., 2013; Smith et al., 2015). Regarding the community-involved treatment model, while we were unable to stratify patients by the level (e.g., dose) of community-involved treatment provided, our findings support incorporating this model within the HCV treatment delivery system for PWID and non-PWID. Like the case of HIV, a meta-analysis of ART adherence in PWID suggests that adherence levels of active PWID are not reduced, especially when ongoing adherence support is provided (Malta, Magnanini, Strathdee, & Bastos, 2010). Even though active PWID accounted for only 10% of the participants, findings here should assure clinicians that such patients can achieve similar SVR outcomes. Moreover, integration of HCV treatment with harm reduction efforts and OAT sites, and inclusion of partners of PWID, those who inject but do not identify themselves as PWID and are not associated with NGO, may address the high risk of transmission of HCV and re-infection.
While the treatment scale-up pilot program prioritized PWID with at least moderate hepatitis fibrosis, an alternative strategy would be focus on active PWID and those early in their injection trajectories since recent modeling studies examining HCV treatment as prevention strategies suggest that prioritizing these target populations for treatment will yield the highest reductions in HCV transmission (Martin et al., 2013). Treatment as prevention strategies, however, are less likely to be effective in patients who are no longer injecting (Grebely, Matthews, Lloyd, & Dore, 2013).
Despite the important findings from this HCV pilot treatment program among PWID in Ukraine, this study is not without limitations. First, our data were obtained from medical records, which may introduce measurement error. Additionally, while less than 10% of participants were missing SVR data, even our most conservative assessment where missing equals failure yields optimistic outcomes. Similar to other studies where SVR rates were high, achieving a ceiling threshold, there were challenges comparing variables in those achieving and not achieving SVR, although the larger sample here in part overcomes this limitation. Nevertheless, real-world data reflect outcomes that would be observed if the program was effectively scaled-up at the national level. Second, despite the pilot program being implemented in 16 regions of Ukraine, data may not be fully representative for the entire country and all vulnerable populations. These 16 regions, however, represent those with the most PWID and highest HIV prevalence in the country. Given the high demand for HCV treatment and scarcity of resources among most vulnerable populations, participants selection may have favored highly motivated, visible and proactive participants with access to financial resources to subsidize laboratory testing, especially during the initial wave. The large sample size and the larger second wave when there was a shift in the profile of patients, however, partially reduces these concerns. Third, we were limited in our selection of variables and could not account for potential explanatory variables that might have contributed to outcomes, such as cirrhosis status, housing status, addiction severity or other cofactors that can undermine treatment outcomes in PWID. The remarkably high SVR rate, however, makes such variables less likely to overcome treatment variables. Finally, there are no data available on reinfection rates among participants, which would be important for incorporating harm reduction strategies like OAT and needle/syringe programs among patients who receive HCV treatment. Nonetheless, such harm reduction strategies should be recommended and made available to reduce reinfection since substance use disorders are chronic, relapsing conditions.
The ASE-HCV provides a helpful implementation strategy for scaling up HCV treatment in a resource-limited setting and demonstrates that HCV treatment is feasible and highly efficacious. Full implementation, however, will need to address patient-level and program-level factors to optimize treatment outcomes. Patient-level factors will include attitudes toward treatment and circumstances that influence covering medical testing costs, while program-level factors should focus on costs for HCV treatment and making screening, monitoring and treatment more accessible, including provision of primary are and addiction treatment. Nonetheless, SVR rates were extraordinarily high in PWID and new strategies should focus on PWID who are actively injecting, which so far had contributed to a small proportion of those treated in Ukraine. HCV treatment scale-up with DAA in Ukraine and other countries in the region will require substantial price reductions in medications, governmental commitment and organized efforts of stakeholders to overcome structural and program barriers.
References
- Alliance for Public Health. Analitical Report “Results of Sociological Research: Estimation of the size of high risk groups for HIV transmission in Ukraine in 2011”. Kyiv: ICF “Alliance for Public Health”; 2012. [Google Scholar]
- Alliance for Public Health. Monitoring of Behavior and HIV Prevalence in People Who Inject Drugs and Their Sexual Partners in Ukraine. Alliance for Public Health; 2015. http://aph.org.ua/wp-content/uploads/2015/09/Monitoryng-povedinky-SIN_PROEKT.pdf. [Google Scholar]
- Alliance for Public Health. HCV treatment project in Ukraine. Scaling up Accessible and Effective HCV Treatment Through a Community-Based Treatment Model for Most Vulnerable Populations in Resource-Constrained Ukraine. 2016a Retrieved April 24, 2017, from http://aph.org.ua/wp-content/uploads/2016/07/HCVtreatment.pdf.
- Alliance for Public Health. Scaling up Accessible and Effective HCV Treatment Through a Community-Based Treatment Model for Most Vulnerable Populations in Resource-Constrained Ukraine. Projects. 2016b Retrieved April 24 2017, from http://aph.org.ua/en/our-works/ukraine/scaling-up-accessible-and-effective-hcv-treatment-through-community-based-treatment-model-for-most-vulnerable-populations-in-the-resource-constrained-ukraine/
- Andrejczyn M, Wasyliewa N, Gospodarski I. Some aspects of epidemiology of HCV infections in Ukraine. Przegl Epidemiol. 2005;59(2):499–501. [PubMed] [Google Scholar]
- Blach S, Zeuzem S, Manns M, Altraif I, Duberg AS, Muljono DH, Razavi H. Global prevalence and genotype distribution of hepatitis C virus infection in 2015: a modelling study. The Lancet Gastroenterology & Hepatology. 2017;2(3):161–176. doi: 10.1016/s2468-1253(16)30181-9. [DOI] [PubMed] [Google Scholar]
- Boglione L, Mornese Pinna S, De Nicolo A, Cusato J, Cariti G, Di Perri G, D’Avolio A. Treatment with direct-acting antiviral agents of hepatitis C virus infection in injecting drug users: A prospective study. J Viral Hepat. 2017 doi: 10.1111/jvh.12711. [DOI] [PubMed] [Google Scholar]
- Bruggmann P, Grebely J. Prevention, treatment and care of hepatitis C virus infection among people who inject drugs. Int J Drug Policy. 2015;26(Suppl 1):S22–26. doi: 10.1016/j.drugpo.2014.08.014. [DOI] [PubMed] [Google Scholar]
- Bruggmann P, Litwin AH. Models of care for the management of hepatitis C virus among people who inject drugs: one size does not fit all. Clin Infect Dis. 2013;57(Suppl 2):S56–61. doi: 10.1093/cid/cit271. [DOI] [PMC free article] [PubMed] [Google Scholar]
- Čakalo JI, Božičević I, Vitek C, Mandel JS, Salyuk T, Rutherford GW. Misclassification of men with reported HIV infection in Ukraine. AIDS Behav. 2015;19(10):1938–1940. doi: 10.1007/s10461-015-1112-0. [DOI] [PubMed] [Google Scholar]
- Damschroder LJ, Aron DC, Keith RE, Kirsh SR, Alexander JA, Lowery JC. Fostering implementation of health services research findings into practice: a consolidated framework for advancing implementation science. Implement Sci. 2009;4:50. doi: 10.1186/1748-5908-4-50. [DOI] [PMC free article] [PubMed] [Google Scholar]
- Degenhardt L, Charlson F, Stanaway J, Larney S, Alexander LT, Hickman M, Vos T. Estimating the burden of disease attributable to injecting drug use as a risk factor for HIV, hepatitis C, and hepatitis B: findings from the Global Burden of Disease Study 2013. Lancet Infect Dis. 2016;(16):30325–5. doi: 10.1016/s1473-3099. [DOI] [PubMed] [Google Scholar]
- Dore GJ, Altice F, Litwin AH, Dalgard O, Gane EJ, Shibolet O, Group, C. E. C.-S. S. Elbasvir-Grazoprevir to Treat Hepatitis C Virus Infection in Persons Receiving Opioid Agonist Therapy: A Randomized Trial. Ann Intern Med. 2016;165(9):625–634. doi: 10.7326/M16-0816. [DOI] [PubMed] [Google Scholar]
- Dumchev KV, Soldyshev R, Qian HZ, Zezyulin OO, Chandler SD, Slobodyanyuk P, Schumacher JE. HIV and hepatitis C virus infections among hanka injection drug users in central Ukraine: a cross-sectional survey. Harm Reduct J. 2009;6:23. doi: 10.1186/1477-7517-6-23. [DOI] [PMC free article] [PubMed] [Google Scholar]
- Dutta Perales N, Semeryk O, Balakireva O, Aleksandrina T, Ieshchenko O, Zelenska M. Lives on the line. Funding needs and impacts of Ukraines national HIV/AIDS program 2014-2018 2014 [Google Scholar]
- Dutta Wirtz AL, Baral S, Beyrer C, Cleghorn FR. Key harm reduction interventions and their impact on the reduction of risky behavior and HIV incidence among people who inject drugs in low-income and middle-income countries. Curr Opin HIV AIDS. 2012;7(4):362–368. doi: 10.1097/COH.0b013e328354a0b5. [DOI] [PubMed] [Google Scholar]
- Grebely J, Bruggmann P, Treloar C, Byrne J, Rhodes T, Dore GJ. Expanding access to prevention, care and treatment for hepatitis C virus infection among people who inject drugs. International Journal of Drug Policy. 2015;26(10):893–898. doi: 10.1016/j.drugpo.2015.07.007. http://dx.doi.org/10.1016/j.drugpo.2015.07.007. [DOI] [PubMed] [Google Scholar]
- Grebely J, Dore GJ, Zeuzem S, Aspinall RJ, Fox R, Han L, Feld JJ. Efficacy and Safety of Sofosbuvir/Velpatasvir in Patients With Chronic Hepatitis C Virus Infection Receiving Opioid Substitution Therapy: Analysis of Phase 3 ASTRAL Trials. Clinical Infectious Diseases. 2016;63(11):1479–1481. doi: 10.1093/cid/ciw579. [DOI] [PMC free article] [PubMed] [Google Scholar]
- Grebely J, Matthews GV, Lloyd AR, Dore GJ. Elimination of Hepatitis C Virus Infection Among People Who Inject Drugs Through Treatment as Prevention: Feasibility and Future Requirements. Clinical Infectious Diseases. 2013;57(7):1014–1020. doi: 10.1093/cid/cit377. [DOI] [PubMed] [Google Scholar]
- Grebely J, Mauss S, Brown A, Bronowicki JP, Puoti M, Wyles D, Dore GJ. Efficacy and Safety of Ledipasvir/Sofosbuvir With and Without Ribavirin in Patients With Chronic HCV Genotype 1 Infection Receiving Opioid Substitution Therapy: Analysis of Phase 3 ION Trials. Clinical Infectious Diseases. 2016;63(11):1405–1411. doi: 10.1093/cid/ciw580. [DOI] [PubMed] [Google Scholar]
- Gural L, Mariievskii V, Siergieieva T, Shaginian V, Kolos L. Hepatitis C in Ukraine: Epidemiological Aspects of the Issue. Modern Infections. 2008:53–63. [Google Scholar]
- Gvinjilia L, Nasrullah M, Sergeenko D, Tsertsvadze T, Kamkamidze G, Butsashvili M, Averhoff F. National Progress Toward Hepatitis C Elimination - Georgia, 2015-2016. MMWR Morb Mortal Wkly Rep. 2016;65(41):1132–1135. doi: 10.15585/mmwr.mm6541a2. [DOI] [PubMed] [Google Scholar]
- Harris M, Albers E, Swan T. The promise of treatment as prevention for hepatitis C: Meeting the needs of people who inject drugs? International Journal of Drug Policy. 2015;26(10):963–969. doi: 10.1016/j.drugpo.2015.05.005. [DOI] [PubMed] [Google Scholar]
- Hosmer DW, Lemeshow S, Klar J. Goodness-of-Fit Testing for the Logistic Regression Model when the Estimated Probabilities are Small. Biometrical Journal. 1988;30(8):911–924. doi: 10.1002/bimj.4710300805. [DOI] [Google Scholar]
- Kirk GD, Mehta SH, Astemborski J, Galai N, Washington J, Higgins Y, Thomas DL. HIV, age, and the severity of hepatitis C virus-related liver disease: a cohort study. Ann Intern Med. 2013;158(9):658–666. doi: 10.7326/0003-4819-158-9-201305070-00604. [DOI] [PMC free article] [PubMed] [Google Scholar]
- Luhmann N, Champagnat J, Golovin S, Maistat L, Agustian E, Inaridze I, Bouscaillou J. Access to hepatitis C treatment for people who inject drugs in low and middle income settings: Evidence from 5 countries in Eastern Europe and Asia. International Journal of Drug Policy. 2015;26(11):1081–1087. doi: 10.1016/j.drugpo.2015.07.016. [DOI] [PubMed] [Google Scholar]
- Malta M, Magnanini MM, Strathdee SA, Bastos FI. Adherence to antiretroviral therapy among HIV-infected drug users: a meta-analysis. AIDS Behav. 2010;14(4):731–747. doi: 10.1007/s10461-008-9489-7. [DOI] [PubMed] [Google Scholar]
- Martin NK, Vickerman P, Grebely J, Hellard M, Hutchinson SJ, Lima VD, Hickman M. Hepatitis C virus treatment for prevention among people who inject drugs: Modeling treatment scale-up in the age of direct-acting antivirals. Hepatology. 2013;58(5):1598–1609. doi: 10.1002/hep.26431. [DOI] [PMC free article] [PubMed] [Google Scholar]
- Mason K, Dodd Z, Guyton M, Tookey P, Lettner B, Matelski J, Powis J. Understanding real-world adherence in the directly acting antiviral era: A prospective evaluation of adherence among people with a history of drug use at a community-based program in Toronto, Canada. Int J Drug Policy. 2017 doi: 10.1016/j.drugpo.2017.05.025. [DOI] [PubMed] [Google Scholar]
- Meyer JP, Moghimi Y, Marcus R, Lim JK, Litwin AH, Altice FL. Evidence-based interventions to enhance assessment, treatment, and adherence in the chronic Hepatitis C care continuum. Int J Drug Policy. 2015;26(10):922–935. doi: 10.1016/j.drugpo.2015.05.002. [DOI] [PMC free article] [PubMed] [Google Scholar]
- Milne R, Price M, Wallace B, Drost A, Haigh-Gidora I, Nezil FA, Fraser C. From principles to practice: Description of a novel equity-based HCV primary care treatment model for PWID. International Journal of Drug Policy. 2015;26(10):1020–1027. doi: 10.1016/j.drugpo.2015.07.009. [DOI] [PubMed] [Google Scholar]
- Ministry of Health of Ukraine. Immune Prevention of Hepatitis is the Most Efficient Way to Fight Against the Disease. 2014 Retrieved 7 March, 2016 from http://moz.gov.ua/ua/portal/pre_20140728_d.html.
- Ministry of Health of Ukraine. On approval and implementation of documentation on stardatization of medical help for Hepatitis C Virus. 2016 Retrieved April 24, 2017. [Google Scholar]
- Peters DH, Tran NT, Adam T. Implementation research in health: a practical guide. World Health Organization; 2014. [Google Scholar]
- Read P, Lothian R, Chronister K, Gilliver R, Kearley J, Dore GJ, van Beek I. Delivering direct acting antiviral therapy for hepatitis C to highly marginalised and current drug injecting populations in a targeted primary health care setting. Int J Drug Policy. 2017 doi: 10.1016/j.drugpo.2017.05.032. [DOI] [PubMed] [Google Scholar]
- Smith DJ, Combellick J, Jordan AE, Hagan H. Hepatitis C virus (HCV) disease progression in people who inject drugs (PWID): A systematic review and meta-analysis. International Journal of Drug Policy. 2015;26(10):911–921. doi: 10.1016/j.drugpo.2015.07.004. [DOI] [PMC free article] [PubMed] [Google Scholar]
- Stanaway JD, Flaxman AD, Naghavi M, Fitzmaurice C, Vos T, Abubakar I, Cooke GS. The global burden of viral hepatitis from 1990 to 2013: findings from the Global Burden of Disease Study 2013. Lancet. 2016;388(10049):1081–1088. doi: 10.1016/S0140-6736(16)30579-7. [DOI] [PMC free article] [PubMed] [Google Scholar]
- Stata. Release 14 tatistical Software. College Station, TX: StataCorp; 2014. 2015. StataCorp LP. [Google Scholar]
- Stetler CB, Damschroder LJ, Helfrich CD, Hagedorn HJ. A Guide for applying a revised version of the PARIHS framework for implementation. Implement Sci. 2011;6:99. doi: 10.1186/1748-5908-6-99. [DOI] [PMC free article] [PubMed] [Google Scholar]
- Sylla L, Bruce RD, Kamarulzaman A, Altice FL. Integration and co-location of HIV/AIDS, tuberculosis and drug treatment services. Int J Drug Policy. 2007;18(4):306–312. doi: 10.1016/j.drugpo.2007.03.001. [DOI] [PMC free article] [PubMed] [Google Scholar]
- UNODC. Word Drug Report 2016. Vienna, Austria: 2016. (United Nations Publication, Sales No. E.16.XI.7). [Google Scholar]
- Vitek CR, Cakalo JI, Kruglov YV, Dumchev KV, Salyuk TO, Bozicevic I, Rutherford GW. Slowing of the HIV epidemic in Ukraine: evidence from case reporting and key population surveys, 2005-2012. PLoS One. 2014;9(9):e103657. doi: 10.1371/journal.pone.0103657. [DOI] [PMC free article] [PubMed] [Google Scholar]
- Wolfe D, Luhmann N, Harris M, Momenghalibaf A, Albers E, Byrne J, Swan T. Human rights and access to hepatitis C treatment for people who inject drugs. International Journal of Drug Policy. 2015;26(11):1072–1080. doi: 10.1016/j.drugpo.2015.05.007. http://dx.doi.org/10.1016/j.drugpo.2015.05.007. [DOI] [PubMed] [Google Scholar]
- WHO, editor. World Health Organization. Hepatitis C Factsheet No. 164. WHO; 2016. Hepatitis C Factsheet No 164. http://www.who.int/mediacentre/factsheets/fs164/en/ [Google Scholar]
- World Populatin Review (Producer) Ukraine Population. WPR; 2016. Jnauary 6th, 2017. Retrieved from http://worldpopulationreview.com/countries/ukraine-population/ [Google Scholar]