

Abstract
Objective
Reasons for the higher obesity prevalence in African American women (AAW) compared to Caucasian women (CW) are unknown. Energy expenditure and maximal aerobic capacity (VO2max) are lower in AAW. We hypothesized these differences are explained by skeletal muscle characteristics, particularly mitochondrial content and function.
Methods
Multivariate regression analyses were used to examine the relationships between energy expenditure (resting and during a hyperinsulinemic-euglycemic clamp) and VO2max vs. body composition, physical activity, and skeletal muscle mitochondrial measurements in AAW and CW.
Results
In AAW, VO2max was lower (p<0.0001). Body-composition-adjusted energy expenditure during the clamp was lower in AAW (p<0.002). Physical activity was similar in both groups. After adjusting for mitochondrial respiration, racial differences in energy expenditure and VO2max were no longer present. Another novel finding was that a thermogenic response to the clamp was observed in CW (+53±22 kcal/d; p<0.03) but not in AAW (−19±24 kcal/d; p=0.43).
Conclusions
AAW and CW show differences in adjusted energy expenditure and aerobic capacity that are largely accounted for by differences in skeletal muscle mitochondrial oxidative characteristics. Further research is needed to determine if lower mitochondrial respiration and lower thermogenesis are risk factors for obesity in AAW.
Keywords: energy expenditure, aerobic capacity, mitochondria, racial disparity, thermogenesis
Introduction
The prevalence of obesity and associated chronic diseases is higher in African American women (AAW) than in Caucasian women (CW) (1, 2), but the reasons remain incompletely understood. Low resting and low 24-h energy expenditure are associated with weight gain (3). Another risk factor for obesity is low aerobic capacity, which is determined by physical activity and genetic factors (4). In a parent-offspring study, the heritability of aerobic fitness was estimated as 40% and the odds of being overweight or obese were three- to tenfold lower in those with the highest level of aerobic fitness (4). These factors may play a role in the increased obesity risk in AAW.
A lower total energy expenditure (5, 6, 7, 8) and lower resting energy expenditure (REE) have been consistently reported in lean, overweight, and obese AAW compared to CW (5, 6, 7, 8, 9). Whether these differences play a role in the higher risk for obesity in AAW is unknown, but we recently demonstrated that lower energy expenditure explains the lower weight loss achieved by AAW during a behavioral intervention (7). The primary determinant of REE is fat free mass (FFM; (10)) with gender, race, age, body fat, and genetics contributing to variation (10, 11, 12). However, mechanisms responsible for the lower energy expenditure in AAW are not completely understood.
In addition to lower energy expenditure, AAW have lower maximal aerobic capacity (8, 13). Physical activity plays a major role in aerobic capacity, but a limitation of most studies in AAW is that objective assessment of free-living physical activity is not obtained. Differences in hemoglobin levels and skeletal muscle aerobic capacity have been shown to be associated with lower VO2max in AAW, but did not fully explain the racial difference (13).
Skeletal muscle, although having a low relative energy expenditure (on a per unit basis) is the largest component of FFM and accounts for approximately 20-30% of oxygen uptake at rest (14). We suggest that differences in skeletal muscle characteristics related to oxidative capacity might play a role in the lower energy expenditure and VO2max in AAW. Previous observations support the rationale for pursuing this hypothesis. Skeletal muscle fiber type composition, capillary density and mitochondrial volume density are associated with obesity, muscle respiratory capacity, and maximal aerobic capacity (15, 16, 17, 18, 19). A lower percentage of type I fibers (16, 20) and lower oxidative capacity have been observed in skeletal muscle in AAW (13, 20). Support for mitochondrial metabolism playing a role in racial differences in energy expenditure comes from the observation that African mitochondrial DNA haplogroups are associated with lower REE (32). Furthermore, we have previously shown that mitochondrial respiration is lower, and is associated with lower peripheral glucose uptake in AAW compared to CW (20).
Based on these observations, the primary goal of this report is to determine whether skeletal muscle characteristics, particularly mitochondrial content and function, explain the racial differences in energy expenditure and VO2max. A secondary goal is to examine whether AAW have a blunted thermogenic response to infused insulin and glucose.
Methods
Participants in this study also participated in a study of differences in glucose metabolism, and a detailed description has been reported (20). Briefly, 22 non-obese, young AA women and 22 Caucasian women matched for BMI, body weight and age were enrolled. We chose to study non-obese women to examine metabolic differences before the onset of obesity, and avoid the potential confounder of metabolic disturbances that occur after increased adiposity is established. Inclusion criteria included age>8 and <36 y, stable body weight over the previous 3 months, non-pregnant or lactating, and sedentary (<20 min of activity, 3×/week). Exclusion criteria included significant disease or unstable medical condition, diabetes mellitus, and any drug treatment that alters glucose metabolism. The protocol was approved by the University of Pittsburgh Institutional Review Board. All research participants gave written informed consent.
Whole Body Measures
Body composition, including the amount of FFM in the trunk region and the amount of appendicular FFM, was assessed by dual energy x-ray absorptiometry (GE Lunar iDXA). Maximal aerobic capacity was measured by graded exercise testing using an incremental modified Astrand protocol on an electronically-braked cycle ergometer. Free-living physical activity was assessed for 6.1±1.4 days, within 12.7±7.4 days of the VO2max testing using multisensor activity monitors (Sensewear MF Armband, BodyMedia, Pittsburgh, PA) which have been shown to perform as well, or better than other activity monitors (21, 22, 23). An inpatient overnight stay was scheduled (at least 3 days after exercise test) for assessment of energy expenditure and a muscle biopsy the following morning.
Participants were admitted to a Clinical Research Unit at approximately 5 pm for an overnight stay, where they received a standardized meal (10 kcal/kg; 50 %CHO, 15 %protein, 35 %fat) and then fasted until completion of study procedures. The following morning REE was determined by indirect calorimetry (Parvomedics TrueOne 2400) (7). Energy expenditure measurements were repeated during the steady state (SS; final 30 minutes) of each step of a 2-step hyperinsulinemic-euglycemic clamp (SS1: 15 and SS2: 40 mU/m2/min) implemented to assess insulin sensitivity (20).
Muscle Biopsies
A percutaneous muscle biopsy (vastus lateralis) was cleared of blood and adipose and partitioned for analyses (20, 24). From the total biopsy sample, a fresh sample was placed into buffer (BIOPS) for high resolution respirometry (20), a portion was placed in mounting medium for histochemical analysis (24), and a portion was prepared (20) for transmission electron microscopy (TEM).
Muscle fiber type and capillary density were measured using standard histochemical methods (20, 24). Mitochondrial volume density, or the fraction of cell volume occupied by mitochondria, was assessed from TEM images using digital morphometry and the point-sampling technique of classical stereology (25, 26).
As previously reported, muscle fibers (1.5-2.5 mg) were permeabilized with saponin (50 μg/mL in BIOPS buffer) for 20 minutes and treated with blebbistatin (25 μM) to inhibit contraction before insertion into the chamber of the Oxygraph system (Oroboros, Oxygraph-2k, Oroboros Instruments) with Mir05 buffer at 37°C (20). State 4 respiration was determined with 5 mM glutamate, 2 mM malate, 10 mM succinate, and 25 μM palmitoylcarnitine. Maximal coupled, or State 3 respiration was subsequently measured with stepwise ADP titration (manual injection, 37.5 - 4000 μM). Vmax and Km were determined using standard Michaelis–Menten kinetics. Maximal uncoupled or State U respiration was assessed with the subsequent addition of p-trifluoromethoxy carbonyl cyanide phenylhydrazone (FCCP; 2μM × 3 additions). In quality control testing, there was no significant effect of adding cytochrome c (10 μM) on respiration.
Data Analysis
Analysis of variance (ANOVA: Proc GLM, SAS 9.4 for Windows; SAS Institute Inc., Cary, NC) was used for group comparisons, with and without adjusting for appropriate variables included as covariates (e.g. FFM, proportion of type I fibers, mitochondrial density). Two-way repeated measures ANOVA (Proc Mixed, covariance structure: unstructured), with and without covariates, was used for analysis of the 3 energy expenditure measurements (before and during the clamp). The thermogenic response to the clamp was calculated by subtracting REE from the EE during the clamp (average of SS1 and SS2).
Based on Shapiro–Wilk tests, all variables except minutes of physical activity were normally distributed. The square root of minutes of physical activity was normally distributed and was used in the model for VO2max. Homogeneity of variance for all variables was confirmed using Levene’s test.
To investigate whether relationships (e.g. between REE or VO2max and mitochondrial respiration) were different between races, tests of slopes and intercepts were carried out using regression analysis (Proc GLM). Stepwise multiple regression was used to model energy expenditure and VO2max, with race, FFM, fat mass, proportion and amount of FFM in the trunk, minutes of physical activity, hemoglobin and TSH levels, proportion of type I and type II muscle fibers, capillary density, mitochondrial density, and mitochondrial respiration as potential parameters. The default significance level for a parameter to enter, and stay in the model were set at p=0.15. To examine the parameter effect of race in the final models for REE and energy expenditure during the clamp the significance level for a parameter to enter, and stay in the model was increased (to force race in the model): for RMR, each increased to 0.8, and for the energy expenditure during the clamp, each increased to 0.6. Total sample size includes 22 AAW and 22 CW. However, 3 energy expenditure values for AAW are missing due to equipment malfunction, values for fiber typing are missing for 2 AAW and 2 CW, and values for mitochondrial density and respiration are missing for 1 AAW and 2 CW. Values are presented as mean±SD, except in analyses including covariates where we report least squares means (LSM)±SEM, and graphical presentation of data (mean±SE).
Results
Participant Characteristics
As previously reported (20), the AAW and CW were matched for BMI (22.7±3.1 vs. 22.7±3.1 kg/m2), weight and age (22.8±4.0 vs. 24.3±5.5 y). The AAW had a lower percentage of body fat (27.1±6.7 vs. 32.1±6.8 %, p<0.02). The amount of FFM in the trunk region was similar in AAW and CW (19.8±2.6 vs. 19.7±2.5 kg), while the amount of appendicular FFM was higher in AAW (21.0±3.1 vs. 19.1±2.6 kg; p<0.04). The proportion of FFM within the trunk area was lower in the AAW (44.3±1.7% vs. 46.3 ±1.6%, p<0.001), and conversely, the proportion of appendicular FFM was higher in AAW (46.8±2.0% vs. 45.0 ±1.5%, p<0.002). Serum TSH levels were similar in AAW and CW (1.78±0.83 vs. 1.91±0.62 mIU/L; p = 0.55). Blood hemoglobin levels were lower in AAW compared to CW (12.7±1.0 vs. 13.4±0.8 mg/dl; p<0.02).
Energy expenditure and thermogenesis
Replicate measures of energy expenditure obtained at baseline and during each steady state phase of a fasting, 2-step hyperinsulinemic-euglycemic clamp demonstrated a lower energy expenditure in AAW compared to CW (unadjusted, p<0.05; Figure 1A; p<0.0002 adjusting for FFM, p<0.002 adjusting for FFM and FM). There was a suggestion of an effect of the insulin and glucose infusion associated with the clamp on energy expenditure (p=0.062) and a difference in response by race (p=0.081). The change in energy expenditure during the clamp (average and SS1 and SS2) compared to baseline energy expenditure (REE) was significant only in CW (p<0.03), and was different between AAW and CW (Figure 1B; −19±88 vs 53±119 kcal/d; p<0.04).
Figure 1.
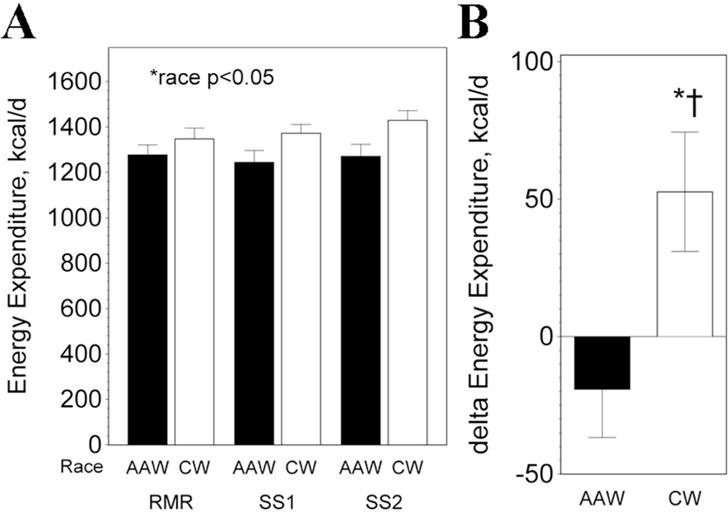
Energy expenditure. A) Energy expenditure was significantly lower in AAW (p<0.002). B) Delta energy expenditure during clamp (average of SS1 and SS2) compared to baseline REE. *significant change, p<0.03; †change significantly different between AAW and CW during clamp, p<0.04.
Maximal Aerobic capacity
During the maximal aerobic capacity tests, AAW and CW achieved nearly identical maximal RER (1.10±0.06 vs 1.12±0.07, p=0.57) and rating of perceived exertion (RPE: 17.3±1.4 vs 17.4±1.4, p=0.86). Even though objective (RER) and subjective (RPE) measures confirmed that the AAW and CW provided a maximal effort, VO2max was 12.9% lower in AAW (2020±410 vs. 2320±491 ml/min; p=0.04). This difference became more pronounced (18.3% lower) when adjusting for FFM as a covariate (AAW: 1951±70 vs. CW: 2389±70 ml/min, p<0.0001), or when dividing by FFM (45.1±6.9 vs. 54.4±7.8 ml/min/kg; p<0.0001).
As shown in Table 1, objectively assessed free-living physical activity could not explain the racial difference in VO2max. Activity EE (AEE), time spent in total, vigorous or very vigorous activity, time spent in sedentary behavior, and steps/d were similar in AAW and CW.
Table 1.
Physical Activity
| Parameter* | AAW (n=22) |
CW (n=22) |
p |
|---|---|---|---|
| AEE, kcal/d | 631 ± 278 | 594 ± 518 | 0.77 |
| PA, min/d | 126 ± 52 | 116 ± 89 | 0.64 |
| Vigorous PA, min/d | 23 ± 19 | 27 ± 43 | 0.72 |
| Very Vigorous PA, min/d | 3 ± 4 | 4 ± 7 | 0.65 |
| Sedentary, h/d | 14.3 ± 1.2 | 14.1 ± 1.6 | 0.55 |
| Steps/d | 9958 ± 4472 | 8721 ± 3452 | 0.31 |
AEE = Activity energy expenditure, PA = physical activity defined as ≥ 3 METs, vigorous PA (6–9 METS) and very vigorous (>9 METS) minutes/day (min/d).
Mitochondrial content and respiration
Mitochondrial content was lower in AAW (3.7±1.2% vs. 4.8±1.6%; p<0.02). As previously reported, high-resolution respirometry of permeabilized muscle fibers revealed a lower oxidative capacity in AAW (20). After adjusting for mitochondrial content as a covariate, AAW still showed significantly lower State 4 (67 ± 4 vs. 80 ± 4 pmol/sec/mg dry wt; p<0.04), State 3 (324±17 vs. 418±18 pmol/sec/mg dry wt; p<0.001) and State U (365±15 vs. 486±17 pmol/sec/mg dry wt; p<0.0001) mitochondrial respiration. The respiratory control ratio (State 3 divided by State 4 respiration) was not significantly different between the AAW and CW (4.9±0.9 vs 5.3±0.7; p=0.21). The ADP concentration at half maximum respiration (Km) was similar in AAW and CW (256±80 vs 277±79 μM; p=0.41).
Modeling Energy Expenditure
When all subjects were combined, REE was significantly correlated with total, trunk and appendicular FFM, and fat mass (Table 2). Mitochondrial density and mitochondrial respiration were also correlated with REE. Many of the correlations tended to be stronger against the energy expenditure during the clamp, particularly mitochondrial parameters. For example, the correlations with mitochondrial density (r=0.50, p<0.0009), State 3 respiration (r=0.42, p<0.009) and State U respiration (r=0.54, p<0.007) tended to be stronger compared to the correlations shown in Table 2 for REE. Although REE and State 4 respiration were lower in AAW, there was no racial difference in the relationship between REE and State 4 respiration (Figure 2A, slopes:p=0.73, intercepts: p=0.75).
Table 2.
Correlations with REE and VO2max*
| REE | VO2max L/min | VO2max ml/min/kg FFM | ||||
|---|---|---|---|---|---|---|
|
| ||||||
| Variable | r | p | r | p | r | p |
| FFM | 0.52 | 0.0005 | 0.58 | 0.0001 | – | – |
| Trunk FFM | 0.46 | 0.003 | 0.61 | 0.0001 | 0.11 | 0.48 |
| Appendicular FFM | 0.54 | 0.0003 | 0.52 | 0.0003 | −0.02 | 0.88 |
| % Trunk FFM | −0.20 | 0.20 | 0.09 | 0.55 | 0.24 | 0.12 |
| Fat | 0.59 | 0.0001 | 0.25 | 0.10 | 0.20 | 0.20 |
| Minutes physical activity | −0.20 | 0.19 | 0.29 | 0.053 | 0.27 | 0.08 |
| Sedentary minutes | 0.11 | 0.51 | −0.28 | 0.069 | −0.30 | 0.05 |
| Hemoglobin | 0.17 | 0.28 | 0.22 | 0.16 | 0.37 | 0.02 |
| TSH | −0.24 | 0.13 | 0.00 | 0.99 | 0.00 | 0.98 |
| % Type I fibers | 0.13 | 0.45 | 0.39 | 0.02 | 0.45 | 0.004 |
| %Type II fibers | −0.13 | 0.45 | −0.39 | 0.02 | −0.45 | 0.004 |
| Mitochondrial density | 0.41 | 0.009 | 0.62 | 0.0001 | 0.54 | 0.0003 |
| State 4 respiration | 0.41 | 0.02 | 0.54 | 0.0003 | 0.55 | 0.0002 |
| State 3 respiration | 0.29 | 0.08 | 0.48 | 0.002 | 0.63 | 00001 |
| State U respiration | 0.35 | 0.04 | 0.48 | 0.003 | 0.60 | 0.0001 |
n=22 AAW and 22 CW, with the following exceptions: REE values for 3 AAW are missing; for fiber typing, values are missing for 2 AAW and 2 CW; for mitochondrial density and respiration, values are missing for 1 AAW and 2 CW. FFM = fat free mass, TSH = thyroid stimulating hormone.
Figure 2.
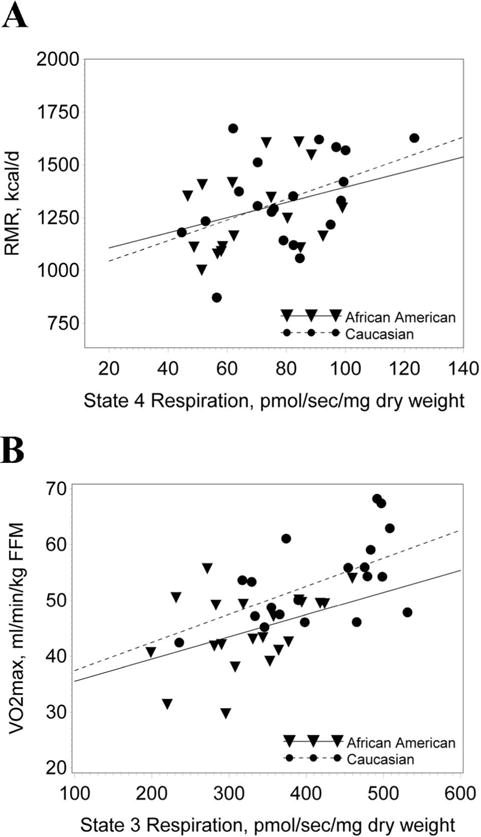
REE and VO2max vs. mitochondrial respiration. A) The significant (p<0.02) relationship between REE and State 4 respiration was not different between AAW and CW (slopes:p=0.73, intercepts: p=0.75). B) The significant (p<0.0001) relationship between VO2max and State 3 respiration was not different between AAW and CW (slopes: p=0.70; intercepts: p=0.93).
We next modeled energy expenditure including subject characteristics and race. The first parameters to enter model for REE were body fat and FFM (Table 3, Model #1). Although race explained 3% of the variance in REE, it was not significant (p=0.12). When also including skeletal muscle parameters, state 4 respiration was the only variable to enter the model (Table 3, Model #2; r2=0.66, p<0.0001). No other body composition or blood variables entered either model.
Table 3.
Stepwise Multiple Regression Models for energy expenditure and VO2max*
| r2/p | Intercept | Variable 1 | Variable 2 | Variable 3 | ||
|---|---|---|---|---|---|---|
| Resting energy expenditure, kcal/d | ||||||
| Model #1 | 0.56 0.0001 |
Estimate Partial r2 p |
341 | 14.3 × Fat 0.34 0.0003 |
16.8 × FFM 0.18 0.0002 |
−74 × Race 0.03 0.12 |
| Model #2 | 0.66 0.0001 |
Estimate Partial r2 p |
264 | 17.9 × Fat 0.48 0.0001 |
11.9 × FFM 0.13 0.001 |
2.4 × State 4 0.05 0.04 |
| Energy expenditure in response to insulin and glucose infusion, kcal/d | ||||||
| Model #3 | 0.68 0.0001 |
Estimate Partial r2 p |
284 | 12.1 × Fat 0.33 0.0001 |
20.4 × FFM 0.21 0.0001 |
−162 × Race 0.14 0.002 |
| Model #4 | 0.75 0.0001 |
Estimate Partial r2 p |
80 | 16.4 × Fat 0.52 0.0001 |
14.5 × FFM 0.14 0.0007 |
0.68 × State U 0.09 0.003 |
| VO2max, ml/min | ||||||
| Model #5 | 0.62 0.0001 |
Estimate Partial r2 p |
−498 | 56 × FFM 0.33 0.0001 |
−474 × Race 0.21 0.0001 |
42 × PA½, min 0.07 0.01 |
| Model #6 | 0.65 0.0001 |
Estimate Partial r2 p |
−874 | 94 × Mito Density 0.30 0.0003 |
41.6 × FFM 0.18 0.001 |
2.2 × State 3 0.17 0.0002 |
Energy expenditure Models #1 and #3 include 19 AAW and 22 CW, Model #2 include 18 AAW and 20 CW and Model #4 includes 18 AAW and 17 CW. VO2max model #5 includes 22 AAW and 22 CW, while Model #6 includes 20 AAW and 19 CW; FFM = fat free mass, PA = physical activity, Mito = mitochondrial.
The same subject characteristics, including race (p<0.002) entered the model when examining the energy expenditure during the clamp (average of SS1 and SS2; Table 3, Model #3). The final model for the energy expenditure during the clamp was similar to the final model for REE, and included fat mass, FFM, and State U respiration, explaining 75% of the variance (Table 3, Model #4). No additional parameters, including race entered either model.
When forcing race in the model for REE (Model #2), the parameter estimate for race was eliminated (14±49 kcal/d; p=0.78) compared with that observed in Model #1 (−74±46 kcal/d, p=0.12). Forcing race in the model for the energy expenditure during the clamp (Model #4) eliminated the significant race effect (−28±50 kcal/d; p=0.60) observed in Model #3 (−162 kcal/d, p<0.0002).
Modeling VO2max
When all subjects were combined, hemoglobin levels, hours being sedentary, proportion of type I and type II muscle fibers, mitochondrial density, State 4 respiration, maximal State 3 respiration, and State U respiration were significantly correlated with VO2max adjusted for FFM (Table 2). There was no significant racial difference in the relationship between VO2max and State 3 respiration between the AAW and CW, (Figure 2B; slopes: p=0.70; intercepts: p=0.93).
To identify the most important contributing factors to the racial difference in VO2max, we conducted regression analyses. When including race, body composition, hemoglobin levels, and physical activity variables in a stepwise multiple regression, FFM was the first variable to enter the model, explaining 33% of the variance (p<0.0001), followed by race, explaining 21%, and daily minutes of physical activity, which explained 7% of the variance (Table 3, Model #5). None of the other potential variables entered the model.
When also including skeletal muscle characteristics, mitochondrial density was the first parameter to enter the model, followed by FFM and then maximal State 3 respiration (Table 3, Model #6). Physical activity did not enter this model, and there was no longer a significant race effect (p=0.13). When also including race in Model #6, the parameter estimate for race was reduced by 64% (−171±110 vs −474±94 ml O2/min compared to that observed in Model #5).
Parameters associated with the thermogenic response
We found that the only parameter significantly correlated with the increase in energy expenditure during the clamp was peripheral insulin sensitivity (r=0.40, p<0.01(20)). There was a suggestion of a relationship with non-oxidative glucose disposal (20), but this association did not quite reach significance (r=0.30, p=0.061). There was no significant association between mitochondrial respiration and the increase in energy expenditure during the clamp (State 3, r=0.13 p=0.42; State U, r= 0.22, p=0.21).
Discussion
A lower energy expenditure and VO2max have been consistently reported in AAW compared to CW (5, 6, 7, 8, 9, 13), but the reasons for these differences have not been entirely understood. We have previously demonstrated that lower mitochondrial respiration was associated with lower peripheral glucose uptake in the AAW in this study (20). The primary goal of the present report was to examine whether skeletal muscle oxidative capacity explains the lower energy expenditure and maximal aerobic capacity in AAW. We demonstrate that it does. Racial differences in body composition- adjusted energy expenditure and VO2max were no longer present when also adjusting for mitochondrial respiration.
A strength of our study is that we measured energy expenditure both at rest (at which individuals spend only of fraction of their day) and during an insulin and glucose infusion (hyperinsulinemic-euglycemic clamp), which provided interesting insights. For example, the racial difference in adjusted (FFM and FM) energy expenditure during the clamp (−162±40 kcal/d; p<0.0001) was over two-fold greater than observed with the pre-clamp REE (−74±46; p=0.12). The racial differences in energy expenditure were eliminated after inclusion of mitochondrial respiration in the models.
One parameter that we explored regarding the racial difference in VO2max is the level of habitual physical activity. However, objectively-assessed physical activity was similar in AAW and CW, and therefore, could not explain this racial difference. Another parameter that we explored was mitochondrial oxidative capacity of skeletal muscle, which has previously been shown to be highly correlated with VO2max (18, 19, 27, 28). The present work now demonstrates that the racial difference in VO2max disappears after adjusting for mitochondrial content and respiration. Furthermore, after adjusting for FFM and mitochondrial content a racial difference was still evident (p<0.01). However, when also including mitochondrial respiration (explaining 17% of the variance, Model #6) the significant racial difference in VO2max was eliminated.
The etiology of the lower mitochondrial respiration in AAW is yet to be elucidated. One possibility is that this is due to genetic differences. A substantial portion of the variability in REE has been attributed to genetic influences independent of body composition, age and gender (29, 30). European ancestry admixture in AAs has been shown to be strongly associated with higher REE (31). Furthermore, differences in mitochondrial DNA may play a role. Common African mitochondrial DNA haplogroups have been associated with lower REE (32). Mitochondrial DNA sequence variation has also been shown to be associated with free-living activity energy expenditure (33). These observations suggest that genetic factors might explain the lower mitochondrial oxidative capacity and, indirectly, the lower VO2max and REE in AAW.
An additional novel finding from our study is that a thermogenic response to insulin and glucose infusion during the course of a hyperinsulinemic-euglycemic clamp was observed in CW, but not in AAW. A thermogenic response has been reported in non-obese Caucasians using a similar insulin infusion rate (34, 35, 36). However, in non-obese Pima Indians, no thermogenic response was observed (35), showing considerable similarity with our findings in AAW. At least part of the increase in energy expenditure during a clamp has been attributed to glucose storage as glycogen, an energy requiring process (34, 35, 36). We have previously shown that lean AAW have lower insulin sensitivity and lower non-oxidative glucose disposal than CW (20). We now show that insulin sensitivity was significantly correlated with the increase in energy expenditure during the clamp. Therefore, at least part of the blunted response in energy expenditure observed in AAW may be a consequence of insulin resistance in skeletal muscle.
A limitation of our study is that we included only women. This deliberate choice was because women show a greater racial disparity for prevalence of obesity (odds ratio 2.26 in women vs. 1.13 in men) (37) and diabetes incidence (2.4-fold in women vs. 1.5 fold men) (38). Our data cannot be unequivocally extended to men, but it is worth noting that a lower REE has been reported in African-American men (39). Whether African-American men share similar mitochondrial characteristics needs further research.
In summary, the lower energy expenditure and VO2max observed in AAW compared to CW are at least partially explained by differences in mitochondrial oxidative capacity of skeletal muscle. In addition, we report the novel finding that the thermogenic effect of infused insulin and glucose that is observed in CW is not observed in AAW. Additional research is needed to determine whether low skeletal muscle mitochondrial respiration and decreased thermogenesis are predisposing risk factors for weight gain in AAW.
What is already known about this subject?
Energy expenditure and maximal aerobic capacity are lower in African American women (AAW) than in Caucasian women (CW), even after adjusting for age, BMI and body composition.
Reasons for these physiological differences are unknown.
We have previously demonstrated that mitochondrial respiration is lower in AAW compared with CW.
What does your study add?
We demonstrate that differences in energy expenditure and maximal aerobic capacity between AAW and CW are predominantly explained by differences in skeletal muscle mitochondrial respiration.
Mitochondrial respiration is lower in AAW after adjusting for mitochondrial content.
AAW did not show a thermogenic response to infused insulin and glucose that was observed in CW.
Acknowledgments
Funding: This study was supported by National Institute of Diabetes and Digestive and Kidney Diseases Grant DK091462 (to J.P.D.) and National Institutes of Health Grant UL1 TR001857 (Clinical and Translational Research Center).
Footnotes
Disclosures: None.
References
- 1.Cossrow N, Falkner B. Race/Ethnic Issues in Obesity and Obesity-Related Comorbidities. J Clin Endocrinol Metab. 2004;89:2590–2594. doi: 10.1210/jc.2004-0339. [DOI] [PubMed] [Google Scholar]
- 2.Paeratakul S, Lovejoy JC, Ryan DH, Bray GA. The relation of gender, race and socioeconomic status to obesity and obesity comorbidities in a sample of US adults. International journal of obesity and related metabolic disorders: journal of the International Association for the Study of Obesity. 2002;26:1205–1210. doi: 10.1038/sj.ijo.0802026. [DOI] [PubMed] [Google Scholar]
- 3.Ravussin E. Energy metabolism in obesity. Studies in the Pima Indians. Diabetes Care. 1993;16:232–238. doi: 10.2337/diacare.16.1.232. [DOI] [PubMed] [Google Scholar]
- 4.Foraita R, Brandes M, Günther F, Bammann K, Pigeot I, Ahrens W. The influence of aerobic fitness on obesity and its parent-offspring correlations in a cross-sectional study among German families. BMC Public Health. 2015;15:638. doi: 10.1186/s12889-015-2013-x. [DOI] [PMC free article] [PubMed] [Google Scholar]
- 5.Carpenter WH, Fonong T, Toth MJ, Ades PA, Calles-Escandon J, Walston JD, et al. Total daily energy expenditure in free-living older African-Americans and Caucasians. Am J Physiol. 1998;274:E96–101. doi: 10.1152/ajpendo.1998.274.1.E96. [DOI] [PubMed] [Google Scholar]
- 6.Weinsier RL, Hunter GR, Zuckerman PA, Redden DT, Darnell BE, Larson DE, et al. Energy expenditure and free-living physical activity in black and white women: comparison before and after weight loss. Am J Clin Nutr. 2000;71:1138–1146. doi: 10.1093/ajcn/71.5.1138. [DOI] [PubMed] [Google Scholar]
- 7.DeLany JP, Jakicic JM, Lowery JB, Hames KC, Kelley DE, Goodpaster BH. African American women exhibit similar adherence to intervention but lose less weight due to lower energy requirements. International journal of obesity (2005) 2014;38:1147–1152. doi: 10.1038/ijo.2013.240. [DOI] [PubMed] [Google Scholar]
- 8.Hunter GR, Weinsier RL, Darnell BE, Zuckerman PA, Goran MI. Racial differences in energy expenditure and aerobic fitness in premenopausal women1. Am J Clin Nutr. 2000;71:500–506. doi: 10.1093/ajcn/71.2.500. [DOI] [PubMed] [Google Scholar]
- 9.Jakicic JM, Wing RR. Differences in resting energy expenditure in African-American vs Caucasian overweight females. IntJ ObesRelatMetabDisord. 1998;22:236–242. doi: 10.1038/sj.ijo.0800575. [DOI] [PubMed] [Google Scholar]
- 10.Weinsier RL, Schutz Y, Bracco D. Reexamination of the relationship of resting metabolic rate to fat-free mass and to the metabolically active components of fat-free mass in humans. Am J Clin Nutr. 1992;55:790–794. doi: 10.1093/ajcn/55.4.790. [DOI] [PubMed] [Google Scholar]
- 11.Kleiber M. Body size and metabolic rate. Physiol Rev. 1947;27:511–541. doi: 10.1152/physrev.1947.27.4.511. [DOI] [PubMed] [Google Scholar]
- 12.Weyer C, Snitker S, Rising R, Bogardus C, Ravussin E. Determinants of energy expenditure and fuel utilization in man: effects of body composition, age, sex, ethnicity and glucose tolerance in 916 subjects. IntJObesRelat Metab Disord. 1999;23:715–722. doi: 10.1038/sj.ijo.0800910. [DOI] [PubMed] [Google Scholar]
- 13.Hunter GR, Weinsier RL, McCarthy JP, Enette Larson-Meyer D, Newcomer BR. Hemoglobin, muscle oxidative capacity, and VO2max in African-American and Caucasian women. Medicine and science in sports and exercise. 2001;33:1739–1743. doi: 10.1097/00005768-200110000-00019. [DOI] [PubMed] [Google Scholar]
- 14.Gallagher D, Belmonte D, Deurenberg P, Wang Z, Krasnow N, Pi-Sunyer FX, et al. Organ-tissue mass measurement allows modeling of REE and metabolically active tissue mass. Am J Physiol. 1998;275:E249–258. doi: 10.1152/ajpendo.1998.275.2.E249. [DOI] [PubMed] [Google Scholar]
- 15.Lillioja S, Young AA, Culter CL, Ivy JL, Abbott WG, Zawadzki JK, et al. Skeletal muscle capillary density and fiber type are possible determinants of in vivo insulin resistance in man. J Clin Invest. 1987;80:415–424. doi: 10.1172/JCI113088. [DOI] [PMC free article] [PubMed] [Google Scholar]
- 16.Tanner CJ, Barakat HA, Dohm GL, Pories WJ, MacDonald KG, Cunningham PRG, et al. Muscle fiber type is associated with obesity and weight loss. Am J Physiol Endocrinol Metab. 2002;282:E1191–1196. doi: 10.1152/ajpendo.00416.2001. [DOI] [PubMed] [Google Scholar]
- 17.Sun G, Ukkola O, Rankinen T, Joanisse DR, Bouchard C. Skeletal muscle characteristics predict body fat gain in response to overfeeding in never-obese young men. Metabolism. 2002;51:451–456. doi: 10.1053/meta.2002.31324. [DOI] [PubMed] [Google Scholar]
- 18.Ivy JL, Costill DL, Maxwell BD. Skeletal muscle determinants of maximum aerobic power in man. Eur J Appl Physiol Occup Physiol. 1980;44:1–8. doi: 10.1007/BF00421757. [DOI] [PubMed] [Google Scholar]
- 19.Kirkwood SP, Zurlo F, Larson K, Ravussin E. Muscle mitochondrial morphology, body composition, and energy expenditure in sedentary individuals. Am J Physiol. 1991;260:E89–94. doi: 10.1152/ajpendo.1991.260.1.E89. [DOI] [PubMed] [Google Scholar]
- 20.DeLany JP, Dube JJ, Standley RA, Distefano G, Goodpaster BH, Stefanovic-Racic M, et al. Racial differences in peripheral insulin sensitivity and mitochondrial capacity in the absence of obesity. J Clin Endocrinol Metab. 2014;99:4307–4314. doi: 10.1210/jc.2014-2512. [DOI] [PMC free article] [PubMed] [Google Scholar]
- 21.Jakicic JM, Marcus M, Gallagher KI, Randall C, Thomas E, Goss FL, et al. Evaluation of the SenseWear Pro Armband to assess energy expenditure during exercise. Medicine and science in sports and exercise. 2004;36:897–904. doi: 10.1249/01.mss.0000126805.32659.43. [DOI] [PubMed] [Google Scholar]
- 22.Welk GJ, McClain JJ, Eisenmann JC, Wickel EE. Field validation of the MTI Actigraph and BodyMedia armband monitor using the IDEEA monitor. Obesity (Silver Spring, Md) 2007;15:918–928. doi: 10.1038/oby.2007.624. [DOI] [PubMed] [Google Scholar]
- 23.Berntsen S, Hageberg R, Aandstad A, Mowinckel P, Anderssen SA, Carlsen KH, et al. Validity of physical activity monitors in adults participating in free-living activities. Br J Sports Med. 2010;44:657–664. doi: 10.1136/bjsm.2008.048868. [DOI] [PubMed] [Google Scholar]
- 24.Dube JJ, Amati F, Stefanovic-Racic M, Toledo FGS, Sauers SE, Goodpaster BH. Exercise-induced alterations in intramyocellular lipids and insulin resistance: the athlete’s paradox revisited. Am J Physiol Endocrinol Metab. 2008;294:E882–888. doi: 10.1152/ajpendo.00769.2007. [DOI] [PMC free article] [PubMed] [Google Scholar]
- 25.Gundersen HJ, Bendtsen TF, Korbo L, Marcussen N, Moller A, Nielsen K, et al. Some new, simple and efficient stereological methods and their use in pathological research and diagnosis. Apmis. 1988;96:379–394. doi: 10.1111/j.1699-0463.1988.tb05320.x. [DOI] [PubMed] [Google Scholar]
- 26.Toledo FG, Menshikova EV, Ritov VB, Azuma K, Radikova Z, DeLany J, et al. Effects of physical activity and weight loss on skeletal muscle mitochondria and relationship with glucose control in type 2 diabetes. Diabetes. 2007;56:2142–2147. doi: 10.2337/db07-0141. [DOI] [PubMed] [Google Scholar]
- 27.Coen PM, Jubrias SA, Distefano G, Amati F, Mackey DC, Glynn NW, et al. Skeletal Muscle Mitochondrial Energetics Are Associated With Maximal Aerobic Capacity and Walking Speed in Older Adults. The Journals of Gerontology Series A: Biological Sciences and Medical Sciences. 2013;68:447–455. doi: 10.1093/gerona/gls196. [DOI] [PMC free article] [PubMed] [Google Scholar]
- 28.Hoppeler H, Howald H, Conley K, Lindstedt SL, Claassen H, Vock P, et al. Endurance training in humans: aerobic capacity and structure of skeletal muscle. Journal of Applied Physiology. 1985;59:320–327. doi: 10.1152/jappl.1985.59.2.320. [DOI] [PubMed] [Google Scholar]
- 29.Bogardus C, Lillioja S, Ravussin E, Abbott W, Zawadzki JK, Young A, et al. Familial dependence of the resting metabolic rate. NEnglJMed. 1986;315:96–100. doi: 10.1056/NEJM198607103150205. [DOI] [PubMed] [Google Scholar]
- 30.Bouchard C, Tremblay A, Nadeau A, Despres JP, Theriault G, Boulay MR, et al. Genetic effect in resting and exercise metabolic rates. Metabolism. 1989;38:364–370. doi: 10.1016/0026-0495(89)90126-1. [DOI] [PubMed] [Google Scholar]
- 31.Manini TM, Patel KV, Bauer DC, Ziv E, Schoeller DA, Mackey DC, et al. European ancestry and resting metabolic rate in older African Americans. European journal of clinical nutrition. 2011;65:663–667. doi: 10.1038/ejcn.2011.22. [DOI] [PMC free article] [PubMed] [Google Scholar]
- 32.Tranah GJ, Manini TM, Lohman KK, Nalls MA, Kritchevsky S, Newman AB, et al. Mitochondrial DNA variation in human metabolic rate and energy expenditure. Mitochondrion. 2011;11:855–861. doi: 10.1016/j.mito.2011.04.005. [DOI] [PMC free article] [PubMed] [Google Scholar]
- 33.Tranah GJ, Lam ET, Katzman SM, Nalls MA, Zhao Y, Evans DS, et al. Mitochondrial DNA sequence variation is associated with free-living activity energy expenditure in the elderly. Biochimica et Biophysica Acta (BBA) - Bioenergetics. 2012;1817:1691–1700. doi: 10.1016/j.bbabio.2012.05.012. [DOI] [PMC free article] [PubMed] [Google Scholar]
- 34.Thiebaud D, Schutz Y, Acheson K, Jacot E, DeFronzo RA, Felber JP, et al. Energy cost of glucose storage in human subjects during glucose-insulin infusions. Am J Physiol. 1983;244:E216–221. doi: 10.1152/ajpendo.1983.244.3.E216. [DOI] [PubMed] [Google Scholar]
- 35.Bogardus C, Lillioja S, Mott D, Zawadzki J, Young A, Abbott W. Evidence for reduced thermic effect of insulin and glucose infusions in Pima Indians. J Clin Invest. 1985;75:1264–1269. doi: 10.1172/JCI111825. [DOI] [PMC free article] [PubMed] [Google Scholar]
- 36.Ravussin E, Bogardus C, Schwartz RS, Robbins DC, Wolfe RR, Horton ES, et al. Thermic effect of infused glucose and insulin in man. Decreased response with increased insulin resistance in obesity and noninsulin-dependent diabetes mellitus. J Clin Invest. 1983;72:893–902. doi: 10.1172/JCI111060. [DOI] [PMC free article] [PubMed] [Google Scholar]
- 37.Flegal KM, Carroll MD, Ogden CL, Curtin LR. Prevalence and Trends in Obesity Among US Adults, 1999-2008. JAMA. 2010;303:235–241. doi: 10.1001/jama.2009.2014. [DOI] [PubMed] [Google Scholar]
- 38.Brancati FL, Kao WH, Folsom AR, Watson RL, Szklo M. Incident type 2 diabetes mellitus in African American and white adults: the Atherosclerosis Risk in Communities Study. Jama. 2000;283:2253–2259. doi: 10.1001/jama.283.17.2253. [DOI] [PubMed] [Google Scholar]
- 39.Sharp TA, Bell ML, Grunwald GK, Schmitz KH, Sidney S, Lewis CE, et al. Differences in Resting Metabolic Rate between White and African-American Young Adults. Obes Res. 2002;10:726–732. doi: 10.1038/oby.2002.99. [DOI] [PubMed] [Google Scholar]