

Abstract
Acrolein is an irritating aldehyde generated during combustion of organic compounds. Altered autonomic activity has been documented following acrolein inhalation, possibly impacting myocardial synchrony and function. Given the ubiquitous nature of acrolein in the environment, we sought to better define the immediate and delayed functional cardiac effects of acrolein inhalation in vivo. We hypothesized that acrolein inhalation would increase markers of cardiac mechanical dysfunction, i.e. myocardial dyssynchrony and performance index in mice. Male C57Bl/6J mice were exposed to filtered air (FA) or acrolein (0.3 or 3.0 ppm) for 3 hours in whole body plethysmography chambers (n=6). Echocardiographic analyses were performed one day before exposure and at 1 and 24 hours post-exposure. Speckle tracking echocardiography revealed that circumferential strain delay (i.e. dyssynchrony) was increased at 1 and 24 hours following exposure to 3.0 ppm, but not 0.3 ppm, when compared to pre-exposure and/or FA exposure. Pulsed wave Doppler of transmitral blood flow revealed that acrolein exposure at 0.3 ppm, but not 3.0 ppm, increased the Tei index of myocardial performance (i.e. decreased global heart performance) at 1 and 24 hours post-exposure compared to pre-exposure and/or FA exposure. We conclude that short-term inhalation of acrolein can acutely modify cardiac function in vivo and that echocardiographic evaluation of myocardial synchrony and performance following exposure to other inhaled pollutants could provide broader insight into the health effects of air pollution.
Keywords: Acrolein, echocardiography, myocardial strain, myocardial dyssynchrony, Tei index
Introduction
Short-term exposure to air pollution increases blood pressure, worsens myocardial ischemia and heart failure, and triggers arrhythmia, stroke, and myocardial infarction [1]. Time-series epidemiological studies have described population-level associations between short-term air pollution exposure and adverse cardiovascular health effects. The biological plausibility of such associations have relied on evidence gleaned from controlled human exposure studies, as well as animal and cellular toxicology studies. Much of our knowledge about the cardiovascular effects of air pollution have come from investigations focused on criteria pollutants regulated by the U.S. Clean Air Act, chiefly particulate matter and ozone (O3). By contrast, information on the cardiovascular health effects of other non-criteria air pollutants, including aldehydes like acrolein, are more limited, but when available provide further insight into the biological consequences of air pollution exposure.
Acrolein (C=C-C=O) is a reactive unsaturated aldehyde produced during combustion of organic compounds like wood, oils, tobacco, and engine fuels [2]. The U.S. EPA has reported the reference concentration for acrolein to be 2.0 × 10⁻⁵ mg/m3 and the lethal concentration to produce 50% mortality to be 66 ppm (151.8 mg/m3) for 6 hours [3]. Concentrations of acrolein can vary widely in the environment, having been detected at 0.05 – 0.3 ppm in diesel engine exhaust, 0.2 ppm in wildfires, and 0.3 – 3.1 ppm in structure fires [4]. Still higher and widely varying concentrations of acrolein have been reported in cigarette smoke [3, 5]. In terms of health concerns, acrolein is thought to be the leading non-cancer hazard in cigarette smoke [5] and a recent report from a human panel study demonstrated that urinary acrolein metabolite concentration was associated with platelet activation and elevated cardiovascular disease risk in cigarette smokers [6].
Studies in rodent models have indicated that acrolein inhalation can result in altered autonomic and vascular function but the effects on cardiac mechanical function are less well known. We previously reported that acrolein inhalation in hypertensive rats increased heart rate and blood pressure [7] and desensitized baroreflex responses in normotensive and hypertensive rats [8]. Others have reported that in vivo intravenous infusion of acrolein in mice [9] and in vitro exposure to acrolein in isolated mouse cardiomyocytes [10, 11] both resulted in cardiomyocyte contractile dysfunction, possibly due to concurrent findings of impaired cardiomyocyte Ca2+ handling. While those latter studies demonstrated that direct exposure to acrolein can disrupt heart contractile function, it remains to be determined if acrolein inhalation can indirectly impact in vivo cardiac mechanical function via changes in autonomic regulation, vascular function, or concentrations of various circulating agents (acrolein/adducts, inflammatory/paracrine mediators, etc.).
The purpose of this study was to assess the effects of acrolein inhalation at different concentrations on cardiac mechanical function in mice using high frequency echocardiography (Echo-HF). While multiple parameters of heart function can be studied in mice non-invasively using Echo-HF [12], we were primarily interested in endpoints indicative of mechanical function. These include the quantitation of myocardial deformation (strain), strain-rate during diastole, and differences in time-to-peak strain across regions of the left ventricle, the latter being a measure of intraventricular synchrony. These endpoints correlate well with indicators of cardiac health [13] and cardiac toxicity associated with chemotherapeutic agents [14]. Also, Doppler echocardiography of transmitral blood flow is used to determine left ventricular isovolumic and aortic ejection times, which together derive the Tei index of myocardial performance [15]. Global left ventricular function and Tei index are inversely related such that an increase in the Tei index is associated with a decrease in global myocardial performance [12]. We hypothesized that acrolein inhalation would increase markers of cardiac mechanical dysfunction, i.e. myocardial dyssynchrony and Tei index in mice. Finally, to provide linkages between effects in the respiratory tract and subsequent changes in cardiac function we examined the effects of acrolein inhalation on ventilation and pulmonary inflammation.
Materials and Methods
Mice
Eighteen male C57Bl/6J mice were purchased from The Jackson Laboratory (Bar Harbor, ME, USA) at 10 – 12 weeks of age and averaging 26.6 grams of body mass. Mice were housed 3 – 4 per cage in climate controlled rooms (23 ± 1°C) on 12 hour light/dark cycles and provided access to standard laboratory chow and water ad libitum. Mice acclimated for 1 – 2 weeks in the animal facility before experiments started. The Institutional Animal Care and Use Committee at the United States Environmental Protection Agency facilities in Research Triangle Park, NC approved all animal procedures in this study.
Exposures, plethysmography, and ventilation data analysis
Mice were acclimated to whole-body plethysmography chambers (Buxco Electronics, Sharon, CT) the day before exposure at room temperature for 1 hour. On the day of exposure, exposed once for 180 minutes to filtered air (FA), 0.3 ppm, or 3.0 ppm acrolein in whole body plethysmography chambers (Fig. 1). Mice were placed in the exposure chamber 30 minutes before beginning exposures and allowed to acclimate. Plethysmography data was recorded using Biosystem XA software version 2.11 (Wilmington, NC, USA) from 5 minutes prior to the onset of exposure through the end of the 180 minute exposure period (185 minutes of total data). We normalized ventilation data collected during the first 30 minutes of exposure to the data collected during the 5 minute baseline immediately prior to exposure because the greatest changes in ventilation occurred during the first 30 minutes of exposure before stabilizing. The specific parameters analyzed were breathing frequency, tidal volume, minute volume, inspiratory time, expiratory time, expiratory/inspiratory time ratio, and area under the curve (AUC) of minute volume during exposure. The AUC analysis of minute volume for the entire 3 hour exposure was used to quantify total inhaled volume so that the effective doses of acrolein in the acrolein exposure groups could be calculated. The effective dose of acrolein for each mouse was calculated by dividing the product of the volume inhaled during exposure and the ppm value of acrolein (inhaled volume × ppm) by body mass.
Figure 1. Acrolein exposure system.
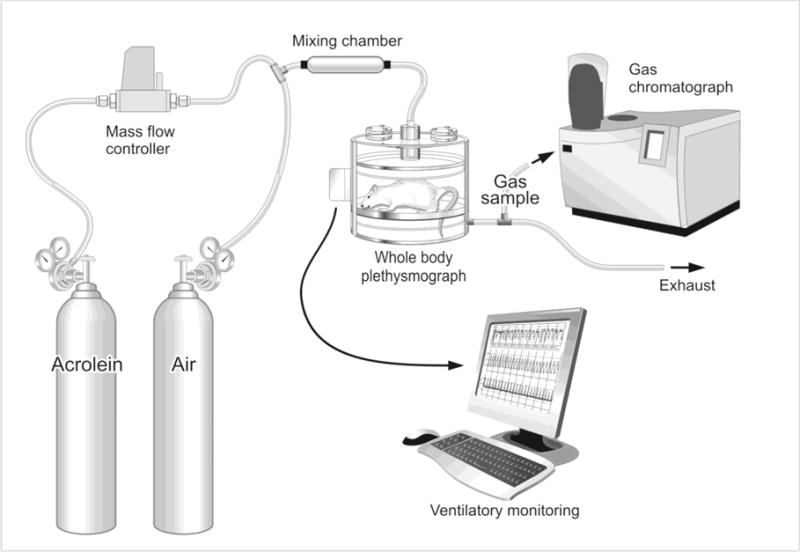
A mass flow controller regulated gas flow from a cylinder of acrolein to achieve concentrations of 0.3 or 3.0 ppm in a mixing chamber containing medical grade filtered air. The gas mixture was then delivered to each mouse in a whole body plethysmography chamber while ventilatory parameters were monitored and recorded on a computer. Gas samples from the plethysmography chambers were collected from a gas sampling port on the exhaust lines and acrolein concentrations verified by gas chromatography.
Depilation
More than one hour prior to the baseline Echo-HF assessments, we sedated mice with 2% – 3% isoflurane (Isothesia, Henry Schein™ Animal Health, Dublin, OH, USA) and applied depilatory cream (Nair™, Church & Dwight Co., Inc., Ewing, NJ, USA) to the left parasternal region of the thorax. Fur was removed and the depilatory cream was gently wiped away using clean gauze pads. Mice were anesthetized for about 5 minutes during depilation and were then allowed to recover for a minimum of one hour before making the first echocardiographic assessments.
High-frequency echocardiography
The sonographer was blinded to exposure group information of mice during data collection. Echo-HF data was collected at 40 MHz with a Vevo® 2100 ultrasound and an MS550D transducer (FujiFilm VisualSonics Inc., Toronto, Canada). Echo-HF data was collected 1 day prior to exposure (Exp − 24 hrs), 1 hour after exposure (Exp + 1 hr), and 24 hours after exposure (Exp + 24 hr). For Echo-HF assessments, mice were induced and maintained under light isoflurane anesthesia using 1.5%-3% isoflurane diluted with medical grade oxygen supplied constantly at 0.8 – 1.0 L/min. We controlled for anesthesia depth by targeting heart rates to 450 beats/minute and respiratory rates to 70 breaths/minute. Mice were placed on a heated Vevo® Mouse Handling Table (FujiFilm VisualSonics Inc.) in dorsal recumbency with their paws grounded to electrodes using Electrode Crème (Cat# 600-0001-01-S, Indus Instruments, Webster, TX, USA) for physiological monitoring/recording of electrocardiogram, heart rate, and respiration rate. We set the heated surface of the Vevo® Mouse Handling Table to 38°C surface to support mouse core temperature. Similar thermoregulatory support has been demonstrated to effectively maintain mouse body temperature at 35°C for up to 30 minutes during isoflurane anesthesia [16]. Eye lubricant was applied to prevent ocular drying. Mice were scanned from the parasternal short axis view of the left ventricle at the level of the papillary muscles using B-mode and M-mode imaging and from the apical 4-chamber view for pulsed wave Doppler measurements of transmitral blood flow. We collected 3 cineloops from each view for data analysis. Considering anesthesia induction, data collection, and recovery, each mouse was anesthetized for ~15 minutes at each experimental time-point.
Echocardiographic analysis
Echo-HF data analyses were also performed while blinded to exposure group information for each mouse. Short axis B-mode cineloops were used to analyze wall deformation in the lateral and anterior free walls of the left ventricle via speckle tracking echocardiography (STE) using VevoStrain™ software (FujiFilm VisualSonics Inc.). Peak circumferential strain, peak diastolic circumferential strain-rate, and contractile synchrony between the lateral wall and the anterior free wall of left ventricular endocardium were evaluated. The time that elapsed between peak strain in the lateral and anterior free walls was reported as circumferential strain “delay” (see Fig. 2, panels A, B, and C). For STE data, two beats from each of three cineloops were analyzed yielding a total of 6 beats analyzed per mouse at each time-point. With the remaining Echo-HF data, we analyzed two groups of 3 beats between breaths from each of the three cineloops collected. This yielded a total of 18 beats analyzed per mouse at each time-point. We used Vevo® LAB software version 1.7.0 (FujiFilm VisualSonics Inc.) to analyze data collected via pulsed wave Doppler of transmitral flow in order to determine isovolumic contraction time (IVCT), aortic ejection time (AET), and isovolumic relaxation time (IVRT)(see Fig. 2, panels D, E, and F). The Tei index of myocardial performance was calculated with the following equation: (IVCT+IVRT)/AET. Short axis M-mode loops were used to determine stroke volume (SV), cardiac output (CO), ejection fraction (EF), fractional shortening, end diastolic volume (EDV), and end systolic volume (ESV) using Vevo® LAB software (FujiFilm VisualSonics Inc.). We also analyzed the durations of QRS in the electrocardiograms recorded during Echo-HF data collection by placing digital calipers across the QRS complex of 9 heartbeats within the M-mode analysis for each mouse, at each time-point.
Figure 2. Primary echocardiographic endpoints.
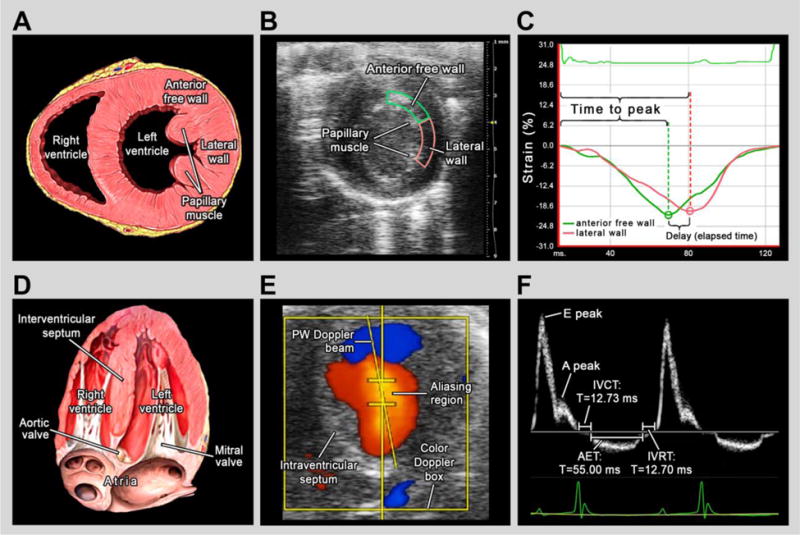
Panels A – C illustrate the derivation of circumferential strain delay and panels D – F describe the derivation of Tei index (myocardial performance). (A) Schematic of a mouse heart oriented in the short axis view at the level of the papillary muscles, modified from Lynch (2006) [36]. The regions of the anterior free wall and lateral wall are denoted. (B) Representative image of echocardiographic short-axis view from the study with the anterior free wall endocardium outlined in green and the lateral wall endocardium outlined in pink. (C) Software output for speckle-strain analysis depicting circumferential strain in the anterior free wall endocardium (green) and the lateral wall endocardium (pink). Delay was calculated as the difference in time to peak strain between the two regions or the time that elapsed between the occurrences of peak strain in the two regions. For reporting (%Cardiac Cycle), the ms value of strain delay was then converted to a percent of the cardiac cycle. (D) Schematic of a mouse heart oriented in the apical 4-chamber view, modified from Lynch (2006) [37]. Because Tei index is derived using transmitral blood flow, the mitral and aortic valves are denoted. (E) Representative image of echocardiographic apical 4-chamber view with simultaneous color Doppler imaging and pulsed wave Doppler placement. During data collection from the apical view, the pulsed wave Doppler beam was placed in the region of highest velocity flow (aliasing region) identified using color Doppler. (F) Tracing of pulsed wave Doppler measurements of transmitral blood flow. Tei was calculated by dividing the sum of the isovolumic contraction time (IVCT) and isovolumic relaxation time (IVRT) by aortic ejection time (AET).
Necropsy, bronchoalveolar lavage (BAL), and BAL fluid analyses
Mice were deeply anesthetized with an intraperitoneal injection of Euthasol (200 mg/kg Na+ pentobarbital 25 mg/kg phenytoin; Virbac Animal Health, Fort Worth, TX, USA) immediately following final Echo-HF assessments (i.e. Exp + 24 hr). Body mass and tibial length were noted. Upon cessation of deep pain reflexes, a thoracotomy was conducted and the trachea was cannulated. The right lung was lavaged with a total volume of 1 ml of fresh HBSS (#14175, Gibco®, Life Technologies, Grand Island, NY, USA) divided into two equal aliquots. Cell differentials from lavaged cell samples and cytospins were determined by counting 300 cells per mouse. We quantified BAL fluid total protein (#1856209, Thermo Fisher Diagnostics, Rockford, IL, USA), albumin (#86098; DiaSorin, Inc., Stillwater, MN, USA), lactate dehydrogenase (LDH)(#TR20015, Thermo Fisher Diagnostics), N-acetyl-β-D-glucosaminidase (NAG)(#10875406001, Roche Diagnostics, Indianapolis, IN, USA), superoxide dismutase (SOD)(#SD125, Randox Laboratories-US, Ltd., Kearneysville, WV, USA) and total antioxidant status (TAS)(#2332, Randox Laboratories-US, Ltd.). Glutathione peroxidase (GPX) and glutathione transferase (GTR) were quantified as previously described [17].
Statistics
All data are reported as mean ± SD or boxplots with all data points shown. Box edges mark the interquartile range, the middle line marks the median, the “+” marks the mean, and the whiskers mark the minimum and maximum data values. Data were graphed and analyzed with Graphpad Prism 6 software (La Jolla, CA, USA). One-way ANOVA with Tukey’s post-test and multiplicity adjusted p-values were conducted on ventilatory data (Fig. 3), calculated inhaled volumes/effective doses (Fig. 4), and BAL cellular/fluid protein data (Suppl. Tables SI and SII). Two-way repeated measures ANOVA with Tukey’s post-test and multiplicity adjusted p-values were conducted on all Echo-HF data across exposure groups and time-points (Table I, Fig. 5, and Fig. 6). In Fig. 3, 4, 5, and 6 the p-values are reported for comparisons with potentially meaningful differences. In Suppl. Fig. S2 we plotted EDV vs. ESV from each exposure group and fit each data plot with a linear regression and tested for correlation and change in slope across concentration and time-point. Correlation p-values are reported and significant changes in slope are identified (Fig. S2). In all data tables and Fig. S2 significant differences are denoted for p < 0.05 across the same time-point with * vs. FA and † vs. 0.3 ppm Acrolein; and within treatment group with ‡ vs. Exp − 24 hr and # vs. Exp + 1 hr.
Figure 3. Acrolein exposure at 3.0 ppm altered Ventilation.
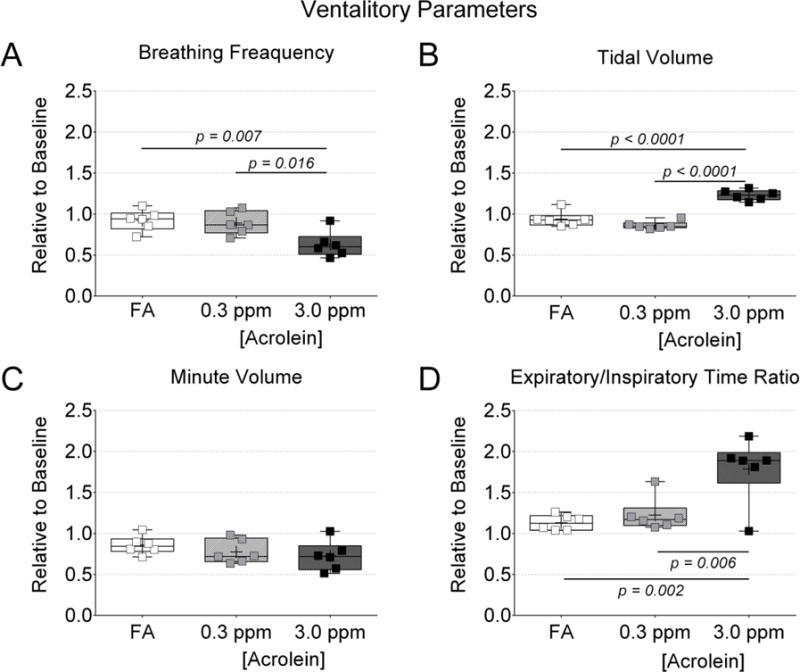
Ventilation data collected during the first 30 minutes of exposure were normalized to ventilation data collected during the 5 minutes prior to exposure. (A) Breathing frequency. (B) Tidal volume. (C) Minute volume. (D) Expiratory/inspiratory time ratio. Data were compared by one-way ANOVA (Tukey’s post-test) and the p-values of potentially meaningful differences are provided.
Figure 4. Decreased inhaled volume with 3.0 ppm acrolein impacted effective dose.
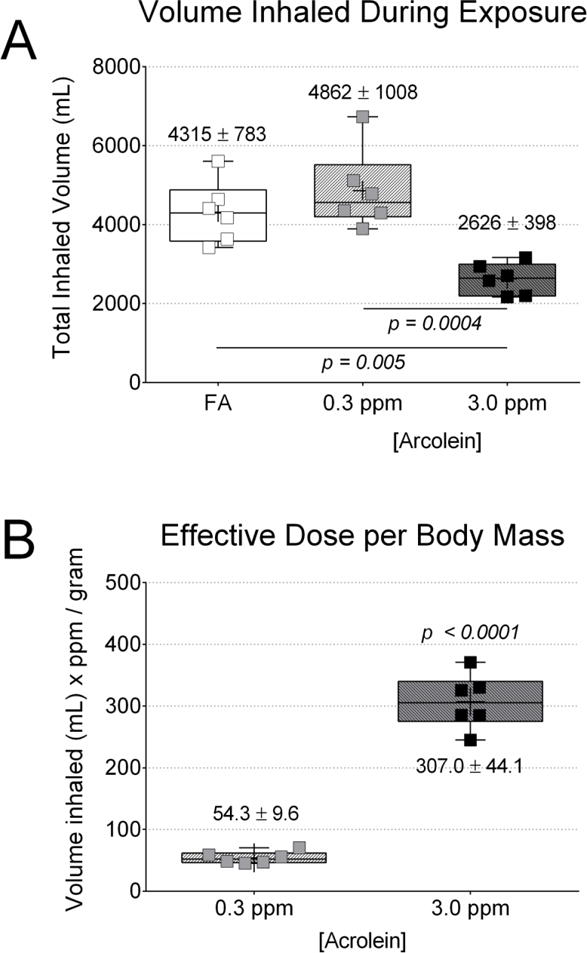
Area under the curve (AUC) analysis to minute volume was used to quantify total inhaled volume in order to estimate the effective dose of acrolein in the 0.3 and 3.0 ppm exposure groups. The relative decrease in inhaled volume in the 3.0 ppm group prevented the effective dose from being 10-fold greater than the dosing with 0.3 ppm acrolein. (A) Total inhaled volume of air during the 30 minute baseline and the 180 minute exposure period. (B) Estimated effective acrolein dose based on body mass in grams. Data were compared by one-way ANOVA (Tukey’s post-test) across exposure group (A) or t-test across acrolein concentration (B). The p-values for potentially meaningful differences are provided.
Table I.
Echocardiographic Data
| Filtered Air (FA) | 0.3 ppm Acrolein | 3.0 ppm Acrolein | ||||||||
|---|---|---|---|---|---|---|---|---|---|---|
| −24 hours | +1 hour | +24 hours | −24 hours | +1 hour | +24 hours | −24 hours | +1 hour | +24 hours | ||
| M-mode Cardiac Function Analysis (mean ± SD, n=6) | ||||||||||
| HR | BPM | 475 ± 42 | 487 ± 36 | 484 ± 27 | 473 ± 24 | 449 ± 43 | 495 ± 30 | 444 ± 50 | 463 ± 28 | 482 ± 31 |
|
| ||||||||||
| SV | μL | 32.0 ± 5.3 | 33.9 ± 9.7 | 40.9 ± 13 | 32.5 ± 8.7 | 35.5 ± 6.0 | 35.2 ± 7.7 | 35.3 ± 3.4 | 36.1 ± 6.6 | 47.2 ± 15‡# |
|
| ||||||||||
| CO | mL/min | 15.1 ± 3.3 | 15.9 ± 4.5 | 19.8 ± 6.6 | 15.4 ± 4.4 | 15.9 ± 3.5 | 17.3 ± 3.7 | 15.3 ± 2.0 | 16.3 ± 2.5 | 22.4 ± 7.2‡# |
|
| ||||||||||
| EF | % | 54.9 ± 6.7 | 54.7 ± 7.4 | 59.1 ± 13.6 | 50.3 ± 6.5 | 57.7 ± 10.3 | 60.2 ± 9.0 | 61.2 ± 7.6 | 65.8 ± 11.6 | 67.6 ± 8.1 |
|
| ||||||||||
| FS | % | 28.1 ± 4.3 | 28.1 ± 4.9 | 32.7 ± 5.9 | 25.3 ± 4.1 | 30.2 ± 6.8 | 31.8 ± 6.0 | 32.4 ± 5.0 | 35.9 ± 10.1 | 37.3 ± 6.4 |
|
| ||||||||||
| EDV | μL | 59.3 ± 8.7 | 62.4 ± 17 | 65.6 ± 18 | 64.2 ± 13.5 | 62.1 ± 8.8 | 58.7 ± 9.7 | 58.3 ± 10 | 55.3 ± 8.3 | 58.5 ± 7.8 |
|
| ||||||||||
| ESV | μL | 28.6 ± 4.3 | 28.3 ± 9.7 | 24.7 ± 7.5 | 31.7 ± 7.1 | 26.7 ± 8.4 | 23.4 ± 6.5 | 23.2 ± 8.3 | 19.2 ± 7.7 | 18.8 ± 4.5 |
|
| ||||||||||
| QRS Dur | ms | 8.14 ± 0.16 | 8.26 ± 0.36 | 8.22 ± 0.43 | 8.33 ± 0.49 | 8.60 ± 0.24 | 8.25 ± 0.42 | 8.22 ± 0.72 | 8.34 ± 0.77 | 8.36 ± 0.71 |
|
| ||||||||||
| Circumferential Strain Analysis (mean ± SD, n=6) | ||||||||||
| HR | BPM | 465 ± 33 | 478 ± 43 | 487 ± 26 | 463 ± 27 | 457 ± 46 | 497 ± 31 | 436 ± 51 | 460 ± 26 | 483 ± 31 |
|
| ||||||||||
| Delay | %CC | 2.8 ± 1.8 | 4.9 ± 3.4 | 2.9 ± 1.7 | 6.4 ± 4.7 | 5.9 ± 2.1 | 5.5 ± 4.5 | 3.5 ± 2.7 | 10.1 ± 6.0*‡ | 8.2 ± 2.0*‡ |
|
| ||||||||||
| Pk Strain | % | −18.4 ± 3.2 | -20.4 ± 3.9 | -21.8 ± 3.1 | -19.3 ± 3.7 | -20.4 ± 3.4 | -20.5 ± 5.8 | -21.0 ± 1.8 | -19.8 ± 5.1 | -19.4 ± 3.9 |
|
| ||||||||||
| TPk Strain | %CC | 50.6 ± 6.1 | 51.8 ± 5.3 | 47.3 ± 5.3 | 47.1 ± 3.7 | 50.3 ± 4.7 | 48.4 ± 3.0 | 47.4 ± 7.8 | 49.5 ± 4.7 | 48.5 ± 3.5 |
|
| ||||||||||
| Pk DSR | 1/Sec | 8.1 ± 2.3 | 9.0 ± 2.5 | 8.6 ± 1.7 | 7.5 ± 2.5 | 9.2 ± 1.2 | 9.3 ± 2.2 | 8.4 ± 1.4 | 8.3 ± 2.0 | 8.8 ± 2.5 |
|
| ||||||||||
| TPk DSR | %CC | 68.2 ± 4.8 | 66.2 ± 9.1 | 66.5 ± 4.3 | 65.4 ± 3.5 | 67.0 ± 6.8 | 67.7 ± 4.3 | 63.8 ± 4.6 | 67.1 ± 2.9 | 67.2 ± 3.7 |
|
| ||||||||||
| Myocardial Performance Analysis (mean ± SD, n=6) | ||||||||||
| HR | BPM | 469 ± 54 | 445 ± 25 | 478 ± 38 | 487 ± 42 | 429 ± 47‡ | 481 ± 39# | 422 ± 50† | 437 ± 36 | 464 ± 18 |
|
| ||||||||||
| Tei | None | 0.32 ± 0.03 | 0.33 ± 0.06 | 0.34 ± 0.05 | 0.31 ± 0.04 | 0.4 ± 0.06*‡ | 0.39 ± 0.07‡ | 0.33 ± 0.02 | 0.36 ± 0.05 | 0.38 ± 0.02 |
|
| ||||||||||
| IVCT | %CC | 5.5 ± 1.2 | 6.4 ± 1.4 | 7.8 ± 2.5‡ | 5.9 ± 2.3 | 7.7 ± 2.7 | 8.1 ± 2.2‡ | 5.8 ± 0.9 | 7.0 ± 1.3 | 6.9 ± 1.4 |
|
| ||||||||||
| AET | %CC | 38.8 ± 3.1 | 39.9 ± 3.1 | 40.4 ± 2.3 | 40.7 ± 5.0 | 39.5 ± 5.3 | 37.3 ± 3.3 | 37.6 ± 4.8 | 40.0 ± 4.2 | 38.6 ± 2.4 |
|
| ||||||||||
| IVRT | %CC | 6.9 ± 2.0 | 6.5 ± 1.0 | 6.1 ± 0.5 | 6.8 ± 0.6 | 7.8 ± 2.7 | 6.3 ± 1.0 | 6.5 ± 0.6 | 7.4 ± 1.4 | 7.9 ± 1.1 |
Across the same time-point see
for p<0.05 vs FA; and
for p<0.05 vs. 0.3 ppm Acrolein; Within treatment group see
for p<0.05 vs. −24 hour; and
for p<0.05 vs. +1 hour
HR – heart rate; SV – stroke volume; CO – cardiac output; EF – ejection fraction; FS – fractional shortening; EDV – end diastolic volume; ESV – end systolic volume; QRS Dur – QRS duration; Pk – peak; TPk – time to peak; DSR – Diastolic strain–rate; IVCT – isovolumic contraction time; IVRT – isovolumic relaxation time; AET – aortic ejection time; BPM – beats/min; %CC – percent of the cardiac cycle
Figure 5. Acrolein inhalation at 3.0 ppm increased strain delay.
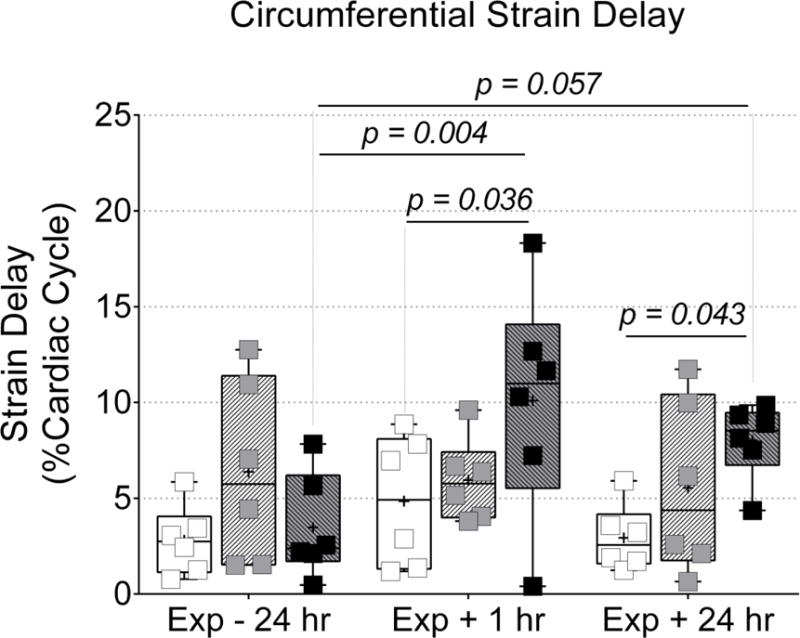
Echocardiography was used to evaluate left ventricular mechanical synchrony. Inhalation of acrolein at 3.0 ppm increased circumferential strain delay between the lateral and anterior free walls at 1 and 24 hours after exposure when compared to Exp − 24 hr and/or time-matched FA group. Data were compared via two-way ANOVA (Tukey’s post-test) across exposure group and time-point and the p-values for potentially meaningful differences are provided.
Figure 6. Acrolein inhalation at 0.3 ppm increased Tei index of myocardial performance.
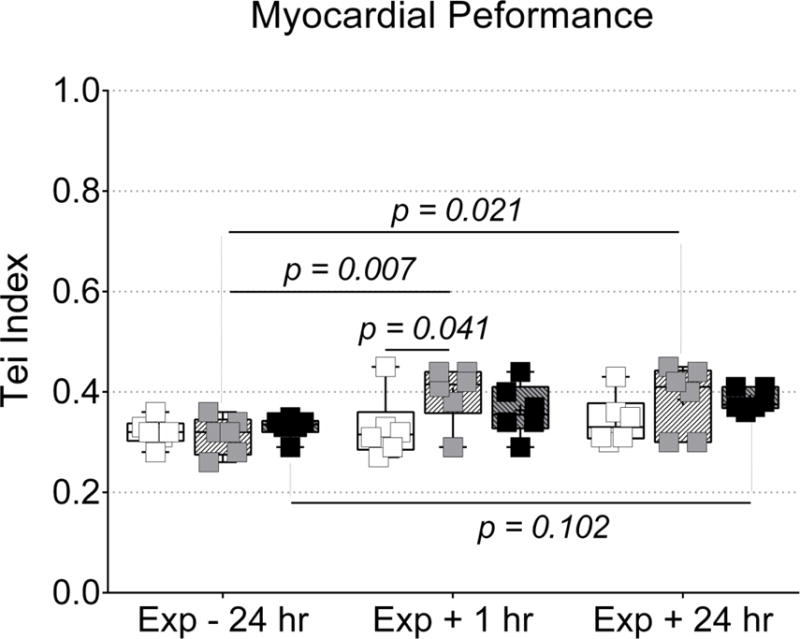
Echocardiography was used to evaluate global left ventricular myocardial performance. Inhalation of acrolein at 0.3 ppm increased Tei index in the left ventricle at 1 after exposure when compared to Exp − 24 hr and FA, and at 24 hours after exposure when compared to Exp − 24 hr. Data were compared via two-way ANOVA (Tukey’s post-test) across exposure group and time-point and the p-values for potentially meaningful differences are provided.
Results
Effect of acrolein exposure on ventilatory parameters
Breathing patterns changed the most during the first 30 minutes of acrolein exposure and then stabilized (Suppl. Fig. S1). Fig. 3 shows changes in several ventilation parameters during the first 30 minutes of exposure relative to the values recorded during the 5 minutes before exposure. In Fig. 3A we found that exposure to acrolein at 3.0 ppm decreased breathing frequency (down 37% ± 16% from baseline, p < 0.05) and that breathing frequency did not change significantly with exposure to FA or acrolein at 0.3 ppm. In Fig. 3B, only acrolein exposure at 3.0 ppm caused an increase in tidal volume (up 23% ± 6% from baseline, p < 0.05). By contrast, mice exposed to 0.3 ppm acrolein or FA actually demonstrated a mean decrease (i.e. opposite direction) in tidal volume from baseline, though they were not statistically significant (down −14% ± 5% and −6% ± 9%, respectively). In Fig. 3C, we report no statistically significant changes in minute volume (i.e. minute ventilation) during the first 30 minutes of exposure compared to baseline. In Fig. 3D, the expiratory to inspiratory time ratio was increased with exposure to acrolein at 3.0 ppm compared to baseline (up by 79% ± 39%, p < 0.05) but neither 0.3 ppm acrolein nor FA affected the ratio of expiratory to inspiratory time significantly.
Total inhaled volume and effective dose of acrolein
When the full 3 hour exposure period was examined, inhalation of acrolein at 3.0 ppm decreased total inhaled volume by 46% and 40% compared to the 0.3 ppm acrolein and FA groups, respectively (Fig. 4A), regardless of the slight difference in minute volume reported during the first 30 minutes of exposure in Fig. 3C. Despite the 10-fold higher concentration of acrolein in 3.0 ppm compared to 0.3 ppm, the effective dose of acrolein was only about 5.7-fold higher per unit body mass (Fig. 4B). We verified this result by normalizing effective dose to tibia length (another indicator of body size) instead of body mass and found a similar result (5.3-fold higher vs. 5.7-fold higher).
Bronchoalveolar lavage fluid markers of inflammation
In Suppl. Table SI, lymphocytes were the only cell type significantly increased in the lungs of mice exposed to acrolein at 3.0 ppm (43.8 ± 55.24 cells/mL × 102) compared to mice exposed to 0.3 ppm acrolein (5.83 ± 1.60 cells/mL × 102) or FA (17.0 ± 9.30 cells/mL × 102). Total cell, neutrophil, and eosinophil counts did not differ among exposure groups. In Suppl. Table SII, GPX levels (IU/μL) were also significantly increased in BAL fluid collected from mice exposed to 3.0 ppm acrolein (158 ± 33) when compared to the mice exposed to 0.3 ppm acrolein (121 ± 7), but not FA (130 ± 10). There were no differences in BAL total protein, LDH, NAG, SOD (Total, Mn, and CuZn), TAS, albumin, and GTR. Though not significantly different, LDH in BAL fluid trended toward a dose-response pattern across exposure groups, increasing with acrolein concentration.
Cardiac function from M-mode data
All echocardiographic data are reported in Table I. We attempted to regulate heart rate during isoflurane anesthesia and, as such, have provided heart rates for each echocardiographic endpoint. During M-mode analysis of function, heart rates were not significantly different but did trend upward with time in mice following exposure to acrolein at 3.0 ppm, which could have affected SV and CO (product of heart rate and SV). As heart rate increases SV would be predicted to decrease due to reduced filling time, but we found that SV was elevated (p < 0.05) in mice 24 hours following exposure to acrolein at 3.0 ppm when compared to Exp − 24 hr and Exp + 1 hr. CO, was also elevated (p < 0.05) in mice 24 hours after exposure to acrolein at 3.0 ppm when compared to Exp − 24 hr and Exp + 1 hr. ESV, EDV, EF, fractional shortening, and QRS duration were not different between groups, but EF and fraction shortening trended upward following exposure to acrolein at 0.3 and 3.0 ppm.
Left ventricular mechanical synchrony
Regional circumferential strain delay (Fig. 5) was assessed via STE as an indicator intraventricular myocardial synchrony in the endocardium of the left ventricle. Strain delay increased (p < 0.05) in mice exposed to 3.0 ppm acrolein at 1 hour after exposure (10.1% ± 6.0%) when compared to 24 hours before exposure (3.5% ± 2.7%), and strain delay in mice 1 hour after exposure to FA (4.9% ± 3.4%). Strain delay was also increased in mice 24 hours after exposure to 3.0 ppm acrolein (8.2%± 2.0%) when compared to strain delay in mice 24 hours after exposure to FA (2.9% ± 1.7%). No changes in regional strain delay were detected in mice exposed to 0.3 ppm acrolein. This was likely due to elevated strain delay in 2 mice from the 0.3 ppm acrolein group, 24 hours before exposure. Those mice also had the highest values for strain delay at both post-exposure time-points. It should also be noted that the increased strain delay following exposure to 3.0 ppm was not explained by any evidence of abnormal intraventricular conduction times, which we assessed by measuring QRS complex duration in the electrocardiograms recorded during echocardiography (see Table I). Heart rates, average peak strain, time-to-peak strain, peak diastolic strain-rate, and time-to-peak diastolic strain-rate were not significantly different between groups during STE analysis.
Left ventricular myocardial performance
Interestingly, despite data indicating that exposure to 3.0 ppm acrolein resulted in mechanical dyssynchrony, we only found a slight corresponding increase (not statistically significant) in Tei index (Fig. 6). However, we did find that Tei index was significantly elevated (p < 0.05) in mice 1 hour after exposure to acrolein 0.3 ppm (0.40 ± 0.06) when compared to 24 hr before exposure (0.31 ± 0.04) and Tei index in mice 1 hour after exposure to FA (0.33 ± 0.06). Tei index was also elevated 24 hours after exposure to 0.3 ppm acrolein (0.39 ± 0.07) when compared to 24 hr before exposure (0.31 ± 0.04), but did not differ significantly from the Tei index in the FA group, 24 hours post-exposure (0.34 ± 0.05). The components of Tei index (IVCT, IVRT and AET) and corresponding heart rates are also provided in Table I. IVCT was significantly elevated in mice 24 hours after exposure to 0.3 ppm acrolein when compared to Exp − 24 hr, despite a very similar heart rate across both time-points. AET and IVRT were not significantly different between groups but AET did trend downward following exposure to acrolein at 0.3 ppm, which would support the increase in Tei index. While there were some significant differences in heart rates during Tei index analysis, they appeared to be random and did not provide any explanation for changes in Tei index or IVCT. It is also important to note that the identification of Tei index components from transmitral flow data can be quite subjective. To ensure reproducible calculation of Tei, we conducted a blinded re-evaluation of Tei index from 9 different transmitral flow cineloops from the study (all 3 time-points from 3 mice) and found <10% coefficient of variability when compared to Tei index values from the initial analysis.
Discussion
The major findings from this study are the first to show that a single 3-hour exposure to inhaled acrolein in mice increases specific markers of cardiac mechanical dysfunction in vivo, specifically myocardial dyssynchrony and Tei performance index. Surprisingly, the findings also suggest that the resulting manifestation of myocardial dyssynchrony or lower performance is dependent on the exposure concentration of acrolein. First, mice exposed to acrolein at 3.0 ppm had significant increases in circumferential strain delay across the lateral and anterior free walls of the left ventricle at 1 and 24 hours after exposure, an effect not found in mice exposed to acrolein at 0.3 ppm (Fig. 5). Our second key finding was that mice exposed to acrolein at 0.3 ppm demonstrated a significant increase in Tei index at 1 and 24 hours following exposure, indicating a global decrease in myocardial performance (Fig. 6). Unexpectedly, mice exposed to acrolein at 3.0 ppm did not have a statistically significant increase in Tei index, despite the presence of regional myocardial dyssynchrony. It is possible that exposure to acrolein at 3.0 ppm and/or aberrant ventricular synchronicity induced global contractile compensation that was capable of decreasing the calculated Tei index. Such an explanation would seem to be supported by the increased SV found 24 hours after exposure to acrolein at 3.0 ppm and the upward trend in EF.
Several possible mechanisms could explain myocardial dyssynchrony following acrolein inhalation, which may primarily include altered autonomic activity. Firstly, acrolein is an upper airway irritant [3] and our previous studies strongly support that inhalation of acrolein at 3.0 ppm affects autonomic regulation of cardiac function [7, 8, 18]. Secondly, altered autonomic outflow can present challenges for maintaining myocardial synchrony. As evidence suggests, regional autonomic innervation of the myocardium is variably distributed [19] and autonomic dysfunction can result in simultaneous co-activation of parasympathetic and sympathetic outflow to the heart [20]. Regional sympathetic denervation has been also linked to left ventricular dyssynchrony [21] and differential blockade or stimulation of either the left or right stellate ganglion can result in ventricular dyssynchrony and regional alterations of myocardial contractility [22, 23]. Lastly, autonomic innervation of coronary arteries is also variably distributed [24] and if coronary resistance is influenced by changes in autonomic tone, variable blood supply/demand mismatching could promote regional cardiac ischemia. In fact, left ventricular strain and contractile dyssynchrony are used as indicators of clinical and subclinical myocardial ischemia [25, 26] and other heart diseases [27], and air pollution exposure has been linked to ischemic heart disease [1]. These mechanisms could be investigated in future studies by including control groups that receive 1) blockade of the left stellate ganglia to reproduce the results without acrolein exposure; and/or 2) acrolein exposure groups that receive either β-blockers or partial vagotomy in order to prevent/rescue the autonomic effects.
Despite evident dyssynchrony, the maintenance of Tei index and EF following inhalation of 3.0 ppm acrolein, may be a result of compensatory responses related to activation of the autonomic nervous system. For example, while myocardial dyssynchrony is usually associated with left ventricular dysfunction [21], myocardial dyssynchrony has also been reported in heart failure patients with preserved EF [28]. In the case of healthy mice exposed to acrolein, it seems reasonable to predict that regional left ventricular dyssynchrony would momentarily compromise EF, SV, and CO. However, regional modulation of myocardial contraction (i.e. compensation) could restore SV and CO, bringing indices of global contractility (primarily reflected in EF) back to baseline. Such a response could also drive the calculated Tei index back toward baseline. In addition, ESV and EDV were proportional and positively correlated in the FA group at all time-points and in both acrolein groups prior to exposure (Supplemental Fig. S2). Then after acrolein exposure to either concentration, ESV and EDV became less proportional, and at 24 hours after 3.0 ppm acrolein exposure, ESV and EDV were no longer correlated. Coupled together, these findings indicate the possible presence of positive inotropic, chronotropic, and lusitropic signals. Specifically, decreased ESV despite stable EDV (increased SV) indicate positive inotropy. Heart rates were slightly elevated following exposure to 3.0 ppm acrolein suggesting increased chronotropy. The maintenance of EDV despite relatively higher heart rates, and thus shorter filling times, also suggests positive lusitropy. Cardiac chronotropy, inotropy, and lusitropy can all be regulated by the autonomic nervous system and changes in all 3 supports the possibility that acrolein inhalation at 3.0 ppm elicits autonomic-mediated responses.
The increase in Tei index following exposure to acrolein at 0.3 ppm could result from declining systolic function, declining diastolic function, increased systemic blood pressure, or combinations of all three. The data for IVRT in Table I did not seem to support any evidence for diastolic dysfunction within any groups. In the 0.3 ppm acrolein group, the IVCT data was significantly elevated at Exp + 24 hr compared to Exp − 24 hr and occurred in conjunction with decreases in AET (though not significantly). Altered cardiomyocyte Ca2+ handling could result in a decline of systolic myocardial performance, which could both increase IVCT and decrease AET. To the contrary, we did not report any other indicators of declining systolic function in the 0.3 ppm acrolein group. Alternatively, an increase in systemic blood pressure could also increase IVCT and decrease AET. Though we did not measure systemic blood pressure in this study, our laboratory has previously reported that inhalation of acrolein at 3.0 ppm in rats increased systemic blood pressure in a carotid body-dependent manner [18] and desensitized baroreflexes [8]. Altered activity of the carotid body and baroreceptor neurological pathways can cause impaired autonomic regulation of systemic arterial pressure, which may provide the best explanation for the increase in Tei index following exposure to 0.3 ppm acrolein, along with the upward trends in CO and EF.
Another novel element of our study is how the pulmonary/ventilatory data fits with the findings on cardiac mechanical function. For example, the decreased myocardial performance following exposure to acrolein at 0.3 ppm was found despite having found no evidence of pulmonary toxicity or changes in pulmonary function accompanying the exposure. Conversely, exposure to 3.0 ppm acrolein decreased ventilation during the first 30 minutes of exposure in a manner consistent with expiratory flow limitations. The divergence in ventilatory responses between acrolein exposure at 0.3 and 3.0 ppm may also underlie the divergence in cardiac responses between the two groups. For example, we have previously demonstrated that in addition to reducing ventilatory rate, 3.0 ppm acrolein caused a reduction in arterial PO2 and an increase in PCO2 [18]. We did not measure blood gases in the present study but it stands to reason that the drop in ventilation that we documented with exposure to acrolein at 3.0 ppm would impact blood gases similarly to that in our previous report. If so, altered PO2 and PCO2 ratios would affect blood pH and activate the carotid bodies, increasing sympathetic outflow [29]. The resulting increase in sympathetic drive would place the cardiovascular system of mice exposed to acrolein at 3.0 ppm under autonomic influences unique from mice exposed to acrolein at 0.3 ppm, which provides another rational for unique responses between acrolein exposure concentrations in our study.
Lastly, our finding that ventilation is reduced during exposure to acrolein at 3.0 ppm may indicate an effort to moderate the magnitude of acrolein dose during exposure [30]. The effective dose of acrolein was derived from the total volume of gas inhaled by each mouse during 3 hour exposure, multiplied by the ppm of acrolein, and normalized to the mass of the mouse. Although exposure to 3.0 ppm or 0.3 ppm acrolein did not yield a statistically significant change in minute ventilation during the first 30 minutes of exposure, the small difference in average minute volume when aggregated over the total 3 hour exposure period produced a significant decrease in total inhaled volume during exposure to 3.0 ppm acrolein. As a consequence, the expected 10-fold higher dose of acrolein at 3.0 ppm was reduced to an effective dose that was only 5.7-fold higher than the effective dose received with exposure to acrolein at 0.3 ppm. To improve our insight into the degree of pulmonary damage that may have contributed to the cardiovascular findings in our study, we included the investigation and report of bronchoalveolar lavage fluid differential cell counts and biochemical analyses. We found evidence that exposure to acrolein at 3.0 ppm resulted in increased levels of GPX and lymphocytes in the BAL fluid collected 24 hours after exposure (see supplemental material), despite the ability of mice exposed to acrolein at 3.0 ppm to minimize total acrolein exposure with reduced ventilation. The increased levels of GPX and lymphocytes in the BAL fluid are consistent with the knowledge that acrolein exposure is known to causes oxidative and inflammatory responses in the respiratory tract [31].
The findings from our study were subject to several experimental limitations. One drawback to echocardiography is that the analyses can be subject to interpretation bias. To minimize this the sonography and analyses were conducted while blinded to treatment groups, and reproducibility was evaluated in a subset of the sonograms. Echocardiographic assessment in rodents also necessitates use of short-term anesthesia or physical restraint, both of which can confound cardiovascular responses. The echocardiographic data in the present study was collected under light isoflurane anesthesia. Isoflurane has been reported to cause depression of cardiac contractility in dogs [32, 33] and rabbits [34], although effects are presumed to be consistent across all experimental exposure groups in the present study in mice. To minimize variability related to differences in anesthesia level, we attempted to maintain the heart rate of each mouse near 450 beats/minute and respiration rate near 70 breaths/minute. In several instances heart rate did drop significantly during scans from the apical view for Tei index measurements, which was conducted last in the order of scans (see bottom section of Table I). This only occurred in the 0.3 ppm acrolein group, +1 hour after exposure and 3.0 ppm acrolein group, −24 hours before exposure. Despite the depressive effects of isoflurane, a recent study found that isoflurane anesthesia is superior to physical restraint and injectable anesthetics for echocardiographic assessment [35]. Another caveat in our study was that we only evaluated myocardial dyssynchrony in one region of the heart wall and not across the entire left ventricle. Thus, the potential for acrolein inhalation to affect myocardial synchrony in other segments of the heart wall is unclear. Also, the elevated circumferential strain delay in the 0.3 ppm acrolein group during pre-exposure assessments made it difficult to detect changes in strain delay following exposure. Because two mice in the 0.3 ppm acrolein group with the largest delay before exposure always had the largest delay afterwards, their elevated delay may have been related to some undefined intrinsic factors unique to those mice. However, those two mice were not found to be statistical outliers and were kept in the study.
In conclusion, our results demonstrate for the first time that exposure to a level of acrolein that does not elicit ventilatory responses can cause small, yet significant changes in myocardial performance. The increase in Tei index following inhalation of 0.3 ppm acrolein was not suggestive of a robust detrimental cardiac pathology, but rather represent small shifts in global cardiovascular function. The increased circumferential strain delay found after exposure to 3.0 ppm acrolein may have been compensated for by increased left ventricular performance. While these findings may have limited impact acutely, in the setting of longer-term or repeated exposures, continuation of such compensatory responses could promote a myocardial substrate vulnerable to the development of cardiac pathology. Thus, analyses of myocardial synchrony and performance in rodents using echocardiography may be useful in screening other pollutants for cardiac effects. The findings also suggest that air pollution constituents, such as acrolein, may predispose individuals to small changes in myocardial function that contribute to short-term subclinical and even clinical effects, perhaps more so in individuals with pre-existing conditions like heart failure or cardiac ischemia. Finally, this study provides a rationale to incorporate analysis of myocardial strain delay and Tei index into human environmental health studies in order to assess the possible short-term effects of air pollutants on cardiac mechanical function.
Supplementary Material
Acknowledgments
We would like to acknowledge John Havel for his outstanding effort generating the illustrations in Fig. 1 and Fig. 2. Judy Richards at U.S. EPA conducted the Konelab assays on the BAL fluid samples. Finally, we would like to thank Dr. Ian Gilmour, Dr. Jan Dye, and Dr. Chris Gordon of the U.S. EPA for their thorough review of this manuscript before submission.
Footnotes
Disclaimer: This paper has been reviewed and approved for release by the National Health and Environmental Effects Research Laboratory, U.S. Environmental Protection Agency. Approval does not signify that the contents necessarily reflect the views and policies of the U.S. Environmental Protection Agency, nor does mention of trade names or commercial products constitute endorsement or recommendation for use.
References
- 1.Brook RD, Rajagopalan S, Pope CA, 3rd, Brook JR, Bhatnagar A, Diez-Roux AV, Holguin F, Hong Y, Luepker RV, Mittleman MA, Peters A, Siscovick D, Smith SC, Jr, Whitsel L, Kaufman JD, American Heart Association Council on, E., Prevention, C.o.t.K.i.C.D., Council on Nutrition, P.A. and Metabolism Particulate matter air pollution and cardiovascular disease: An update to the scientific statement from the American Heart Association. Circulation. 2010;121:2331–2378. doi: 10.1161/CIR.0b013e3181dbece1. [DOI] [PubMed] [Google Scholar]
- 2.Moghe A, Ghare S, Lamoreau B, Mohammad M, Barve S, McClain C, Joshi-Barve S. Molecular mechanisms of acrolein toxicity: relevance to human disease. Toxicol Sci. 2015;143:242–255. doi: 10.1093/toxsci/kfu233. [DOI] [PMC free article] [PubMed] [Google Scholar]
- 3.EPA. Toxicological Review of Acrolein (CAS No 107-02-8) US Environmental Protection Agency; Washington, DC: 2003. [Google Scholar]
- 4.ATSDR. Toxicological Profile for Acrolein. U.S. Department of Health and Human Services, Public Health Service; Atlanta, GA: 2007. [Google Scholar]
- 5.Haussmann HJ. Use of hazard indices for a theoretical evaluation of cigarette smoke composition. Chem Res Toxicol. 2012;25:794–810. doi: 10.1021/tx200536w. [DOI] [PubMed] [Google Scholar]
- 6.DeJarnett N, Conklin DJ, Riggs DW, Myers JA, O'Toole TE, Hamzeh I, Wagner S, Chugh A, Ramos KS, Srivastava S, Higdon D, Tollerud DJ, DeFilippis A, Becher C, Wyatt B, McCracken J, Abplanalp W, Rai SN, Ciszewski T, Xie Z, Yeager R, Prabhu SD, Bhatnagar A. Acrolein exposure is associated with increased cardiovascular disease risk. J Am Heart Assoc. 2014;3 doi: 10.1161/JAHA.114.000934. [DOI] [PMC free article] [PubMed] [Google Scholar]
- 7.Perez CM, Ledbetter AD, Hazari MS, Haykal-Coates N, Carll AP, Winsett DW, Costa DL, Farraj AK. Hypoxia stress test reveals exaggerated cardiovascular effects in hypertensive rats after exposure to the air pollutant acrolein. Toxicol Sci. 2013;132:467–477. doi: 10.1093/toxsci/kft008. [DOI] [PMC free article] [PubMed] [Google Scholar]
- 8.Hazari MS, Griggs J, Winsett DW, Haykal-Coates N, Ledbetter A, Costa DL, Farraj AK. A single exposure to acrolein desensitizes baroreflex responsiveness and increases cardiac arrhythmias in normotensive and hypertensive rats. Cardiovasc Toxicol. 2014;14:52–63. doi: 10.1007/s12012-013-9228-9. [DOI] [PubMed] [Google Scholar]
- 9.Luo J, Hill BG, Gu Y, Cai J, Srivastava S, Bhatnagar A, Prabhu SD. Mechanisms of acrolein-induced myocardial dysfunction: implications for environmental and endogenous aldehyde exposure. Am J Physiol Heart Circ Physiol. 2007;293:H3673–3684. doi: 10.1152/ajpheart.00284.2007. [DOI] [PubMed] [Google Scholar]
- 10.Wang L, Sun Y, Asahi M, Otsu K. Acrolein, an environmental toxin, induces cardiomyocyte apoptosis via elevated intracellular calcium and free radicals. Cell Biochem Biophys. 2011;61:131–136. doi: 10.1007/s12013-011-9169-5. [DOI] [PubMed] [Google Scholar]
- 11.Wu Z, He EY, Scott GI, Ren J. alpha, beta-Unsaturated aldehyde pollutant acrolein suppresses cardiomyocyte contractile function: Role of TRPV1 and oxidative stress. Environ Toxicol. 2015;30:638–647. doi: 10.1002/tox.21941. [DOI] [PubMed] [Google Scholar]
- 12.Stypmann J, Engelen MA, Troatz C, Rothenburger M, Eckardt L, Tiemann K. Echocardiographic assessment of global left ventricular function in mice. Lab Anim. 2009;43:127–137. doi: 10.1258/la.2007.06001e. [DOI] [PubMed] [Google Scholar]
- 13.Dandel M, Lehmkuhl H, Knosalla C, Suramelashvili N, Hetzer R. Strain and strain rate imaging by echocardiography – basic concepts and clinical applicability. Curr Cardiol Rev. 2009;5:133–148. doi: 10.2174/157340309788166642. [DOI] [PMC free article] [PubMed] [Google Scholar]
- 14.Thavendiranathan P, Poulin F, Lim KD, Plana JC, Woo A, Marwick TH. Use of myocardial strain imaging by echocardiography for the early detection of cardiotoxicity in patients during and after cancer chemotherapy: a systematic review. J Am Coll Cardiol. 2014;63:2751–2768. doi: 10.1016/j.jacc.2014.01.073. [DOI] [PubMed] [Google Scholar]
- 15.Tei C, Ling LH, Hodge DO, Bailey KR, Oh JK, Rodeheffer RJ, Tajik AJ, Seward JB. New index of combined systolic and diastolic myocardial performance: a simple and reproducible measure of cardiac function–a study in normals and dilated cardiomyopathy. J Cardiol. 1995;26:357–366. [PubMed] [Google Scholar]
- 16.Caro AC, Hankenson FC, Marx JO. Comparison of thermoregulatory devices used during anesthesia of C57BL/6 mice and correlations between body temperature and physiologic parameters. J Am Assoc Lab Anim Sci. 2013;52:577–583. [PMC free article] [PubMed] [Google Scholar]
- 17.Jaskot RH, Charlet EG, Grose EC, Grady MA, Roycroft JH. An automated analysis of glutathione peroxidase, S-transferase, and reductase activity in animal tissue. J Anal Toxicol. 1983;7:86–88. doi: 10.1093/jat/7.2.86. [DOI] [PubMed] [Google Scholar]
- 18.Perez CM, Hazari MS, Ledbetter AD, Haykal-Coates N, Carll AP, Cascio WE, Winsett DW, Costa DL, Farraj AK. Acrolein inhalation alters arterial blood gases and triggers carotid body-mediated cardiovascular responses in hypertensive rats. Inhal Toxicol. 2015;27:54–63. doi: 10.3109/08958378.2014.984881. [DOI] [PMC free article] [PubMed] [Google Scholar]
- 19.Shen MJ, Zipes DP. Role of the autonomic nervous system in modulating cardiac arrhythmias. Circ Res. 2014;114:1004–1021. doi: 10.1161/CIRCRESAHA.113.302549. [DOI] [PubMed] [Google Scholar]
- 20.Paton JF, Boscan P, Pickering AE, Nalivaiko E. The yin and yang of cardiac autonomic control: vago-sympathetic interactions revisited. Brain Res Brain Res Rev. 2005;49:555–565. doi: 10.1016/j.brainresrev.2005.02.005. [DOI] [PubMed] [Google Scholar]
- 21.Gimelli A, Liga R, Genovesi D, Giorgetti A, Kusch A, Marzullo P. Association between left ventricular regional sympathetic denervation and mechanical dyssynchrony in phase analysis: a cardiac CZT study. Eur J Nucl Med Mol Imaging. 2014;41:946–955. doi: 10.1007/s00259-013-2640-3. [DOI] [PubMed] [Google Scholar]
- 22.Schlack W, Schafer S, Thamer V. Left stellate ganglion block impairs left ventricular function. Anesth Analg. 1994;79:1082–1088. doi: 10.1213/00000539-199412000-00010. [DOI] [PubMed] [Google Scholar]
- 23.Schlack W, Thamer V. Unilateral changes of sympathetic tone to the heart impair left ventricular function. Acta Anaesthesiol Scand. 1996;40:262–271. doi: 10.1111/j.1399-6576.1996.tb04430.x. [DOI] [PubMed] [Google Scholar]
- 24.Sequeira IM, Haberberger RV, Kummer W. Atrial and ventricular rat coronary arteries are differently supplied by noradrenergic, cholinergic and nitrergic, but not sensory nerve fibres. Ann Anat. 2005;187:345–355. doi: 10.1016/j.aanat.2005.05.003. [DOI] [PubMed] [Google Scholar]
- 25.Reant P, Labrousse L, Lafitte S, Bordachar P, Pillois X, Tariosse L, Bonoron-Adele S, Padois P, Deville C, Roudaut R, Dos Santos P. Experimental validation of circumferential, longitudinal, and radial 2-dimensional strain during dobutamine stress echocardiography in ischemic conditions. J Am Coll Cardiol. 2008;51:149–157. doi: 10.1016/j.jacc.2007.07.088. [DOI] [PubMed] [Google Scholar]
- 26.Winter R, Jussila R, Nowak J, Brodin LA. Speckle tracking echocardiography is a sensitive tool for the detection of myocardial ischemia: a pilot study from the catheterization laboratory during percutaneous coronary intervention. J Am Soc Echocardiogr. 2007;20:974–981. doi: 10.1016/j.echo.2007.01.029. [DOI] [PubMed] [Google Scholar]
- 27.Marwick TH. Measurement of strain and strain rate by echocardiography: ready for prime time? J Am Coll Cardiol. 2006;47:1313–1327. doi: 10.1016/j.jacc.2005.11.063. [DOI] [PubMed] [Google Scholar]
- 28.Lee AP, Zhang Q, Yip G, Fang F, Liang YJ, Xie JM, Lam YY, Yu CM. LV mechanical dyssynchrony in heart failure with preserved ejection fraction complicating acute coronary syndrome. JACC Cardiovasc Imaging. 2011;4:348–357. doi: 10.1016/j.jcmg.2011.01.011. [DOI] [PubMed] [Google Scholar]
- 29.Perez CM, Hazari MS, Farraj AK. Role of autonomic reflex arcs in cardiovascular responses to air pollution exposure. Cardiovasc Toxicol. 2015;15:69–78. doi: 10.1007/s12012-014-9272-0. [DOI] [PMC free article] [PubMed] [Google Scholar]
- 30.Ghilarducci DP, Tjeerdema RS. Fate and effects of acrolein. Rev Environ Contam Toxicol. 1995;144:95–146. doi: 10.1007/978-1-4612-2550-8_2. [DOI] [PubMed] [Google Scholar]
- 31.Moretto N, Volpi G, Pastore F, Facchinetti F. Acrolein effects in pulmonary cells: relevance to chronic obstructive pulmonary disease. Ann N Y Acad Sci. 2012;1259:39–46. doi: 10.1111/j.1749-6632.2012.06531.x. [DOI] [PubMed] [Google Scholar]
- 32.Pagel PS, Nijhawan N, Warltier DC. Quantitation of volatile anesthetic-induced depression of myocardial contractility using a single beat index derived from maximal ventricular power. J Cardiothorac Vasc Anesth. 1993;7:688–695. doi: 10.1016/1053-0770(93)90054-o. [DOI] [PubMed] [Google Scholar]
- 33.Hatakeyama N, Ito Y, Momose Y. Effects of sevoflurane, isoflurane, and halothane on mechanical and electrophysiologic properties of canine myocardium. Anesth Analg. 1993;76:1327–1332. doi: 10.1213/00000539-199376060-00025. [DOI] [PubMed] [Google Scholar]
- 34.Palmisano BW, Mehner RW, Stowe DF, Bosnjak ZJ, Kampine JP. Direct myocardial effects of halothane and isoflurane. Comparison between adult and infant rabbits. Anesthesiology. 1994;81:718–729. doi: 10.1097/00000542-199409000-00026. [DOI] [PubMed] [Google Scholar]
- 35.Lairez O, Lonjaret L, Ruiz S, Marchal P, Franchitto N, Calise D, Fourcade O, Mialet-Perez J, Parini A, Minville V. Anesthetic regimen for cardiac function evaluation by echocardiography in mice: comparison between ketamine, etomidate and isoflurane versus conscious state. Lab Anim. 2013;47:284–290. doi: 10.1177/0023677213496236. [DOI] [PubMed] [Google Scholar]
- 36.Lynch PJ, Jaffe CC. Heart normal short axis section. Creative Commons; New Haven, CT: 2006. [Google Scholar]
- 37.Lynch PJ, Jaffe CC. Heart apical 4c anatomy. Creative Commons; New Haven, CT: 2006. [Google Scholar]
Associated Data
This section collects any data citations, data availability statements, or supplementary materials included in this article.