Abstract
Background
In 2012, a new Knee Society Knee Scoring System (KSS) was developed and validated to address the needs for a scoring system that better encompasses the expectations, satisfaction, and physical involvement of a younger, more active population of patients undergoing TKA. Revalidating this tool in a separate population by individuals other than the developers of the scoring system seems important, because such replication would tend to confirm the generalizability of this tool.
Questions/purposes
The purposes of this study were (1) to validate the KSS using a separate sample of patients undergoing primary TKA; and (2) to evaluate the internal consistency of the KSS.
Methods
Intervention and control groups from a randomized controlled trial with no between-group differences were pooled. Preoperative and postoperative (6 weeks and 1 year) data were used. Patients with osteoarthritis undergoing primary TKA completed the patient-reported component of the KSS, Knee Injury and Osteoarthritis Outcome Score (KOOS), SF-12, two independent questions about expectations of surgery, and the Patient Acceptable Symptom State (PASS) single-question outcome. This study included 345 patients with 221 (64%) women, an average (SD) age of 64 (8.6) years, a mean (SD) body mass index of 32.9 (7.5) kg/m2, and 225 (68%) having their first primary TKA. Loss to followup in the control group was 18% and loss to followup in the intervention group was 13%. We quantified cross-sectional (preoperative scores) and longitudinal validity (pre- to postoperative change scores) by evaluating associations between the KSS and KOOS subscales using Spearman’s correlation coefficient. Preoperative known-group validity of the KSS symptoms and functional activity score was evaluated with a one-way analysis of variance across three levels of physical health status using the SF-12 Physical Component Score. Known-group validity of the KSS expectation score was evaluated with an unpaired t-test by comparing means across known expectation groups. Known-group validity of the KSS satisfaction score was evaluated with an unpaired t-test by comparing means across yes/no response groupings of the PASS single-question outcome. Internal consistency for each KSS subscale was evaluated with Cronbach’s α.
Results
Cross-sectional validity (ie, associations at a single point in time) was supported because correlation coefficients between KSS symptoms, functional activities, and satisfaction scores and scores on the KOOS pain subscale ranged from 0.60 to 0.73 (all correlations p < 0.01). Values were similar for associations with the KOOS function in the activities of daily living (ADL) subscale (0.66-0.69) and less (0.41-0.58) for correlations with the other three KOOS subscales. Longitudinal validity (ie, associations of change scores between two time points) was also supported because correlation coefficients between KSS symptoms, functional activities, and satisfaction change scores and the KOOS pain and ADL change scores varied from 0.63 to 0.73. Correlation coefficients were lower for the other three KOOS subscale change scores, suggesting a weaker relationship with KOOS symptoms (0.48-0.53), sports (0.47-0.51), and quality of life (0.60-0.65) (all correlations p < 0.01). Known-group validity (ie, differences between groups that are known to differ on a given characteristic) was confirmed by between-group differences for the symptoms and functional activities score comparisons as well as the comparisons with the expectations and satisfaction scores of the KSS (all p < 0.01). Cronbach’s α (ie, association among subscale items) varied from 0.68 (discretionary activities) to 0.94 (postoperative expectations) across four KSS subscales.
Conclusions
Moderate-sized correlation coefficients and consistent differences between known groups support the validity of the KSS. Internal consistency values were also acceptable. The patient-reported subscales of the KSS are a valid and internally consistent outcome assessment for TKA.
Introduction
The Knee Society Clinical Rating System was developed in 1989 to rate patients’ functional abilities before and after TKA [6]. It has been useful for tracking and reporting both total and partial knee arthroplasties globally [14]. Over time, uncertainties and insufficiencies with the original tool have emerged questioning its utility and validity with current patients undergoing TKA [14] and revision TKA [5]. In 2012, a new Knee Society Knee Scoring System (KSS) was introduced to meet the need for a scoring system that better characterizes the expectations, satisfaction, and physical activities of a current, younger, and more varied population of patients undergoing TKA [8]. The long form [8, 14] is recommended for research and the short form is expected to increase the rate of completion in clinical use [15].
Validity and internal consistency are two essential components in the evaluation of a measurement tool. Validity is the extent to which an instrument measures what it was intended to measure. Internal consistency describes the relationship among items in a given questionnaire. Validity and internal consistency are not all-or-nothing phenomena. When similar findings are gathered on two individually collected samples of a target population, it enhances the generalizability of the tool and provides greater certainty about the results through consistency. In 2012 the KSS was a new tool [8] at the time our study was undertaken. Revalidating this tool and confirming the internal consistency of this tool in a separate population by individuals other than the developers of the scoring system seem important, because such replication would tend to confirm the generalizability of this tool.
We therefore sought (1) to validate the KSS in a sample of patients undergoing primary TKA; and (2) to evaluate the internal consistency of the KSS.
Patients and Methods
The data are from a randomized controlled trial (RCT) designed to determine if exposure to an e-learning tool affected postoperative patient expectations and satisfaction after TKA. The patient population for this study came from a doctoral dissertation that has not been published. Details of the RCT were registered and approved at ClinicalTrials.gov (NCT01732562).
We screened 835 patients; 416 (50%) of the patients were randomized to the control group (n = 207) or the intervention group (n = 209) (Fig. 1). Within the control group, two patients did not undergo TKA, 19 did not complete their preoperative questionnaire, and eight did not complete any of the postoperative questionnaires at 6 weeks, 3 months, and 1 year. Loss to followup in the control group was 18%. Within the intervention group, two patients did not undergo TKA, two patients were ineligible, they did not provide an email, 25 did not complete their preoperative questionnaire, and 13 did not complete any of the postoperative questionnaires at 6 weeks, 3 months, and 1 year. Loss to followup in the intervention group was 13%.
Fig. 1.
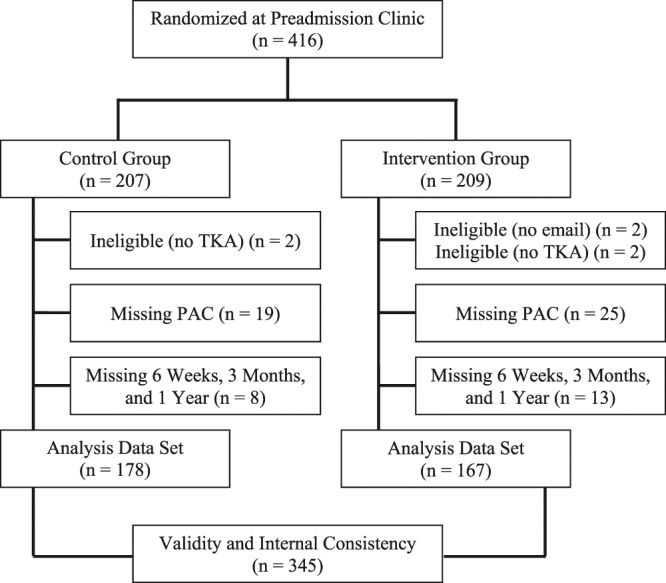
This flow diagram illustrates patient enrollment, randomization, and pooled analysis. PAC = preadmission clinic.
Data were collected on patients undergoing primary TKA under the care of one of seven orthopaedic surgeons (JH, BL, SM, JM, RM, DN, EV at the Joint Replacement Institute, London Health Sciences Centre, University Hospital, London, Canada). Patients diagnosed with osteoarthritis scheduled to undergo primary TKA were recruited at the preadmission clinic from April 2013 to April 2014. To be considered for participation, patients had to be > 20 years of age, booked for an elective primary TKA, and of sound cognitive capacity to give informed consent. We excluded patients who were undergoing revision TKA, patellar resurfacing, hemi- or unicompartmental (unicondylar) knee arthroplasty, high tibial osteotomy, or knee surgery to address a tumor. We randomized patients using a web-based system stratified by surgeon and by first or second TKA. The study was approved by the Health Sciences Research Ethics Board at Western University, London, Canada.
There were 345 patients in this study. Control (n = 178) and intervention (n = 167) groups were pooled (Fig. 1). This was a suitable group for the purposes of the current study because the baseline demographic profile of our study sample was similar to the sample for the prototype instrument used in Noble et al. [8]. We believed it was reasonable to pool the patients together for this study; although there were 10% more females in the control group, the other characteristics were well balanced between groups. Of the 345 patients included in this study, the majority were female (59% intervention; 69% control), had a mean age of 63 years, a mean body mass index of 33 kg/m2, and were undergoing their first primary TKA (66% intervention, 69% control). Additionally, both groups were similar with respect to their preoperative patient-reported outcome measures (PROMs). Overall, patients expected that their TKA would substantially reduce their pain (83% intervention, 84% control), allow them to return to activities of daily living (78% intervention, 76% control), and recreational activities (74% intervention, 65% control). Preoperative patient satisfaction was low with few patients satisfied with their present state before surgery (14% intervention, 11% control).
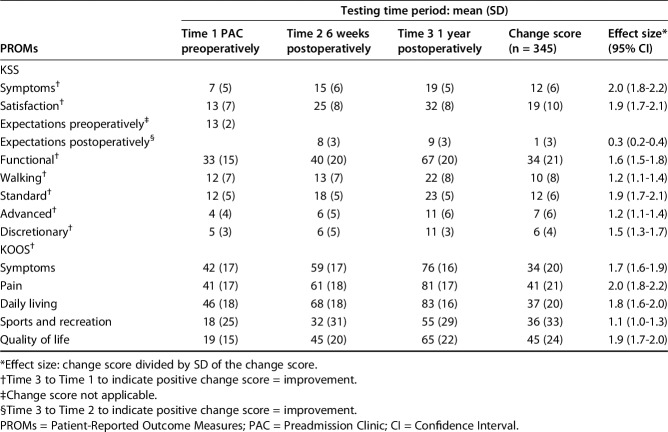
Baseline demographic characteristics (Table 1) and preoperative PROMs (Table 2) were collected at the preadmission clinic visit, Time 1. Postoperative PROMs were completed at the scheduled consultation time periods of 6 weeks (Time 2) and 1 year (Time 3) after surgery (Table 2).
Table 1.
Preoperative demographics collected at Time 1 (n = 345)
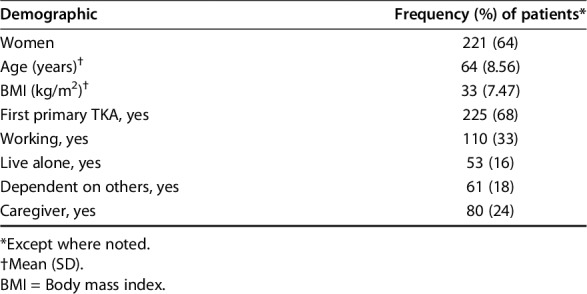
Table 2.
The new Knee Society Score (KSS) and the Knee Injury and Osteoarthritis Outcome Score (KOOS) PROMs are reported for each consultation time period
Patients completed all patient-reported components of the KSS (long form) [8], the Knee Injury and Osteoarthritis Outcome Score (KOOS) [12, 13], the SF-12 Health Survey [17], two independent questions (preoperative and postoperative) about their expectations of surgery [3, 10], and the Patient Acceptable Symptom State (PASS) satisfaction single-question outcome [16]. The KSS (long form) was designed to be a comprehensive patient- and surgeon-reported scoring system for TKA recipients [14]. The patient-reported subscales evaluate pain relief, functional abilities (ie, walking and standing, standard, advanced and discretionary activities), satisfaction, and fulfillment of expectations [8, 14]. The KOOS is a PROM composed of five subscales; pain, other symptoms, function in activities of daily living (ADL), function in sport and recreation (Sport/Rec), and knee-related quality of life [12, 13]. The SF-12 Health Survey asks patients questions on their views about their health. Physical and Mental Health Component scores are calculated using selected values from the 12 questions [17]. Expectation questionnaires were completed both pre- and postoperatively. The preoperative expectation questionnaire addressed four expectation constructs asking about patient expectations for pain relief, ability to perform ADL, ability to participate in sports, and expectations for global recovery from surgery [10]. Our postoperative expectation questionnaire provided patients with the response options that their expectations were “met” or “not met/had no expectations” [3]. The PASS was a single-question outcome that asked, “Considering all of the activities you do during your daily life, your level of pain, and also your functional impairment, do you consider that your current state is satisfactory?” (Response options were “yes” or “no.”) [16]
Mean KSS and KOOS values over the testing time period showed improvement in both the KSS subscales and the KOOS subscale scores from the preoperative time period to 1 year postoperatively (Table 2).
Statistical Analysis
Our sample size exceeded the minimum required sample size of 189 for identifying correlation coefficients of 0.60 with a confidence interval width of 0.20 (α = 0.05) [2]. Descriptive statistics were expressed as means or frequencies, as appropriate. All change scores were calculated so positive values represented improvement for patients.
Cross-sectional convergent validity (that is, determining whether a measure displays a converging or predictive relationship at a single point in time) was determined at Time 1 (preoperative). Longitudinal convergent validity (that is, determining whether a measure displays a converging or predictive relationship over several points in time) was determined between Time 1 (preoperative) or Time 2 (6 weeks postoperatively) and Time 3 (1 year postoperatively). These two forms of validity were evaluated with Spearman’s rank order correlation coefficient as a measure of the strength of the relationship among the different scales and subscales in the KSS and the KOOS [12, 13].
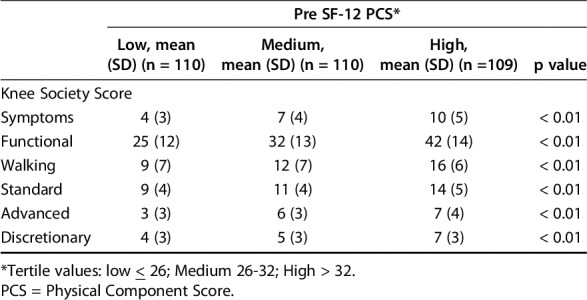
We also determined known-group validity (ie, the ability to discriminate between two or more groups that differ on a given characteristic). At Time 1 (preoperative), we compared the KSS scores for symptoms and functional activities across three tertiles (low, medium, high) of the SF-12 Physical Component Score (PCS) using a one-way analysis of variance and post hoc Tukey’s comparisons [9, 18].
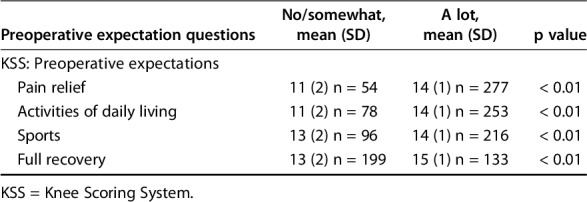
We also compared the KSS preoperative expectations score across response categories of our preoperative expectation question [10]. Response options for this question were grouped as “no/somewhat” indicating low expectations and “a lot” indicating high expectations. A between-group difference was tested with an unpaired t-test.
Furthermore, we compared the KSS postoperative expectations score (Time 3 [1 year postoperatively]) across response categories of our postoperative expectations question that determined whether postoperative expectations were “met” or “not met/had no expectations” [3]. This is important because patients undergoing TKA have expectations about this procedure and meeting their expectations is believed to be associated with their satisfaction of TKA. A between-group difference was tested with an unpaired t-test.
Finally, we compared the KSS satisfaction subscale score across response categories of the PASS, a single-question outcome [16]. A between-group difference was tested with an unpaired t-test.
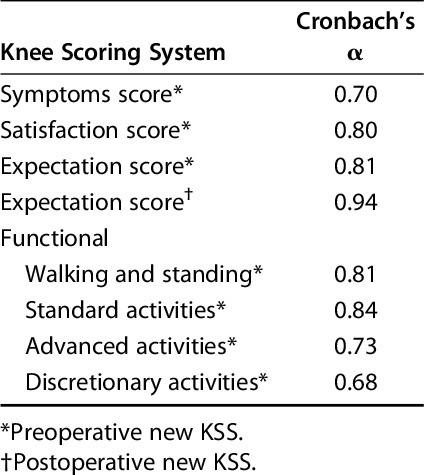
We calculated Cronbach’s α [4, 11] values for Time 1 (preoperative) of the KSS preoperative symptoms, satisfaction, expectations, and functional activity subscales (walking and standing, standard, advanced, and discretionary activities) and at Time 3 (1 year postoperatively) for the KSS postoperative expectations subscale. This illustrated how related each set of questionnaire items was as a subscale.
Statistical significance was set at α < 0.05. Data analyses were performed using SAS 9.4 (SAS Institute Inc, Cary, NC, USA).
Results
Validity
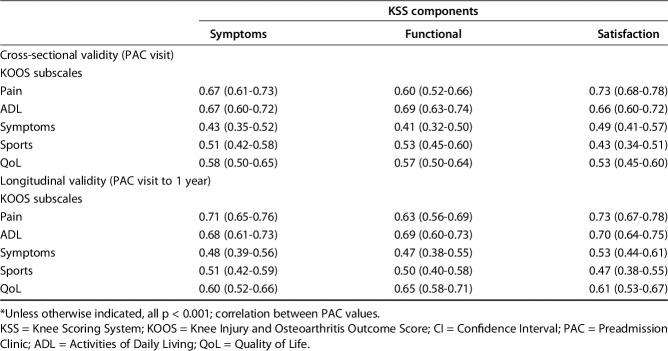
For cross-sectional validity (determining whether a measure displays a converging or predictive relationship at a single point in time), the correlation coefficients varied from 0.60 to 0.73 across the KOOS pain and ADL subscales. Correlation coefficients were lower, ranging from 0.41 to 0.58 across the remaining KOOS subscales (Table 3). A similar pattern was found for longitudinal validity (determining whether a measure displays a converging or predictive relationship over several points in time) (Table 3).
Table 3.
Measures of KSS components and KOOS subscales: Spearman correlation coefficient (95% CI)
For known-group validity (the ability to discriminate between two or more groups that differ on a given characteristic), we looked at the KSS subscale scores across three known groups of physical function as measured by the SF-12 PCS. As SF-12 PCS scores increased (better physical function), the KSS subscale scores also increased (Table 4).
Table 4.
Known-group physical function
When preoperative expectations were low as measured by our single preoperative expectation question, the KSS preoperative expectation subscale scores were also low or worse, and when preoperative expectations were high, the KSS preoperative expectation values were high or better (Table 5).
Table 5.
Known groups for preoperative expectations
When postoperative expectations were low, the KSS postoperative expectations subscale score was low or worse and when postoperative expectations were high, the KSS postoperative subscale score was high or better (Table 6).
Table 6.
Known groups for postoperative expectations

When preoperative satisfaction was absent as measured by our single preoperative satisfaction question, the KSS preoperative satisfaction subscale score was low, indicating worse or low patient satisfaction with the current state and when preoperative satisfaction was present, the KSS preoperative satisfaction values were high, indicating better patient satisfaction with the current state (Table 7).
Table 7.
Known groups for satisfaction

Internal Consistency
Cronbach’s α (the association among subscale items) for the satisfaction construct was 0.80 (Table 8). Similar values were observed for the expectations construct (preoperative: 0.81; postoperative: 0.94). Values for symptoms and the individual scores of the functional activities subscale varied from 0.68 to 0.84. All of these values suggested a satisfactory level of internal consistency for group comparisons [1].
Table 8.
Cronbach's α values for the new Knee Society Knee Scoring System (KSS)
Discussion
The KSS was a new tool developed in 2012. We believed it was important to validate the KSS with a separate sample of TKA recipients from the original sample used by the developers of the tool [8]. This is because comparable findings from two separately gathered samples of a target population would advance the generalizability of a tool.
Limitations
We acknowledge certain limitations. First, data were collected from patients undergoing primary TKA from preoperative to 1 year postoperatively. Therefore, the measurement characteristics of the KSS beyond 1 year are undetermined. Second, there may be a better comparator for the KSS than the KOOS. Perhaps a measure like the Late Life Disability Index [7] may correlate more strongly with the KSS than the KOOS. Finally, we are unaware of any test-retest reliability data published for the KSS tool [14]. This is an important gap because test-retest reliability establishes a measurement tool’s stability over time. This requires different methods than the current study design. We did not evaluate differences between men and women because it was not a focus of this study. We therefore caution the reader not to assume that the results apply equally between the genders. Finally, satisfaction was assessed in a very simple (dichotomous) manner, because this is the response provided by the PASS, a single-question outcome. Patient satisfaction is a complex topic, and future studies might consider this important issue in a more nuanced way.
Validity
Some comparison of the preoperative cross-sectional correlations published by Noble et al. [8] can be made. When comparing the association between the KSS preoperative satisfaction subscale scores and the five KOOS subscales, our correlations varied from 0.43 to 0.73 (Table 3). These values were a similar order of magnitude as those reported by Noble et al. [8] (0.32-0.65). In addition, all comparisons across known-group analyses were in the anticipated direction. These findings add to the work by Noble et al. [8], because they did not evaluate known-group validity.
Internal Consistency
Internal consistency results were similar to those reported by Noble et al. [8]. Satisfaction and expectations subscale scores yielded Cronbach’s α values from 0.80 to 0.94 compared with 0.79 to 0.90 reported by Noble et al. [8]. For the functional subscales, values ranged from 0.68 to 0.84; this compares with 0.68 to 0.88 from Noble et al. [8]. These values suggest an acceptable level of internal consistency for group comparisons [1].
Moderate-sized correlation coefficients and consistent differences between known groups support the validity of the KSS. Internal consistency values were also acceptable. The patient-reported components of the KSS tool are a valid and internally consistent outcome assessment for TKA. The study results support the foundational psychometrics reported by Noble et al. [8]. The KSS can be applied with confidence to all English-speaking populations with patients undergoing primary TKA. Future studies should establish the validity of the KSS beyond 1 year postoperatively and its test-retest reliability.
Acknowledgments
We thank Dr James Howard, Dr Brent Lanting, Dr Steven MacDonald, Dr James McAuley, Dr Richard McCalden, Dr Douglas Naudie, and Dr Edward Vasarhelyi, who together with their staff, were a foundational part of this study.
Footnotes
Financial support provided by a Canadian Orthopaedic Research Legacy Grant (SEC) and Surgery Internal Research Fund, Schulich School of Medicine and Dentistry, UWO (SEC).
All ICMJE Conflict of Interest Forms for authors and Clinical Orthopaedics and Related Research® editors and board members are on file with the publication and can be viewed on request.
Each author certifies that his or her institution approved the human protocol for this investigation and that all investigations were conducted in conformity with ethical principles of research.
This work was performed at Western University, London, Ontario, Canada.
References
- 1.Bland JM, Altman DG. Cronbach's alpha. BMJ. 1997;314:572. [DOI] [PMC free article] [PubMed] [Google Scholar]
- 2.Bonett DG, Wright TA. Sample size requirements for estimating Pearson, Kendall and Spearman correlations. Psychometrika. 2000;65:23–28. [Google Scholar]
- 3.Bourne RB, Chesworth BM, Davis AM, Mahomed NN, Charron KD, Patient satisfaction after total knee arthroplasty: who is satisfied and who is not? Clin Orthop Relat Res. 2010;468:57–63. [DOI] [PMC free article] [PubMed] [Google Scholar]
- 4.Cronbach LJ. Coefficient alpha and the internal structure of tests. Psychometrika. 1951;16:297–334. [Google Scholar]
- 5.Ghanem E, Pawasarat I, Lindsay A, May L, Azzam K, Joshi A, Parvizi J. Limitations of the Knee Society Score in evaluating outcomes following revision total knee arthroplasty. J Bone Joint Surg Am. 2010;92:2445–2451. [DOI] [PubMed] [Google Scholar]
- 6.Insall JN, Dorr LD, Scott RD, Scott WN. Rationale of the Knee Society clinical rating system. Clin Orthop Relat Res. 1989;248:13–14. [PubMed] [Google Scholar]
- 7.Jette AM, Haley SM, Coster WJ, Kooyoomjian JT, Levenson S, Heeren T, Ashba J. Late life function and disability instrument: I. Development and evaluation of the disability component. J Gerontol A Biol Sci Med Sci. 2002;57:M209–216. [DOI] [PubMed] [Google Scholar]
- 8.Noble PC, Scuderi GR, Brekke AC, Sikorskii A, Benjamin JB, Lonner JH, Chadha P, Daylamani DA, Scott WN, Bourne RB. Development of a new Knee Society scoring system. Clin Orthop Relat Res. 2012;470:20–32. [DOI] [PMC free article] [PubMed] [Google Scholar]
- 9.Portney LG, Watkins MP. Foundations of Clinical Research: Applications to Practice. Upper Saddle River, NJ, USA: Pearson Prentice Hall; 2009. [Google Scholar]
- 10.Razmjou H, Finkelstein JA, Yee A, Holtby R, Vidmar M, Ford M. Relationship between preoperative patient characteristics and expectations in candidates for total knee arthroplasty. Physiother Can. 2009;61:38–45. [DOI] [PMC free article] [PubMed] [Google Scholar]
- 11.Reeve BB, Hays RD, Bjorner JB, Cook KF, Crane PK, Teresi JA, Thissen D, Revicki DA, Weiss DJ, Hambleton RK, Liu H, Gershon R, Reise SP, Lai JS, Cella D, PROMIS Cooperative Group. Psychometric evaluation and calibration of health-related quality of life item banks: plans for the Patient-Reported Outcomes Measurement Information System (PROMIS). Med Care. 2007;45:S22–31. [DOI] [PubMed] [Google Scholar]
- 12.Roos EM, Roos HP, Lohmander LS, Ekdahl C, Beynnon BD. Knee Injury and Osteoarthritis Outcome Score (KOOS)–development of a self-administered outcome measure. J Orthop Sports Phys Ther. 1998;28:88–96. [DOI] [PubMed] [Google Scholar]
- 13.Roos EM, Toksvig-Larsen S. Knee injury and Osteoarthritis Outcome Score (KOOS)–validation and comparison to the WOMAC in total knee replacement. Health Qual Life Outcomes. 2003;1:17. [DOI] [PMC free article] [PubMed] [Google Scholar]
- 14.Scuderi GR, Bourne RB, Noble PC, Benjamin JB, Lonner JH, Scott WN. The new Knee Society Knee Scoring System. Clin Orthop Relat Res. 2012;470:3–19. [DOI] [PMC free article] [PubMed] [Google Scholar]
- 15.Scuderi GR, Sikorskii A, Bourne RB, Lonner JH, Benjamin JB, Noble PC. The Knee Society short form reduces respondent burden in the assessment of patient-reported outcomes. Clin Orthop Relat Res. 2016;474:134–142. [DOI] [PMC free article] [PubMed] [Google Scholar]
- 16.Tubach F, Ravaud P, Baron G, Falissard B, Logeart I, Bellamy N, Bombardier C, Felson D, Hochberg M, van der Heijde D, Dougados M. Evaluation of clinically relevant changes in patient reported outcomes in knee and hip osteoarthritis: the minimal clinically important improvement. Ann Rheum Dis. 2005;64:29–33. [DOI] [PMC free article] [PubMed] [Google Scholar]
- 17.Ware J, Jr, Kosinski M, Keller SD. A 12-Item Short-Form Health Survey: construction of scales and preliminary tests of reliability and validity. Med Care. 1996;34:220–233. [DOI] [PubMed] [Google Scholar]
- 18.Winer BJ. Statistical Principles in Experimental Design. Montreal, Quebec, Canada: McGraw-Hill; 1977. [Google Scholar]


