

Summary
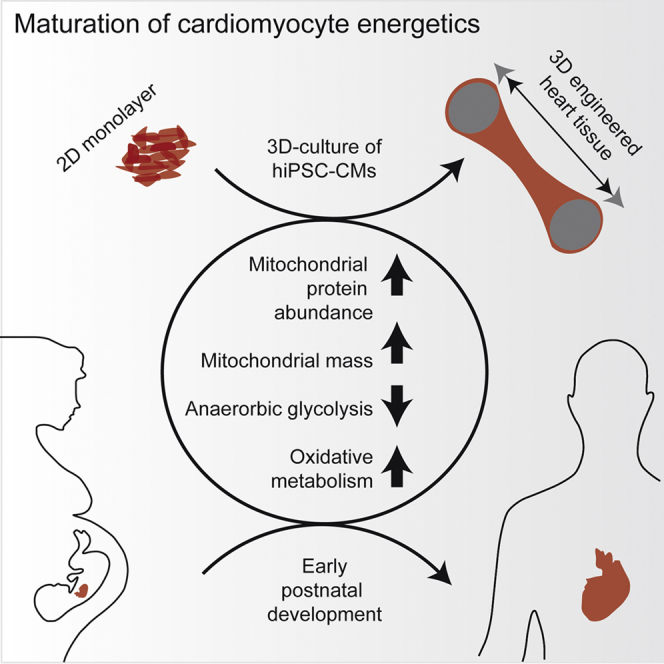
Energy metabolism is a key aspect of cardiomyocyte biology. Human induced pluripotent stem cell-derived cardiomyocytes (hiPSC-CMs) are a promising tool for biomedical application, but they are immature and have not undergone metabolic maturation related to early postnatal development. To assess whether cultivation of hiPSC-CMs in 3D engineered heart tissue format leads to maturation of energy metabolism, we analyzed the mitochondrial and metabolic state of 3D hiPSC-CMs and compared it with 2D culture. 3D hiPSC-CMs showed increased mitochondrial mass, DNA content, and protein abundance (proteome). While hiPSC-CMs exhibited the principal ability to use glucose, lactate, and fatty acids as energy substrates irrespective of culture format, hiPSC-CMs in 3D performed more oxidation of glucose, lactate, and fatty acid and less anaerobic glycolysis. The increase in mitochondrial mass and DNA in 3D was diminished by pharmacological reduction of contractile force. In conclusion, contractile work contributes to metabolic maturation of hiPSC-CMs.
Keywords: human induced pluripotent stem cell-derived cardiomyocytes, engineered heart tissue, developmental hypertrophy, maturation, metabolism
Graphical Abstract
Highlights
-
•
Higher mitochondrial mass, protein, and DNA content in 3D versus 2D hiPSC-CMs
-
•
Similarity of mitochondrial proteomes between 3D hiPSC-CMs and adult human heart
-
•
Preference for oxidative metabolism in favor of anaerobic glycolysis in 3D hiPSC-CMs
Ulmer et al. show that 3D-cultured human iPSC-derived cardiomyocytes replicate metabolic aspects of developmental hypertrophy, indicating maturation of hiPSC-derived cardiomyocytes.
Introduction
Human cardiomyocytes differentiated from induced pluripotent stem cells (hiPSC-CMs) are becoming an important source of human cardiomyocytes for biomedical applications such as preclinical drug testing and disease modeling. However, a current limitation for some of these applications is the immaturity of hiPSC-CMs regarding key parameters such as force of contraction, electrical activity, calcium handling, and metabolism (Denning et al., 2016, Yang et al., 2014a). Enhancing maturation of hiPSC-CMs is therefore a priority in the field. Different approaches including long-term culture (Bhute et al., 2017, Dai et al., 2017, Lundy et al., 2013), maturation media containing compounds such as T3 or fatty acids and others (Birket et al., 2013, Correia et al., 2017, Drawnel et al., 2014, Kim et al., 2013, Mills et al., 2017, Rana et al., 2012, Yang et al., 2014b), overexpression of LET-7 microRNA (Kuppusamy et al., 2015), and electrical pacing during three-dimensional (3D) tissue culture (Nunes et al., 2013) succeeded in improving certain aspects of mitochondrial maturation.
Energy metabolism is a key aspect of cardiomyocyte biology, changing drastically during postnatal development. In non-failing adult hearts, fatty acid is the most important source of ATP production, with a substantial contribution of lactate during physical activity (Lopaschuk and Jaswal, 2010, Quaife-Ryan et al., 2017). Relying heavily on mitochondrial oxidative metabolism to meet their constant energy demand, adult cardiomyocytes have the highest mitochondrial-to-cytoplasmic volume fraction of all cell types and are very sensitive to hypoxia. In fetal cardiomyocytes, in contrast, anaerobic glycolysis is a major contributor to energy supply (Pohjoismäki et al., 2013). Interestingly, in heart failure the metabolism switches to more glucose consumption (Gorski et al., 2015, Shen et al., 1999).
We recently established the hiPSC-CM engineered heart tissue (EHT) model (Mannhardt et al., 2016) based on former studies on neonatal rat and mouse, and human embryonic stem cell-derived CMs in a 3D EHT format (Hansen et al., 2010, Schaaf et al., 2014, Stoehr et al., 2014). In EHT, hiPSC-CMs are embedded in a fibrin-based matrix between flexible silicone posts, enabling spontaneous, coherent, auxotonic contraction and force development. We demonstrated advanced morphological maturation regarding cellular alignment and sarcomeric organization as well as responses to physiological and pharmacological stimuli similar to non-failing human heart tissue (Mannhardt et al., 2016, Uzun et al., 2016). As this suggests an improved maturation status of 3D hiPSC-CMs, we hypothesized that hiPSC-CMs might also develop a higher degree of metabolic maturity in this format, i.e., having less fetal-like glycolysis and more adult-like mitochondrial oxidative metabolism.
To assess this, we compared the metabolic properties of hiPSC-CMs from two established control cell lines cultured in 3D versus two-dimensional (2D) monolayer culture. Our findings suggest that culturing hiPSC-CMs in 3D format improves metabolic maturation and promotes a switch from glycolysis to oxidation, mimicking important metabolic aspects of early postnatal development. These findings will increase the relevance of hiPSC-CMs for drug testing and disease modeling, particularly for diseases associated with alterations in cardiac energetics or mitochondrial abnormalities.
Results
Culture of hiPSC-CMs as 3D Engineered Heart Tissue Improves Mitochondrial Structure
hiPSC lines from two healthy donors were differentiated utilizing an embryoid body (EB)-based protocol (Breckwoldt et al., 2017) (Movie S1). EBs were dissociated into single cells, and differentiation runs consisting of 55%–98% cardiac troponin T-positive hiPSC-CMs were cultured in 40% oxygen in parallel as either 2D monolayer or 3D EHT, respectively (Figure 1A). Phase-contrast microscopy imaging of coherently beating hiPSC-CMs showed the typical irregular alignment of hiPSC-CMs in 2D (Figure 1B and Movie S1) compared with a biconcave shape of hiPSC-CM network in 3D format after 3 weeks of culture (Figure 1C and Movie S1). Figure 1D describes force development of hiPSC-EHTs over time (frequency depicted in Figure S1B). Functional experiments were performed with cell line-, differentiation run-, and age-matched 2D and 3D preparations in parallel between days 21 and 45 of EHT development (box in Figure 1D). Similar cellular composition of 2D and 3D format by the time of functional analysis was determined by qPCR. Figure 1E demonstrates that gene expression for cardiac (MYL3, MYL4, cTNT1), fibroblast (Vimentin, POSTN), and endothelial (CD31) markers were not significantly different between 2D and 3D format (p > 0.05). Transmission electron microscopy (TEM) analysis showed that 3D hiPSC-CMs contained more mitochondria with crisp membrane structures and cristae formation (black arrows in Figures 1F, 1G, and S1C–S1F) compared with less developed mitochondria (white arrows, Figures 1F′ and 1G′) in 2D hiPSC-CMs. In addition, more glycogen deposits (black granules, open arrowhead, Figures 1F′, 1G′, and S1C–S1F) were visible in 2D hiPSC-CMs, as described previously (Courtot et al., 2014).
Figure 1.

2D and 3D Culture of Human Induced Pluripotent Stem Cell-Derived Cardiomyocytes
(A) Schematic depiction of experimental setup.
(B and C) Bright-field image of representative 2D and 3D hiPSC after 3 weeks; still frame from Movie S1.
(D) Force development of 3D hiPSC-CMs. Black frame indicates time window for functional analyses.
(E) qPCR results of 2D and 3D hiPSC-CMs for cardiomyocyte (MYL3, MYL4, cTNT1), fibroblast (vimentin, POSTN), and endothelial (CD31) markers.
(F and G) Transmission electron microscopy (TEM) pictures in 2D compared with 3D hiPSC-CMs (black arrow, mitochondria; white arrow, degenerated mitochondria). (F′) and (G′) are blow-ups of dashed boxes in (F) and (G) (open arrowheads: glycogen granules); samples prepared from one experiment.
n denotes biological replicates/independent experiments of both control cell lines; error bars show means ± SEM. Related data are depicted in Figure S1 and Movie S1.
Quantitative Proteomics Revealed Greater Abundance of Mitochondrial Proteins in 3D and Nuclear and Ribosomal Proteins in 2D hiPSC-CMs
For a quantitative assessment, we performed an unbiased proteomic comparison of 2D and 3D with lysed, time-matched samples from the same hiPSC-CM batch (Figure S2A). liquid chromatography-tandem mass spectrometry (LC-MS/MS) analysis on an Orbitrap Fusion mass spectrometer identified 1,222 proteins, 697 of which were present in at least two of three samples in 2D and 3D hiPSC-CMs. Scatterplots of log10 normalized spectral counts showed low variance as characterized by high values of R2 between the samples of the respective groups (Figure S2B). A total of 614 proteins, which were detected in three of three samples of both groups, underwent comparative quantitative analysis. Quantitative analysis showed that there were clear differences between the proteomic profiles of 2D and 3D cardiomyocytes (Figure 2A and Table S1). Among these 614 proteins, 256 (41%) significantly differed in abundance between the groups, 133 proteins being more and 123 proteins less abundant in 3D than in 2D hiPSC-CMs (p < 0.05; Tables S1 and S2). Interestingly, 93 of 256 proteins with altered abundance were mitochondrial proteins, all of which were more abundant in 3D (highlighted in Table S1). For nuclear proteins, ∼75% showed lower abundance in 3D than in 2D. Most of the ribosomal proteins with significant differences showed also lower abundance in 3D than in 2D. To gain more insight into differences between proteins of cellular compartments, we performed volcano and scatterplot analyses, which showed clear differences in the proteomic profiles of subcellular compartments by highlighting nuclear, mitochondrial, and ribosomal proteins (Figures 2B and 2C), very similar to the proteome difference between fetal and adult non-failing human heart (Pohjoismäki et al., 2010). Figure 2C shows relevant cardiac proteins such as troponin C, titin, myosin heavy chain 6 and 7, and myosin light chain 2, which were all more abundant in 3D than in 2D. Cardiac proteins such as troponin I were less abundant in 3D in comparison with 2D. We further analyzed the abundance of fatty acid oxidation proteins in 3D versus 2D and highlighted 11 proteins that were higher in abundance in 3D in comparison with 2D (Figure 2D). We next searched the proteomic profiles of 2D and 3D hiPSC-CMs for the proteins with the largest differences in protein abundance. We found that extracellular matrix proteins laminin subunits β1 (LAMB1) and γ1 (LAMC1) as well as fibrillin-2 (FBN2) were abundant in 3D, but not 2D cultures (Table S1). Mitochondrial proteins made up the rest of the ten proteins that were most abundant in 3D versus 2D format. These included ATP synthase subunit γ (ATPG), succinyl-CoA:3-ketoacid coenzyme A transferase 1 (SCOT1), aldehyde dehydrogenase (ALDH), 3-ketoacyl-CoA thiolase (THIM), isocitrate dehydrogenase (NAD) subunit γ (IDH3G), NADH dehydrogenase (ubiquinone) 1β subcomplex subunit 9 (NDUB9), and dynamin-like 120-kDa protein (ODPA) (Table S1).
Figure 2.

Quantitative Analysis of Proteomic Profiles of Human iPSC-Derived 2D or EHT Samples
(A) Volcano plots to compare the mean log2 fold changes (EHT/2D) of normalized spectral counts and the log10 of the p values obtained in t test comparison. Protein classes are highlighted. Note the strong presence of mitochondrial proteins in 3D samples.
(B) Scatterplots demonstrating the mean log10 normalized spectral counts of 2D and 3D hiPSC-CMs. Proteins enriched in 3D are located above the line of best fit and vice versa for 2D. Protein classes are highlighted.
(C) Volcano plot showing main cardiac proteins highlighted in green.
(D) Examples of mitochondrial protein spectral count analysis involved in fatty acid oxidation (FAO) and respiration (data extracted from A). Samples (n = 3 per group) prepared from one experiment.
∗p < 0.05, ∗∗p < 0.01 and ∗∗∗p < 0.001, EHT versus 2D (two-way ANOVA plus Bonferroni post test); error bars show means ± SEM. Related data are depicted in Figure S2.
Cardiomyocytes in 3D Cultures Exhibit Increases in Proteins Involved in ATP Synthesis and Fatty Acid Oxidation
A gene ontology analysis with the Genomatrix Genome Analyzer software for biological processes revealed that processes significantly more abundant in 3D included cellular respiration, energy derivation by oxidation of organic compounds, or generation of precursor metabolites and energy as well as respiratory electron transport chain or oxidative phosphorylation (Table S3 and Figure S2C). Processes less abundant in 3D included cytoskeleton organization, protein complex subunit organization, actin filament-based processes, cellular organization, and cellular complex assembly. A pathway analysis with Ingenuity Pathway Analysis (IPA) depicted that cardiomyocytes in 3D were most significantly associated with metabolic processes as seen by the annotations “mitochondrial dysfunction,” “oxidative phosphorylation,” or “TCA cycle,” where we found significantly different proteins to be more abundant in 3D hiPSC-CMs (Figure S2D). Other important pathways for the characterization of metabolism included fatty acid oxidation and glycolysis. Panther analysis for pathways and protein classes consistently showed that most targets more abundant in 3D hiPSC-CMs were involved in ATP synthesis and the tricarboxylic acid (TCA) cycle (10.8% each of total pathways, Figure S2E) and that the target group of proteins more abundant in 3D hiPSC-CMs was annotated to oxidoreductases (21.7% of total protein classes, Figure S2F).
The Mitochondrial Proteomes in 3D hiPSC-CMs and Adult Human Heart Are Similar
We then compared the proteomic profiles of 2D, 3D, and non-failing adult human hearts (NFH) with a focus on the mitochondrial protein compartment. Biological replicates of all three groups clustered closely together, and 3D samples clustered nearby the heart samples (Figures 3A and S3A). The mitochondrial proteomes of 3D and NFH samples were more similar to each other than 2D to 3D or 2D to NFH. We performed gene ontology and KEGG pathway enrichment analysis of different clusters as indicated in Figure S3A. Processes such as mitochondrial electron transport and TCA cycle as well as fatty acid oxidation were particularly lower in 2D than in 3D (Figure S3B). In general, fatty acid oxidation, oxidative phosphorylation, and cardiac muscle contraction were highest in the NFH and higher in 3D than in 2D. TCA cycle and the generation of precursor metabolites and energy were particularly enriched in 3D (Figure S3B). To further substantiate these findings, we specifically compared proteome data for different subunits of the ATP synthase among the groups, and found that 9 out of 11 subunits showed an ∼2- to 4.5-fold increase in 3D and heart samples in comparison with 2D (p < 0.05) (Figure 3B). We verified our proteomic results in a western blot analysis and probed for ATP5H and THIM (ACAA2), which verified significantly higher abundance in 3D and NFH samples in comparison with 2D (Figures 3C and 3D).
Figure 3.

Comparison of the Mitochondrial Proteome between 2D, 3D, and Non-failing Human Hearts
(A) Clustering analysis of mitochondrial proteins for 2D and 3D hiPSCs and non-failing heart samples. Expression levels are depicted as a color code ranging from blue (low expression) to red (high expression).
(B–D) Further analysis was performed for a selection of proteins involved in fatty acid oxidation and respiratory chain. (B) Proteome data of ATP synthase subunits. (C) Western blot analysis of 2D, 3D, and NFH for mitochondrial proteins such as 3-ketoacyl-CoA thiolase (ACAA2) and ATP synthase subunit d (ATP5H) (framed in A) in comparison with Ponceau staining. (D) Quantification of western blot analysis in (C).
Samples (n = 3 per group) prepared from one experiment. ∗p < 0.05, ∗∗p < 0.01, ∗∗∗p < 0.001, and ∗∗∗∗p < 0.001 versus 2D (one-way ANOVA plus Bonferroni post test); error bars show means ± SEM. Related data are depicted in Figure S3.
Increase in Mitochondrial Proteins Includes the PGC-1α (PPARGC1A) Transcriptional Regulatory Cascade and Is Accompanied by Higher Mitochondrial Mass and mtDNA Content in 3D
To better understand the molecular mechanism, we further analyzed proteins that were significantly different between 2D and 3D hiPSC-CM “Regulator Effects” using the IPA software. This analysis helps to understand the effects that result from differences in protein levels on molecular functions or diseases. The effectors network with the highest consistency score was shown to be the peroxisome proliferator-activated receptor γ coactivator 1α (PGC-1α/PPARGC1A) transcriptional regulatory cascade involved in the biogenesis of mitochondria, purine ribonucleotides, and nucleoside triphosphates (Dorn et al., 2015) (Figure 4A). Consistently, important upstream activators of this network are PGC-1α (PPARGC1A) and estrogen-related receptor α (ESRRA) both showed higher expression in 3D versus 2D hiPSC-CMs (Figures 4B and 4C). As these signaling pathways are known to be master regulators of mitochondrial biogenesis (Lehman et al., 2000, Russell et al., 2004), we hypothesized a gain in mitochondria mass in 3D hiPSC-CMs similar to early postnatal development. Comparing normalized spectral counts (as a measure of relative protein abundance) between 2D, 3D, and NFH for all detected mitochondrial proteins (Figure 3A and Table S4; 2D, 3.3; 3D, 7.4; NFH, 9.6; protein must be detected in at least 2 out of 9 samples), we found a 2.2-fold higher amount of mitochondrial proteins in 3D than in 2D and a 2.9-fold higher amount of mitochondrial proteins in NFH than in 2D (Figure 4D). In addition to the higher abundance of mitochondrial proteins, we measured the mitochondrial mass and mtDNA content. Mitochondrial mass was analyzed by flow cytometry of live cells stained with MitoTracker Green FM, selected for localizing to mitochondria regardless of mitochondrial membrane potential. This was 1.5-fold higher in 3D than in 2D (Figures 4E and S4A). Mitochondrial encoded NADH dehydrogenase 1 and 2 (Mt-ND1, Mt-ND2) DNA levels were 3-fold higher in 3D than in 2D, but still 1.5-fold lower than in NFH (Figure 4F). To exclude that this is due to a small difference in developmental kinetics, we also analyzed ND1/2 after 70 days and confirmed the difference in ND1/2 DNA level (Figures S4B and S4C). These data are in line with the proteomic and TEM results and suggest that mitochondrial density is 3-fold higher in 3D than in 2D, but still substantially lower than in adult human heart tissue.
Figure 4.

Expression of Mitochondrial Biogenesis-Related PGC-1α Signaling Pathway and Mitochondrial Protein, Mass, and DNA Content in hiPSC-CMs
(A) Analysis of “Regulator Effects” by IPA of proteins significantly different between 2D and 3D: highest consistency score for effector network involved in the biosynthesis of purine ribonucleotides and nucleoside triphosphates and directed by PPARGC1/PGC-1α and ESSRA, among other proteins.
(B and C) qRT-PCR for PPARGC1/PGC-1α (B) and ESSRA (C).
(D) Average intensity (normalized spectral counts as a measure for relative protein abundance) between samples of mitochondrial proteins detected by quantitative proteomics in hiPSC-CMs cultured in 2D or 3D compared with non-failing heart; protein must be identified in at least 2 out of 9 samples.
(E) Quantification of flow cytometry with MitoTracker Green FM of 2D versus 3D CMs.
(F) PCR amplification of genomic DNA for the mitochondrial encoded NADH dehydrogenase (Mt-ND1/2), normalized to the nuclear encoded gene actin, human heart samples (1× non-failing, 2× terminal heart failure).
n denotes biological replicates, ≥3 independent experiments of both control cell lines. ∗p < 0.05 and ∗∗p < 0.01 versus 2D (two-tailed unpaired t test, B, C, and E; error bars show means ± SEM). ∗p < 0.05 and ∗∗p < 0.01 versus 2D (one-way ANOVA plus Bonferroni post test, D and F; error bars show means ±SEM; ns, not significant). Related data are depicted in Figure S4.
2D and 3D hiPSC-CMs Are Able to Use Fatty Acid, Glucose, and Lactate as Sources of Energy
hiPSC-CMs in 2D and 3D format were incubated overnight in feeding medium containing only one energy source, either 1 mM fatty acid, 1 mM lactate, or 5 mM glucose. Beating frequency and contractile force as integrated parameter for the ability of hiPSC-CMs to use the different energy substrates were determined by video-optical recording for 3D hiPSC-CMs, and beating frequency was counted microscopically for 2D hiPSC-CMs. Figures 5A and 5B demonstrate no significant differences at baseline and after overnight culture, demonstrating that hiPSC-CMs have the ability to use all three energy substrates. 2D and 3D hiPSC-CMs incubated in medium without any energy source stopped beating completely and could not recover (Figures 5A, 5B, S5A, and S5B), verifying that hiPSC-CMs were not able to meet their energy needs from endogenous energy stores. To demonstrate the ability of 2D cardiomyocytes to oxidize energy substrate, we conducted the Seahorse XF Cell Mito Stress Test. Changes in the oxygen consumption rate in the presence of oligomycin, carbonyl cyanide-4-trifluoromethoxyphenylhydrazone (FCCP), and rotenone were qualitatively similar to previously reported findings in hiPSC-CMs (Figure S5C) (Birket et al., 2015, Kuppusamy et al., 2015), but the Seahorse assay could not be adapted reliably to 3D culture. To demonstrate the relevance of oxidative metabolism for 3D hiPSC-CMs, we studied their hypoxia sensitivity. Since lactate and fatty acids can only be metabolized by mitochondrial aerobic respiration, we hypothesized that under these conditions the glycolysis-mediated low hypoxia sensitivity of hiPSC-CMs should be substantially increased. We tested this hypothesis by subjecting 3D hiPSC-CMs adapted to glucose, lactate, or fatty acid to a 100-min hypoxia interval followed by reoxygenation under continuous video-optical contractility recording. Different energy substrates indeed have significant impact on hypoxia sensitivity: While force development remained unaltered under glucose conditions, it dropped to zero under lactate and fatty acid conditions and only partially recovered after switching back to 40% oxygen conditions (Figure 5C, exemplified original recordings in Figures 5D, 5E, and S5D; Movie S2).
Figure 5.

Metabolic Ability of 2D CMs and 3D CMs
(A) Beating rate for hiPSC-CMs of both control cell lines in 2D.
(B) Beating rate and contractile force for hiPSC-CMs of both control cell lines in 3D in feeding medium containing only one energy source for 20 hr, 1 mM fatty acid, 1 mM lactate, 5 mM glucose, or no energy substrate.
(C–E) Normalized force development (C) and original recordings (D and E) of 3D hiPSC-CMs during 100 min of hypoxia treatment (gray box) and reoxygenation.
n denotes biological replicates from three independent experiments of both control cell lines; error bars show means ± SEM. Related data are depicted in Figure S5 and Movie S2.
Anaerobic Glycolysis Decreases in Favor of More Oxidative Metabolism in 3D hiPSC-CMs
Given the fact that 2D and 3D hiPSC-CMs could metabolize all three energy substrates, we hypothesized that the difference in mitochondrial mass and DNA content might influence the amount of glycolysis and aerobic oxidation. To this end, we first analyzed glucose consumption and lactate production in hiPSC-CMs in 2D and 3D format in cell culture media containing all three energy substrates (1 mM fatty acid, 1 mM lactate, 5 mM glucose). Based on the scheme in Figure 6A, glucose consumption and lactate production were 2- to 3-fold higher in 2D hiPSC-CMs than in 3D (Figures 6B, 6C, S6A, and S6B). To determine whether this was due to overall higher metabolism in 2D or more oxidative mitochondrial metabolism in 3D, we analyzed mitochondrial flux. We supplemented cell culture media with one 14C-labeled energy substrate ([14C]glucose, [14C]lactate, or [14C]oleic acid) and analyzed the production of 14C-labeled CO2 as a surrogate for mitochondrial TCA-cycle activity. 3D hiPSC-CMs produced several-fold more 14C-labeled CO2 than 2D hiPSC-CMs from oxidation of glucose (+230%), lactate (+388%), or fatty acid (+214%) (Figures 6D, 6E, 6F, and S6C–S6E). Under the assumption of a fully efficient ATP production, the total amount of ATP produced by mitochondrial respiration was 2.3-fold higher in 3D than in 2D hiPSC-CMs (671 nmol versus 291 nmol per 4-hr incubation, respectively). The relative contribution to ATP production in 2D and 3D was 49% and 14%, respectively for glycolysis (ignoring about 1% simultaneous lactate oxidation) and 40%, 9%, and 2% and 65%, 14%, and 6% for fatty acid, glucose, and lactate oxidation, respectively (Figure 6G). Taken together, these experiments imply that if all energy substrates are provided, 3D hiPSC-CMs have a higher mitochondrial metabolism, suggesting a higher metabolic preference for oxidation than glycolysis compared with 2D hiPSC-CMs.
Figure 6.

Lactate Production and Oxidative Metabolism in hiPSC-CMs
(A) Schematic depiction of metabolic processes. Glycolysis was analyzed in (B) and (C), and oxidative metabolism in (D) to (G).
(B and C) Cell culture media concentration of glucose (cGluc) and lactate (cLac) after 4 hr of incubation in complete medium. Glucose consumption (B) and lactate production (C) in 2D and 3D hiPSC-CMs.
(D–F) Analysis of metabolic flux for radioactive 14C-labeled oleic acid (D), [14C]lactate (E), or [14C]glucose (F) after 4 hr of incubation.
(G) Calculated relative amount of ATP produced by oxidative metabolism and glycolysis.
n denotes biological replicates from three independent experiments. ∗p < 0.05 versus 2D (two-tailed unpaired t test, B and C; error bars show means ± SEM). ∗∗p < 0.01 and ∗∗∗p < 0.001 versus 2D (one-way ANOVA plus Bonferroni post test, D–F; error bars show means ± SEM). Related raw data of individual experiments are depicted in Figure S6.
Pharmacological Reduction of Contraction Decreases mtDNA Content in 3D
Auxotonic contraction and defined tension are important differences between the 2D and 3D EHT model of hiPSC-CMs, and contractile work also increases substantially in early postnatal life (Stopfkuchen, 1987). We analyzed the impact of contractile work on mitochondrial mass and DNA content by cultivating EHTs for 7 days in the presence of two different myosin II inhibitors (blebbistatin and N-benzyl-p-toluene sulfonamide [BTS]). Blebbistatin was chosen for this experiment, since it does not have off-target effects on mitochondrial metabolism in contrast to 2,3-butanedione monoxime (Hall and Hausenloy, 2016). Blebbistatin led to a reduction in force while other parameters of contraction remained unchanged (Figures 7A, 7B, and S7A–S7D). qPCR analysis revealed significantly lower copy numbers for mtDNA (Figure 7C) and lower mitochondrial mass (mitotracker fluorescence-activated cell sorting [FACS], Figure 7D). In line with this, the myosin II inhibitor BTS also led to lower mtDNA copy numbers (Figure 7E). In contrast, in 2D hiPSC-CMs both blebbistatin and BTS do not change mtDNA content (Figures S7C and S7D), suggesting that contractile work contributes to mitochondrial biogenesis in this model.
Figure 7.

Analysis of Mitochondrial Biogenesis after Pharmacological Reduction of Force
(A) Original recordings of EHTs ± myosin II inhibitor blebbistatin (300 nM) for 7 days from day 14 to day 21.
(B) Comparison of contractility parameter of EHTs incubated ± blebbistatin (300 nM) on day 21.
(C) PCR amplification of genomic DNA for Mt-ND1/2, normalized to the nuclear encoded gene actin of 3D ± blebbistatin.
(D) MitoTracker Green FM FACS of dissociated 3D hiPSC-CMs ± blebbistatin (300 nM).
(E) PCR amplification of genomic DNA for Mt-ND1/2, normalized to the nuclear encoded gene actin of 3D ± BTS.
n denotes biological replicates from three independent experiments. ∗p < 0.05 versus 2D (two-tailed unpaired t test); error bars show means ± SEM. Related raw data of individual experiments are depicted in Figure S7.
Discussion
We compared cardiomyocyte energetics of hiPSC-CMs cultured in 2D versus 3D format and found evidence for more mitochondria (TEM), mass (mitotracker), DNA (Mt-ND1, Mt-ND2), and protein abundance (proteome) in 3D format. hiPSC-CMs had the ability to use glucose, lactate, and fatty acids as energy substrates irrespective of culture format. hiPSC-CMs in 3D performed more oxidative metabolism of glucose, lactate, and fatty acid and less glycolysis, and generated 2.3-fold more ATP by oxidation than 2D hiPSC-CMs. Reduction of mitochondrial mass and DNA by pharmacological reduction of contraction in 3D points to the contribution of contractile work as one trigger of mitochondrial development.
Label-free proteomics revealed that 3D hiPSC-CMs contain more mitochondrial proteins and fatty acid-metabolizing enzymes than 2D hiPSC-CMs. In contrast, ribosomal and nuclear proteins were more abundant in 2D format. This aligns well with two recent protein-expression studies on postnatal development. Pohjoismäki et al. (2013) studied the changes in cardiac proteome during developmental hypertrophy in 16 fetal and adult non-failing heart samples by label-free proteome analysis. They discovered higher abundance of mitochondrial proteins and lower abundance of ribosomal and nuclear proteins as key changes (Pohjoismäki et al., 2013). The very same pattern was revealed in this study (Figure 2A), suggesting that mitochondrial biogenesis of early postnatal heart developmental is replicated in the 3D format. Interestingly, 3D hiPSC-CMs showed higher similarities to human ventricular heart tissue than to 2D hiPSC-CMs for proteins of the mitochondrial compartment (Figure 3A). Poon et al. (2015) studied changes in non-failing human fetal versus adult ventricular cardiomyocytes by 2D gel electrophoresis and confirmed the strong increase in fatty acid oxidation proteins and the fetal-like protein profile of human pluripotent stem cell-derived cardiomyocytes, consistent with our 2D monolayer culture. In addition, Poon et al. (2015) demonstrated that metabolic changes were accompanied by higher protein abundance but no changes in gene expression of candidate metabolic genes were seen, suggesting that metabolic changes are mediated by post-translational regulation. This conclusion is also supported by our data, since in contrast to marked changes in proteome profile, a recent comparison between 2D and 3D hiPSC-CMs on the transcript level did not reveal these differences (Mannhardt et al., 2016).
During postnatal metabolic development, the upregulation of mitochondrial proteins is followed by development of functional mitochondria and metabolic remodeling (Pohjoismäki et al., 2012). Our study indicates improved development of mitochondria in 3D culture, as mitochondrial mass and DNA content were higher (Figures 4E and 4F) and mitochondrial morphology was better (Figures 1F and 1G). In addition, we saw fewer glycogen stores in 3D hiPSC-CMs than in 2D, consistent with a reported decrease in glycogen stores from 30% of cell volume in fetal cardiomyocytes to 2% in adult cardiomyocytes (Rajabi et al., 2007). The significance of higher mitochondrial mass in the EHT model is underscored by a recent report that failed to demonstrate an increase in mtDNA in hiPSC-CMs after 3 months of culture in 2D (Bhute et al., 2017). However, we also showed that this process is not completed in 3D hiPSC-CMs. Examples of an intermediate status of 3D hiPSC-CMs include the overall still immature morphology of mitochondria in TEM (Figures 1F and 1G) and the lower level of mtDNA compared with human heart (Figure 4F). This interpretation is also supported by mitochondrial transcription factor A (TFAM) proteome data. TFAM and mtDNA levels are interconnected, and a 5-fold increase in TFAM was observed during human heart developmental hypertrophy (Pohjoismäki et al., 2010). TFAM protein abundance was 2.9-fold higher in 3D than in 2D (2.3 in 2D versus 6.6 in 3D; Table S2), which parallels the abundance of mtDNA (2.9-fold Mt-ND1/2; 2D, 343; 3D, 1,024; human heart, 1,501; Figure 4F). Although direct comparison of hiPSC-CM samples (containing mostly cardiomyocytes) with adult heart samples (containing also different non-cardiomyocyte cell types) is not ideal, the substantial differences between 3D and adult heart tissue probably reflect incomplete maturation of the former.
In addition to mitochondrial development, the switch from anaerobic glycolysis to aerobic oxidative metabolism of various energy substrates is a key event in postnatal metabolic development. As a result adult cardiomyocytes are described as “omnivores,” capable of breaking down various substrates such as fatty acids, lactate, ketone bodies, and glucose for aerobic ATP production (Kolwicz et al., 2013). Neonatal cardiomyocytes metabolize various energy substrates. In newborn rabbit heart, glycolysis, glucose, lactate, and palmitate oxidation were shown to contribute to ATP generation by 44%, 18%, 25%, and 13%, respectively (Lopaschuk et al., 1991). In line with this, we have shown (Figure 5) that hiPSC-CMs can utilize glucose, lactate, and fatty acids as energy substrates regardless of the culture condition. The exclusively oxidative metabolism of lactate and fatty acid was demonstrated by the increased hypoxia sensitivity compared with glucose-containing medium. On the other hand, these findings also indicate that hiPSC-CMs can meet their energy demand with anaerobic glycolysis.
While both 2D and 3D hiPSC-CMs have the ability to use glucose, lactate, and fatty acids as energy substrates, hiPSC-CMs in 3D format showed higher glucose, lactate, and fatty acid oxidation, resulting in a 2.3-fold increase in ATP production by oxidation (Figure 6G) without a change in the relative composition of oxidized energy substrates. These numbers overall fit very well with postnatal changes described in other mammals (3.3-fold [Lopaschuk et al., 1991]). At the same time, the lower lactate production (as a surrogate for extracellular acidification) and glucose consumption suggests less anaerobic glycolysis in 3D (Figure 6B). We used the lactate production values (Figure 6B) to estimate ATP production by glycolysis (280 nM for 2D and 113 nM for 3D, ignoring about 1% simultaneous lactate oxidation, Figure 6G). This can be further used to estimate relative ATP production from glycolysis and oxidation (glycolysis/oxidation ratio of 51%:49% for 2D versus 14%:86% for 3D). The absolute and relative increases in aerobic metabolism are indicators of energy metabolism maturation in hiPSC-CMs during 3D culture. The relative contribution in 2D matches well with recently reported values for hiPSC-CMs (Correia et al., 2017).
In the EHT format, hiPSC-CMs are cultivated under defined tension performing auxotonic contractions between elastic polydimethylsiloxane (PDMS) posts. This might serve as a biophysical cue complementary to biochemical cues used in previous studies. The reduced mitochondrial development by pharmacological reduction of contractile force points to contractile work as one mediator of mitochondrial development (Figure 7). In contrast, there was no positive correlation of spontaneous frequency with mtDNA content (Figures S7C and S7D). Interestingly, a previous report demonstrated improved maturation and higher mitochondrial frequency by electrical pacing (Nunes et al., 2013). The maturation of mitochondrial metabolism might thus be promoted by biophysical cues, which are sensed by stretch sensors. These findings are complementary to two previous studies demonstrating structural sarcomeric (Engler et al., 2008) and mitochondrial maturation (Lyra-Leite et al., 2017) in cardiomyocytes mediated by matrix stiffness. On the molecular level this process is accompanied with higher expression of PGC-1 (Figure 4). Interestingly, in mouse models PGC-1α/β and estrogen-related receptor α/γ drive perinatal functional and metabolic cardiac maturation (Lai et al., 2008, Wang et al., 2015), and in human embryonic stem cell-CM PGC-1α was also shown to regulate the mitochondrial biogenesis program (Birket et al., 2013).
In summary, this study provides several lines of evidence that a 3D culture format (herein EHT) of hiPSC-CMs induces maturation of energy metabolism toward a more adult-like state. This paves the way for a more detailed study of the mechanisms of energy metabolism, combining the EHT model with previously reported biochemical and biophysical maturation cues. The establishment of an hiPSC-CM model with advanced metabolic maturation should be an important asset to the hiPSC-CM toolbox, since it allows the study of metabolic changes mediated by drugs or cardiac diseases.
Experimental Procedures
The study was reviewed and approved by the Ethical Committee of the University Medical Center Hamburg-Eppendorf (Az. 532/ 116/9.7.1991), and all patients gave written informed consent.
Generation of Human Cardiomyocytes for Monolayer (2D) or Engineered Heart Tissue (3D)
This study was performed using a human induced pluripotent stem cell (hiPSC) control line, which was reprogrammed by lentivirus (Moretti et al., 2010). Key experiments were also verified with a second cell line, which was reprogrammed by Sendai virus according to the manufacturer's instruction (CytoTune-iPS Sendai Reprogramming Kit, #A1377801, Life Technologies). Figure S1A includes an overview of control cell lines used per experiment. Cardiac differentiation was performed with an EB-based protocol as recently described (Breckwoldt et al., 2017). Stem cell culture and mesodermal differentiation was conducted in 5% CO2 and 5% O2. Cardiac differentiation was conducted in 7% CO2 and atmospheric oxygen (21%). hiPSC-CMs in the EB format were subjected to collagenase digestion on day 17 after initiation of the differentiation (Breckwoldt et al., 2017, Mannhardt et al., 2017), and for each construct 0.8 × 10⁶ cells were used to either generate 2D or 3D samples, respectively. hiPSC-CMs were cultured in 7% CO2 and 40% O2 for 21–45 days and analyzed batch- and time-matched in 2D and 3D formats in parallel. 2D culture consisted of a very dense, confluent monolayer format (0.8 × 10⁶ cells/2 cm2 in a 24-well Nunc plate coated with 0.1% gelatin). For 3D culture, 0.8 × 10⁶ cells/24-well format EHT were embedded in a fibrin gel between elastic PDMS posts (Mannhardt et al., 2016). Differentiation runs with 55%–98% of cardiac troponin T-positive cells, as analyzed by flow cytometry, were utilized in this study. Force-generating EHTs constituted within 2 weeks after casting. Video-optical analysis of contractile force was performed as recently described (Hansen et al., 2010, Mannhardt et al., 2016). Silicone racks (C001), Teflon spacers (C002), and EHT analysis equipment (A001) were purchased from EHT Technologies (Hamburg).
Mass Spectrometry
Protein identification by LC-MS/MS analysis of peptides was performed using an Orbitrap Fusion Tribid mass spectrometer (Thermo Fisher Scientific, San Jose, CA) interfaced with an Ultimate 3000 Nano-HPLC apparatus (Thermo Fisher Scientific). Peptides were fractionated by reverse-phase HPLC on a Picofrit column (250 mm long, internal diameter 75 μm, tip internal diameter 15 μm, packed with BetaBasic 5-μm 300-Å particles; New Objective, Woburn, MA) using a 120-min linear gradient of 5%–35% acetonitrile in 0.1% formic acid at a flow rate of 300 nL/min. Survey scans of peptide precursors from 300 to 2,000 m/z were performed at 60K resolution. Tandem MS was performed with the quadrupole, HCD fragmentation with collision energy of 35, and rapid-scan MS analysis using an ion trap. The instrument was run in a top speed mode with 3-s cycles. This experiment was performed from biological replicates from one differentiation. Additional details on sample preparation and data analysis are provided online.
Statistical Analysis
All data were expressed as means ± SEM. Student's t test (two-tailed, homodynamic variance) was calculated in GraphPad Prism to compare between two groups, and one-way or two-way ANOVA was used for multiple comparisons of one or more factors, respectively. Technical replicates are defined as repeated measurements of the same biological replicate. Biological replicates are separate 2D/3D hiPSC-CM samples from the same differentiation. Independent experiments are 2D/3D hiPSC preparations from separate differentiations and time points. All statistical comparisons between 3D and 2D cultures were batch- and time-matched in three independent experiments, except for the proteome experiment, TEM, 70-day time point (Figure S4B), and the Seahorse experiment (S5C).
More information on all experiments is available online.
Author Contributions
B.M.U., A.S., T.E., and A.H. conceived and organized the project and wrote the manuscript; B.M.U., A.S., I.M., S.F., S.P., M.G., M.L.S., E.M., and A.H. contributed to experiments and data analysis. All authors discussed the results and commented on the manuscript.
Acknowledgment
We thank Tessa Werner, Anika Knaust, Pierre Bobin, Kaja Breckwoldt, Birgit Klampe, Lisa Krämer, David Letuffe-Brenière, Marta Lemme, Giulia Mearini, Christiane Neuber, Sari Panjaitan, Marina Reinsch, Marita Rodriguez, Umber Saleem, Thomas Schulze, Aya Shibamiya, Simone Steuck, and Maksimilian Prondzynski for their support with stem cell culture and cardiomyocyte differentiation. We thank Elisabeth Schulze and Jutta Starbatty for expert technical help. We are very grateful to Aya Shibamiya and Sandra Laufer from the stem cell facility at the Universitätsklinikums Hamburg-Eppendorf (UKE) for providing the ERC18 control hiPSC line 2 and technical help during stem cell culture. The C25 control hiPSC line 1 was provided by the group of Alessandra Moretti, München. The C14 oxidation assay was done in the Isotope facility of the UKE; thanks to Dagmara Nelson, Ludger Scheja, Sandra Ehret, and Jörg Heeren for expert technical advice, providing chemicals, and discussing the data. The FACS analysis was done with support from the FACS Core unit of the UKE. We greatly appreciate the assistance of Susanne Krasemann (mouse pathology core facility of the UKE) in processing and imaging the TEM samples. We thank Robert Godemann for providing access and support for the Seahorse experiments. Also many thanks to the members of the laboratory and Michael J. Brownstein for discussing and editing the manuscript. I.M., T.E., and A.H. are co-founders of EHT Technologies, Hamburg. This study was supported by the European Research Council (ERC-AG IndivuHeart), Deutsche Forschungsgemeinschaft (DFG Es 88/12-1, DFG HA 3423/5-1), the British National Centre for the Replacement Refinement & Reduction of Animals in Research (NC3Rs CRACK-IT grant 35911-259146), the German Ministry of Education and Research (BMBF) and the Centre for Cardiovascular Research (DZHK), British Heart Foundation RM/13/30157, the Freie und Hansestadt Hamburg, Era-Net E-RARE (01GM1305), and the NHLBI, NIH Intramural Program.
Published: March 1, 2018
Footnotes
Supplemental Information includes Supplemental Experimental Procedures, seven figures, four tables, and two movies and can be found with this article online at https://doi.org/10.1016/j.stemcr.2018.01.039.
Contributor Information
Bärbel M. Ulmer, Email: b.ulmer@uke.de.
Arne Hansen, Email: ar.hansen@uke.de.
Accession Numbers
The MS proteomics data have been deposited to the ProteomeXchange Consortium (http://proteomecentral.proteomexchange.org) via the PRIDE partner repository (Vizcaíno et al., 2013) with the dataset identifier PRIDE: PXD008205.
Supplemental Information
References
- Bhute V.J., Bao X., Dunn K.K., Knutson K.R., McCurry E.C., Jin G., Lee W.H., Lewis S., Ikeda A., Palecek S.P. Metabolomics identifies metabolic markers of maturation in human pluripotent stem cell-derived cardiomyocytes. Theranostics. 2017;7:2078–2091. doi: 10.7150/thno.19390. [DOI] [PMC free article] [PubMed] [Google Scholar]
- Birket M.J., Casini S., Kosmidis G., Elliott D.A., Gerencser A.A., Baartscheer A., Schumacher C., Mastroberardino P.G., Elefanty A.G., Stanley E.G. PGC-1α and reactive oxygen species regulate human embryonic stem cell-derived cardiomyocyte function. Stem Cell Reports. 2013;1:560–574. doi: 10.1016/j.stemcr.2013.11.008. [DOI] [PMC free article] [PubMed] [Google Scholar]
- Birket M.J., Ribeiro M.C., Kosmidis G., Ward D., Leitoguinho A.R., van de Pol V., Dambrot C., Devalla H.D., Davis R.P., Mastroberardino P.G. Contractile defect caused by mutation in MYBPC3 revealed under conditions optimized for human PSC-cardiomyocyte function. Cell Rep. 2015;13:733–745. doi: 10.1016/j.celrep.2015.09.025. [DOI] [PMC free article] [PubMed] [Google Scholar]
- Breckwoldt K., Letuffe-Brenière D., Mannhardt I., Schulze T., Ulmer B., Werner T., Benzin A., Klampe B., Reinsch M.C., Laufer S. Differentiation of cardiomyocytes and generation of human engineered heart tissue. Nat. Protoc. 2017;12:1177–1197. doi: 10.1038/nprot.2017.033. [DOI] [PubMed] [Google Scholar]
- Correia C., Koshkin A., Duarte P., Hu D., Teixeira A., Domian I., Serra M., Alves P.M. Distinct carbon sources affect structural and functional maturation of cardiomyocytes derived from human pluripotent stem cells. Sci. Rep. 2017;7:1–17. doi: 10.1038/s41598-017-08713-4. [DOI] [PMC free article] [PubMed] [Google Scholar]
- Courtot A.-M., Magniez A., Oudrhiri N., Féraud O., Bacci J., Gobbo E., Proust S., Turhan A.G., Bennaceur-Griscelli A. Morphological analysis of human induced pluripotent stem cells during induced differentiation and reverse programming. Biores. Open Access. 2014;3:206–216. doi: 10.1089/biores.2014.0028. [DOI] [PMC free article] [PubMed] [Google Scholar]
- Dai D.-F., Danoviz M.E., Wiczer B., Laflamme M.A., Tian R. Mitochondrial maturation in human pluripotent stem cell derived cardiomyocytes. Stem Cells Int. 2017;2017:1–10. doi: 10.1155/2017/5153625. [DOI] [PMC free article] [PubMed] [Google Scholar]
- Denning C., Borgdorff V., Crutchley J., Firth K.S.A., George V., Kalra S., Kondrashov A., Hoang M.D., Mosqueira D., Patel A. Cardiomyocytes from human pluripotent stem cells: from laboratory curiosity to industrial biomedical platform. Biochim. Biophys. Acta. 2016;l1863:1728–1748. doi: 10.1016/j.bbamcr.2015.10.014. [DOI] [PMC free article] [PubMed] [Google Scholar]
- Dorn G.W., Vega R.B., Kelly D.P., Kelly D.P. Mitochondrial biogenesis and dynamics in the developing and diseased heart. Genes Dev. 2015;29:1981–1991. doi: 10.1101/gad.269894.115. [DOI] [PMC free article] [PubMed] [Google Scholar]
- Drawnel F.M., Boccardo S., Prummer M., Delobel F., Graff A., Weber M., Gérard R., Badi L., Kam-Thong T., Bu L. Disease modeling and phenotypic drug screening for diabetic cardiomyopathy using human induced pluripotent stem cells. Cell Rep. 2014;9:810–820. doi: 10.1016/j.celrep.2014.09.055. [DOI] [PubMed] [Google Scholar]
- Engler A.J., Carag-Krieger C., Johnson C.P., Raab M., Tang H.-Y., Speicher D.W., Sanger J.W., Sanger J.M., Discher D.E. Embryonic cardiomyocytes beat best on a matrix with heart-like elasticity: scar-like rigidity inhibits beating. J. Cell Sci. 2008;121:3794–3802. doi: 10.1242/jcs.029678. [DOI] [PMC free article] [PubMed] [Google Scholar]
- Gorski P.A., Ceholski D.K., Hajjar R.J. Altered myocardial calcium cycling and energetics in heart failure—a rational approach for disease treatment. Cell Metab. 2015;21:183–194. doi: 10.1016/j.cmet.2015.01.005. [DOI] [PMC free article] [PubMed] [Google Scholar]
- Hall A.R., Hausenloy D.J. Mitochondrial respiratory inhibition by 2,3-butanedione monoxime (BDM): implications for culturing isolated mouse ventricular cardiomyocytes. Physiol. Rep. 2016;4:e12606. doi: 10.14814/phy2.12606. [DOI] [PMC free article] [PubMed] [Google Scholar]
- Hansen A., Eder A., Bönstrup M., Flato M., Mewe M., Schaaf S., Aksehirlioglu B., Schwörer A., Uebeler J., Eschenhagen T. Development of a drug screening platform based on engineered heart tissue. Circ. Res. 2010;107:35–44. doi: 10.1161/CIRCRESAHA.109.211458. [DOI] [PubMed] [Google Scholar]
- Kim C., Wong J., Wen J., Wang S., Wang C., Spiering S., Kan N.G., Forcales S., Puri P.L., Leone T.C. Studying arrhythmogenic right ventricular dysplasia with patient-specific iPSCs. Nature. 2013;494:105–110. doi: 10.1038/nature11799. [DOI] [PMC free article] [PubMed] [Google Scholar]
- Kolwicz S.C., Purohit S., Tian R. Cardiac metabolism and its interactions with contraction, growth, and survival of cardiomyocytes. Circ. Res. 2013;113:603–616. doi: 10.1161/CIRCRESAHA.113.302095. [DOI] [PMC free article] [PubMed] [Google Scholar]
- Kuppusamy K.T., Jones D.C., Sperber H., Madan A., Fischer K.A., Rodriguez M.L., Pabon L., Zhu W.Z., Tulloch N.L., Yang X. Let-7 family of microRNA is required for maturation and adult-like metabolism in stem cell-derived cardiomyocytes. Proc. Natl. Acad. Sci. USA. 2015;112:2785–2794. doi: 10.1073/pnas.1424042112. [DOI] [PMC free article] [PubMed] [Google Scholar]
- Lai L., Leone T.C., Zechner C., Schaeffer P.J., Kelly S.M., Flanagan D.P., Medeiros D.M., Kovacs A., Kelly D.P. Transcriptional coactivators PGC-1 and PGC-l control overlapping programs required for perinatal maturation of the heart. Genes Dev. 2008;22:1948–1961. doi: 10.1101/gad.1661708. [DOI] [PMC free article] [PubMed] [Google Scholar]
- Lehman J.J., Barger P.M., Kovacs A., Saffitz J.E., Medeiros D.M., Kelly D.P. Peroxisome proliferator-activated receptor gamma coactivator-1 promotes cardiac mitochondrial biogenesis. J. Clin. Invest. 2000;106:847–856. doi: 10.1172/JCI10268. [DOI] [PMC free article] [PubMed] [Google Scholar]
- Lopaschuk G.D., Jaswal J.S. Energy metabolic phenotype of the cardiomyocyte during development, differentiation, and postnatal maturation. J. Cardiovasc. Pharmacol. 2010;56:130–140. doi: 10.1097/FJC.0b013e3181e74a14. [DOI] [PubMed] [Google Scholar]
- Lopaschuk G.D., Spafford M.A., Marsh D.R. Glycolysis is predominant source of myocardial ATP production immediately after birth. Am. J. Physiol. 1991;261:H1698–H1705. doi: 10.1152/ajpheart.1991.261.6.H1698. [DOI] [PubMed] [Google Scholar]
- Lundy S.D., Zhu W.-Z., Regnier M., Laflamme M.A. Structural and functional maturation of cardiomyocytes derived from human pluripotent stem cells. Stem Cells Dev. 2013;22:1991–2002. doi: 10.1089/scd.2012.0490. [DOI] [PMC free article] [PubMed] [Google Scholar]
- Lyra-Leite D.M., Andres A.M., Petersen A.P., Ariyasinghe N.R., Cho N., Lee J.A., Gottlieb R.A., McCain M.L. Mitochondrial function in engineered cardiac tissues is regulated by extracellular matrix elasticity and tissue alignment. Am. J. Physiol. Heart Circ. Physiol. 2017;313:H757–H767. doi: 10.1152/ajpheart.00290.2017. [DOI] [PMC free article] [PubMed] [Google Scholar]
- Mannhardt I., Breckwoldt K., Letuffe-Brenière D., Schaaf S., Schulz H., Neuber C., Benzin A., Werner T., Eder A., Schulze T. Human engineered heart tissue: analysis of contractile force. Stem Cell Reports. 2016;7:29–42. doi: 10.1016/j.stemcr.2016.04.011. [DOI] [PMC free article] [PubMed] [Google Scholar]
- Mannhardt I., Saleem U., Benzin A., Schulze T., Klampe B., Eschenhagen T., Hansen A. Automated contraction analysis of human engineered heart tissue for cardiac drug safety screening. J. Vis. Exp. 2017 doi: 10.3791/55461. [DOI] [PMC free article] [PubMed] [Google Scholar]
- Mills R.J., Titmarsh D.M., Koenig X., Parker B.L., Ryall J.G., Quaife-Ryan G.A., Voges H.K., Hodson M.P., Ferguson C., Drowley L. Functional screening in human cardiac organoids reveals a metabolic mechanism for cardiomyocyte cell cycle arrest. Proc. Natl. Acad. Sci. USA. 2017;114:E8372–E8381. doi: 10.1073/pnas.1707316114. [DOI] [PMC free article] [PubMed] [Google Scholar]
- Moretti A., Bellin M., Welling A., Jung C.B., Lam J.T., Bott-Flügel L., Dorn T., Goedel A., Höhnke C., Hofmann F. Patient-specific induced pluripotent stem-cell models for long-QT syndrome. N. Engl. J. Med. 2010;363:1397–1409. doi: 10.1056/NEJMoa0908679. [DOI] [PubMed] [Google Scholar]
- Nunes S.S., Miklas J.W., Liu J., Aschar-Sobbi R., Xiao Y., Zhang B., Jiang J., Massé S., Gagliardi M., Hsieh A. Biowire: a platform for maturation of human pluripotent stem cell-derived cardiomyocytes. Nat. Methods. 2013;10:781–787. doi: 10.1038/nmeth.2524. [DOI] [PMC free article] [PubMed] [Google Scholar]
- Pohjoismäki J.L.O., Goffart S., Taylor R.W., Turnbull D.M., Suomalainen A., Jacobs H.T., Karhunen P.J. Developmental and pathological changes in the human cardiac muscle mitochondrial DNA organization, replication and copy number. PLoS One. 2010;5:e10426. doi: 10.1371/journal.pone.0010426. [DOI] [PMC free article] [PubMed] [Google Scholar]
- Pohjoismäki J.L.O., Boettger T., Liu Z., Goffart S., Szibor M., Braun T. Oxidative stress during mitochondrial biogenesis compromises mtDNA integrity in growing hearts and induces a global DNA repair response. Nucleic Acids Res. 2012;40:6595–6607. doi: 10.1093/nar/gks301. [DOI] [PMC free article] [PubMed] [Google Scholar]
- Pohjoismäki J.L.O., Krüger M., Al-Furoukh N., Lagerstedt A., Karhunen P.J., Braun T. Postnatal cardiomyocyte growth and mitochondrial reorganization cause multiple changes in the proteome of human cardiomyocytes. Mol. Biosyst. 2013;9:1210–1219. doi: 10.1039/c3mb25556e. [DOI] [PubMed] [Google Scholar]
- Poon E., Keung W., Liang Y., Ramalingam R., Yan B., Zhang S., Chopra A., Moore J., Herren A., Lieu D.K. Proteomic analysis of human pluripotent stem cell-derived, fetal, and adult ventricular cardiomyocytes reveals pathways crucial for cardiac metabolism and maturation. Circ. Cardiovasc. Genet. 2015;8:427–436. doi: 10.1161/CIRCGENETICS.114.000918. [DOI] [PubMed] [Google Scholar]
- Quaife-Ryan G.A., Sim C.B., Ziemann M., Kaspi A., Rafehi H., Ramialison M., El-Osta A., Hudson J.E., Porrello E.R. Multicellular transcriptional analysis of mammalian heart regeneration. Circulation. 2017;136:1123–1139. doi: 10.1161/CIRCULATIONAHA.117.028252. [DOI] [PMC free article] [PubMed] [Google Scholar]
- Rajabi M., Kassiotis C., Razeghi P., Taegtmeyer H. Return to the fetal gene program protects the stressed heart: a strong hypothesis. Heart Fail. Rev. 2007;12:331–343. doi: 10.1007/s10741-007-9034-1. [DOI] [PubMed] [Google Scholar]
- Rana P., Anson B., Engle S., Will Y. Characterization of human-induced pluripotent stem cell-derived cardiomyocytes: bioenergetics and utilization in safety screening. Toxicol. Sci. 2012;130:117–131. doi: 10.1093/toxsci/kfs233. [DOI] [PubMed] [Google Scholar]
- Russell L.K., Mansfield C.M., Lehman J.J., Kovacs A., Courtois M., Saffitz J.E., Medeiros D.M., Valencik M.L., McDonald J.A., Kelly D.P. Cardiac-specific induction of the transcriptional coactivator peroxisome proliferator-activated receptor gamma coactivator-1alpha promotes mitochondrial biogenesis and reversible cardiomyopathy in a developmental stage-dependent manner. Circ. Res. 2004;94:525–533. doi: 10.1161/01.RES.0000117088.36577.EB. [DOI] [PubMed] [Google Scholar]
- Schaaf S., Eder A., Vollert I., Stöhr A., Hansen A., Eschenhagen T. Generation of strip-format fibrin-based engineered heart tissue (EHT) Methods Mol. Biol. 2014;1181:121–129. doi: 10.1007/978-1-4939-1047-2_11. [DOI] [PubMed] [Google Scholar]
- Shen W., Asai K., Uechi M., Mathier M.A., Shannon R.P., Vatner S.F., Ingwall J.S. Progressive loss of myocardial ATP due to a loss of total purines during the development of heart failure in dogs: a compensatory role for the parallel loss of creatine. Circulation. 1999;100:2113–2118. doi: 10.1161/01.cir.100.20.2113. [DOI] [PubMed] [Google Scholar]
- Stoehr A., Neuber C., Baldauf C., Vollert I., Friedrich F.W., Flenner F., Carrier L., Eder A., Schaaf S., Hirt M.N. Automated analysis of contractile force and Ca2+ transients in engineered heart tissue. Am. J. Physiol. Heart Circ. Physiol. 2014;306:H1353–H1363. doi: 10.1152/ajpheart.00705.2013. [DOI] [PMC free article] [PubMed] [Google Scholar]
- Stopfkuchen H. Changes of the cardiovascular system during the perinatal period. Eur. J. Pediatr. 1987;146:545–549. doi: 10.1007/BF02467350. [DOI] [PubMed] [Google Scholar]
- Uzun A.U., Mannhardt I., Breckwoldt K., Horváth A., Johannsen S.S., Hansen A., Eschenhagen T., Christ T. Ca2+-currents in human induced pluripotent stem cell-derived cardiomyocytes effects of two different culture conditions. Front. Pharmacol. 2016;7:300. doi: 10.3389/fphar.2016.00300. [DOI] [PMC free article] [PubMed] [Google Scholar]
- Vizcaíno J.A., Côté R.G., Csordas A., Dianes J.A., Fabregat A., Foster J.M., Griss J., Alpi E., Birim M., Contell J. The PRoteomics IDEntifications (PRIDE) database and associated tools: status in 2013. Nucleic Acids Res. 2013;41:D1063–D1069. doi: 10.1093/nar/gks1262. [DOI] [PMC free article] [PubMed] [Google Scholar]
- Wang T., McDonald C., Petrenko N.B., Leblanc M., Wang T., Giguere V., Evans R.M., Patel V.V., Pei L. Estrogen-related receptor α (ERRα) and ERRγ are essential coordinators of cardiac metabolism and function. Mol. Cell. Biol. 2015;35:1281–1298. doi: 10.1128/MCB.01156-14. [DOI] [PMC free article] [PubMed] [Google Scholar]
- Yang X., Pabon L., Murry C.E. Engineering adolescence: maturation of human pluripotent stem cell-derived cardiomyocytes. Circ. Res. 2014;114:511–523. doi: 10.1161/CIRCRESAHA.114.300558. [DOI] [PMC free article] [PubMed] [Google Scholar]
- Yang X., Rodriguez M., Pabon L., Fischer K.A., Reinecke H., Regnier M., Sniadecki N.J., Ruohola-Baker H., Murry C.E. Tri-iodo-l-thyronine promotes the maturation of human cardiomyocytes-derived from induced pluripotent stem cells. J. Mol. Cell. Cardiol. 2014;72:296–304. doi: 10.1016/j.yjmcc.2014.04.005. [DOI] [PMC free article] [PubMed] [Google Scholar]
Associated Data
This section collects any data citations, data availability statements, or supplementary materials included in this article.