Abstract
Compounds with honeycomb structures occupied by strong spin orbit coupled (SOC) moments are considered to be candidate Kitaev quantum spin liquids. Here we present the first example of Os on a honeycomb structure, Li2.15(3)Os0.85(3)O3 (C2/c, a = 5.09 Å, b = 8.81 Å, c = 9.83 Å, β = 99.3°). Neutron diffraction shows large site disorder in the honeycomb layer and X-ray absorption spectroscopy indicates a valence state of Os (4.7 ± 0.2), consistent with the nominal concentration. We observe a transport band gap of Δ = 243 ± 23 meV, a large van Vleck susceptibility, and an effective moment of 0.85 μB, much lower than expected from 70% Os(+5). No evidence of long range order is found above 0.10 K but a spin glass-like peak in ac-susceptibility is observed at 0.5 K. The specific heat displays an impurity spin contribution in addition to a power law ∝T(0.63±0.06). Applied density functional theory (DFT) leads to a reduced moment, suggesting incipient itineracy of the valence electrons, and finding evidence that Li over stoichiometry leads to Os(4+)−Os(5+) mixed valence. This local picture is discussed in light of the site disorder and a possible underlying quantum spin liquid state.
Introduction
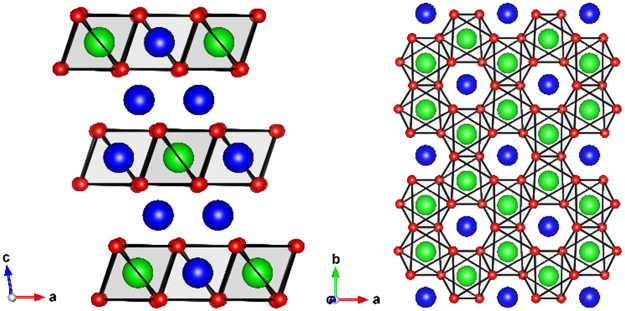
The demonstration by Kitaev of an exactly solvable quantum spin liquid (QSL) model incorporating S = spins with anisotropic interactions on a honeycomb lattice1,2 has motivated searches for its experimental realization. Whereas magnetic honeycomb-containing compounds have been extensively investigated in 3d and 4d metal oxides3–11, the strong interaction anisotropy required by Kitaev’s theory has placed a focus on 5d metal oxides, for which strong spin-orbit coupling (SOC), the origin of spatial anisotropy, can be expected12–18. In the A2MO3 honeycomb structure, where A is an alkali element and M a 4d or 5d element, the AM2 layers form a hexagonal network of edge sharing MO6 octahedra with a single A+ ion at the centers of the hexagons (Fig. 1).
Figure 1.
Left: Li2MO3 (M = 4d or 5d element) structure as alternating Li and LiM2 layers. Right: Viewed along the c axis the LiM2 layer, where MO6 edge-sharing octahedra form the honeycomb lattice. Blue, green, and red spheres represent lithium, metal, and oxygen atoms respectively.
Examples such as -Na2IrO3 and -Li2IrO3 with effective spin Jeff = , have recently emerged as possible examples of Kitaev physics. These compounds possess antiferromagnetic (AF) Weiss temperatures of 125(6) K and 33(3) K and undergo AF order at 15.5 K and 14.5 K for Na2IrO3 and Li2IrO3 respectively19,20. The 3D hyper-honeycomb lattice compound -Li2IrO3, however, demonstrates a ferromagnetic (FM) Weiss temperature of 40 K and weak ordering signatures at 38 K among Jeff = moments21. Among non-oxide materials, the layered compound -RuCl3 has also been discussed as a possible Kitaev system, though it too undergoes long range order at 7.5 K22. Since the suppression of classical order via geometrical frustration is a requirement for creating a QSL state, the above systems, while possessing important attributes, fall short of the Kitaev criteria23. Due to the ordering seen in other honeycomb compounds and because the specific materials conditions required to produce a QSL are ill-defined at present, it is important to study other honeycomb-containing compounds with sizable SOC.
Here, we ask what would be the result of reducing the SOC from that of 540 meV in Ir to 480 meV in Os24. In the present work we report on the synthesis, structure, and properties of Li2.15(3)Os0.85(3)O3 which is isostructural to the Ir honeycomb compounds mentioned above. For the stoichiometric compound, Li2OsO3, the Os ion is expected to be in the 4+ = d4, Jeff = 0 state to maintain charge-neutrality. In our work, we find, in contrast to other honeycomb systems, a lack of long range order above 0.1 K. While this might be due to a frustrated lattice, it also might be due to site disorder among the Os ions. For each crystallographic site representing the LiOs2 layer, an average of 43% of the sites (compared to the expected 33 of these sites) are occupied by lithium and thus the average valence of Os is +4.5 0.1 (d3.5), a value consistent with our X-ray absorption spectroscopy (XAS) measurements, which yield +4.7 0.2. From a local moment perspective and using the XAS-determined valence state, our system might be comprised of 30% d4 (Jeff = 0) and 70% d5 (Jeff = ) but its physical properties are not easily understood. We find a transport gap of 243 meV, an effective magnetic moment of 0.85 μB, which is much less than the effective moment of 3.24 μB expected if 70 of the ions possessed Jeff = . No magnetic order is observed above 0.10 K, and the specific heat obeys a fractional power law in temperature and is only weakly magnetic field-dependent. We discuss the constraints on the local physics of Os from a band structure perspective and their implications for collective behavior en route to a possible QSL in SOC honeycomb systems.
Results and Discussion
Structure
Common space groups assigned to honeycomb-structure compounds Li2MO3 (M = Mo, Mn, Rh, Ir, Ru, Pt, and Sn) are C2/m, C2/c, and Rm4,7–9,11,17,25–32. Supplemental Figure S1 represents Li2MO3 C2/m, C2/c, and Rm unit cells illustrated down the b-axis (top) and corresponding portion of the Li-M layer representing a (bottom) with lithium and metal occupying their ideal Wyckoff positions4,11,17,28,29,32. For all three space groups, edge sharing octahedral LiM2 layers alternate with edge sharing octahedral Li layers. The difference in space groups and their associated symmetries can in part be ascribed to stacking of the LiM2 layers, with Rm as the highest in symmetry. The space group assignments of some Li2MO3 systems has been controversial. For example, Li2MnO3 was first refined to be C2/c, but later found to be C2/m on the basis of electron diffraction and transmission electron microscopy26,27.
Another example is Li2MoO3, which was reported as both C2/c and Rm4,28. When comparing literature on polycrystalline Li2IrO3 synthesized under standard solid state conditions, discrepancies in C2/c and C2/m space groups exist. Recent work supports the higher symmetry C2/m as the appropriate space group for polycrystalline Li2IrO317,29,32. The powder X-ray diffraction pattern of Li2OsO3 is shown in Fig. 2 (top black line).
Figure 2.
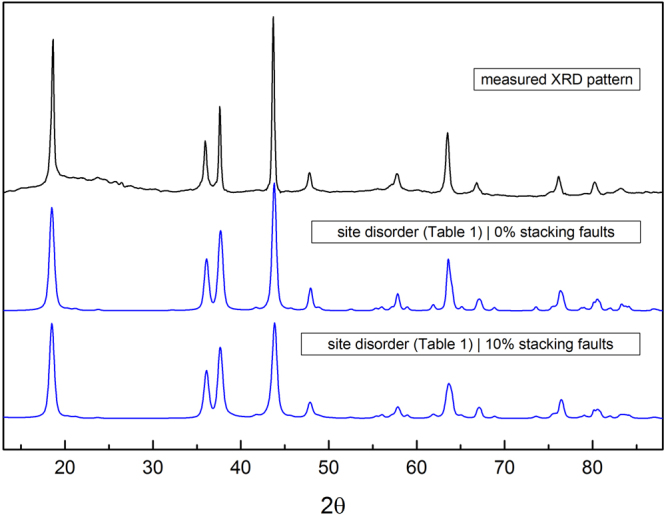
A comparison of the measured XRD pattern (top black line) (λ = 1.514 Angstroms), along with 43 site disorder (Table 1) 0 stacking fault and 43 site disorder (Table 1) 10 stacking fault simulated DIFFaX patterns (blue lines).
At first glance, the X-ray pattern pointed to a more symmetric space group, Rm, however, close examination of the pattern showed weak and broad diffraction peaks in the 2 region of 19° to 33°. It is known that for both C2/m and C2/c systems, with no Li-M site exchange within the LiM2 layers, sharp peaks exist within the 19° to 33° range. However, introducing Li-M site exchange within the LiM2 layers decreases the relative intensities of these peaks, leading to virtually no peak presence at 30 Li-M site exchange30. Such a reduction in diffraction peak intensity is also found for (hk0) reflections past 38° 30. Disorder among Li-M sites is commonly reported for honeycomb layered metal oxides since all corresponding crystallographic sites are octahedral and similar in size4,9,11,17,18,26–28. The presence of stacking faults associated with a shift between successive LiM2 layers will cause the peaks in the region from 19° to 33° to further broaden asymmetrically7–9,18,30. Thus, with the existence of Li-M site disorder and stacking faults, it is difficult to distinguish between the corresponding space groups using powder X-ray diffraction. The x-ray scattering length for lithium and oxygen are also small due to their low Z. Because of the neutron scattering lengths of lithium, osmium, and oxygen, neutron diffraction is ideal to characterize the Li2OsO3 structure.
To determine the crystal structure, Rietveld refinements were performed on room temperature neutron diffraction data using the GSAS program (Fig. 3)33,34. The current synthesis procedure restricted diffraction measurements to the Oak Ridge NOMAD TOF Neutron beamline, which is well-suited for small sample sizes. A pseudo-Voigt peak shape profile was chosen and parameters refined to obtain the best fit to the collected data. The space group was refined to be C2/c, with lattice dimensions a = 5.09 Å, b = 8.81 Å, c = 9.83 Å, and β = 99.3°. Rietveld refinements for all collected banks are shown in Supplemental Figure S2, with cumulative wRp = 6.40 %. The atomic coordinates, occupancies, and isotropic displacement parameters are represented in Table 1.
Figure 3.
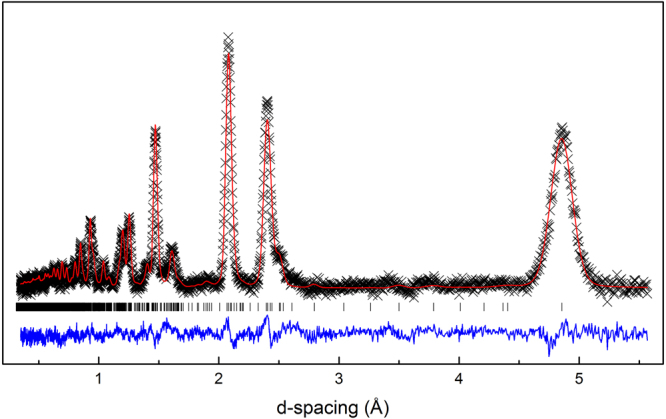
Rietveld refinement of TOF Neutron (Oak Ridge NOMAD BL-1B) diffraction data. The collected data (black cross), Rietveld refinement (red line), and difference (blue line) are presented for one of the four collected banks. Resulting cumulative wRp = 6.4 .
Table 1.
Atomic coordinates, occupancies and isotropic displacement parameters obtained from Rietveld refinement (C2/c) of TOF Neutron (Oak Ridge NOMAD BL-1B) diffraction data.
| Wyckoff | x | y | z | occ | U iso | |
|---|---|---|---|---|---|---|
| Li1 | 8f | 0.2543(2) | 0.0840(1) | 0.0044(9) | 1 | 0.25(8) |
| Li2 | 4d | 0.25 | 0.25 | 0.5 | 1 | 0.037(4) |
| Li3 | 4e | 0 | 0.7531(8) | 0.25 | 0.32(4) | 0.20(7) |
| Os3 | 4e | 0 | 0.7531(8) | 0.25 | 0.68(4) | 0.20(7) |
| Os4 | 4e | 0 | 0.0777(7) | 0.25 | 0.46(2) | 0.0043(2) |
| Li4 | 4e | 0 | 0.0777(7) | 0.25 | 0.54(2) | 0.0043(2) |
| Os5 | 4e | 0 | 0.4026(6) | 0.25 | 0.56(2) | 0.0082(2) |
| Li5 | 4e | 0 | 0.4026(6) | 0.25 | 0.44(2) | 0.0082(2) |
| O1 | 8f | 0.1335(7) | 0.2414(5) | 0.1344(4) | 1 | 0.029(3) |
| O2 | 8f | 0.1269(8) | 0.5770(5) | 0.1414(4) | 1 | 0.0085(3) |
| O3 | 8f | 0.1387(8) | 0.9181(5) | 0.1332(5) | 1 | 0.0082(8) |
Interatomic distances and angles are given in Supplemental Table S1. No osmium is detected in the lithium-only layers. For C2/c there are three unique atomic positions to describe the Li and Os sites within the LiOs2 layer (Supplemental Figure S3). Shown in Table 1, corresponding sites are labeled as Li/Os 3, 4, and 5. If no Li-Os site disorder existed within the LiOs2 layer, only Li3, Os4, and Os5 would exist (each with an occupancy of 1), with Os4 and Os5 sites describing the honeycomb rings. As shown from Table 1 occupancies, a large percentage of Li-Os site disorder exists within the LiOs2 layer. For each of the three respective crystallographic sites, an average of 43 is occupied by lithium. The stoichiometry derived from occupancy refinements of Li, Os, and O is Li2.15(3)Os0.85(3)O3 suggesting an average osmium oxidation state of 4.5 0.1. It is important to note that oxygen occupancy refinements indicate that the oxygen sites are fully occupied and no detectable vacancies are observed. Though 2:1 stoichiometric amounts of Li:Os were used in the synthesis, the refined stoichiometric ratio is considered reasonable as the presence of a small amount of osmium impurity is formed during the synthesis and was removed by heating the sample in air at 300 °C as OsO4 through sublimation.
Stacking faults were modeled using the DIFFaX program35 and the description of the model and analogous XRD patterns are discussed in the SI section. From the discussion presented, the absence of the (020) peak can only be attributed to Li-Os site disorder within the LiOs2 layers and not from stacking faults, consistent with the neutron refinement. As shown in Fig. 2, the measured XRD pattern is compared to simulated DIFFaX patterns with site disorder representing Table 1 refined Wyckoff site occupancies with and without 10 stacking faults (blue lines).
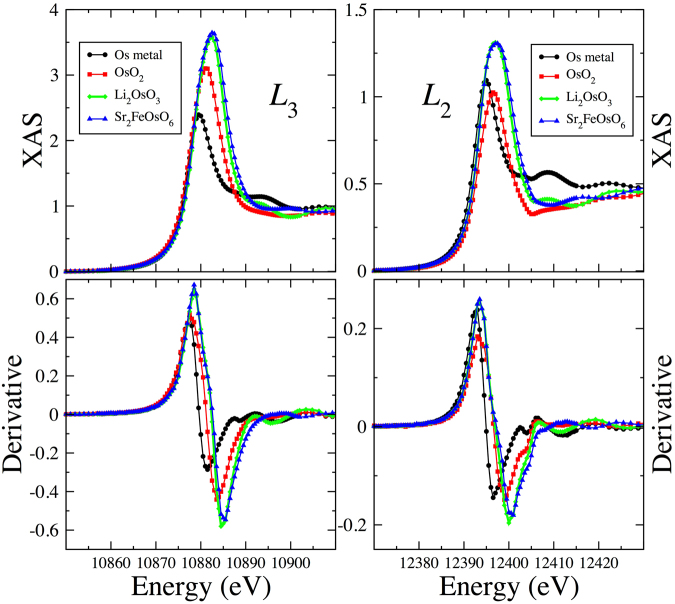
XAS measurements at the Os L2,3 absorption edges ( → 5d resonant excitation) were used to provide an additional estimate of Os valence (Fig. 4). The enhanced X-ray absorption above the leading edge (“white line”) is a result of large density of empty 5d states near the Fermi level. This peak grows in intensity and shifts to higher energy with increasing Os oxidation state. Interpolating the XAS peak position in the honeycomb sample onto those of the reference compounds yields an oxidation state of +4.7 0.2, within errors of results from structure refinements.
Figure 4.
XAS measurements at the Os L2,3 absorption edges on Li2.15Os0.85O3 and three reference compounds with known oxidation state.
The ratio of L3 to L2 white line intensity, also known as the isotropic branching ratio (BR), provides a measure of the relevance of SOC interactions in the 5d band36,37. In the absence of sizable SOC interactions, the isotropic branching ratio equals 2 reflecting the different occupancies of the core levels at L3 and L2 edges. We measured BR = 2.9(1) which significantly differs from the statistical value of 2 and indicates that SOC interactions need to be included in order to describe the 5d electronic structure of this compound.
Thermodynamic and Transport Properties
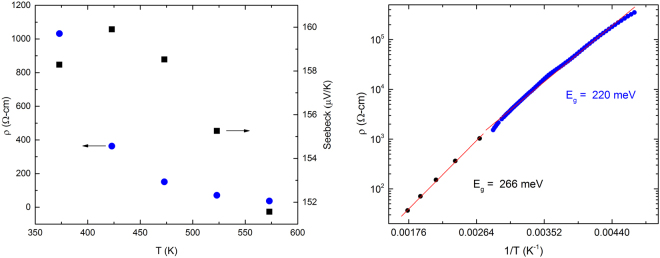
Temperature dependent resistivity and Seebeck measurements from 300–600 Kelvin are shown in Fig. 5. The gap energy (Eg) for the sample was extracted using = exp(Eg/2kBT) with Eg = 220 meV and 266 meV obtained from low- and high-temperature transport measurements respectively, thus indicating a small band gap insulator (Fig. 5 - right).
Figure 5.
Left: High temperature resistivity and Seebeck coefficient data of Li2.15Os0.85O3 sample from 350 to 600 K. Right: Resistivity versus temperature for Li2.15Os0.85O3 in the range 200–600 K versus inverse temperature. The low and high temperature measurements were performed in different apparatuses on samples from the same growth run. To assure continuity at T = 300 K, the data have been rescaled for the low temperature measurement due to its greater uncertainty in the geometric factor.
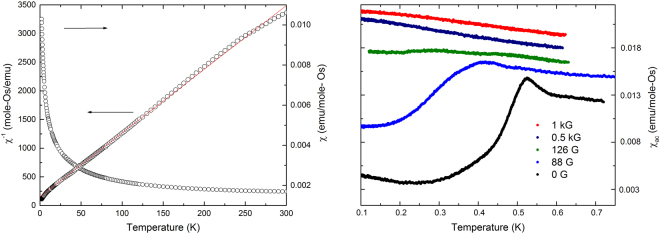
The magnetic susceptibility, , for H = 0.5 T (Fig. 6) suggests the combined effects of Curie-Weiss as well as van Vleck temperature independent paramagnetism over the entire measurement range above 2 K. Within this assumption, we varied the magnitude of the van Vleck term, χVV, to produce a pure Curie-Weiss contribution. We found that subtractin = 0.00135 emu/mole from the measured (T) produces the straightest 1/χ(T), resulting in a good fit to the Curie-Weiss form, χ = C/(T − θ), where C is the Curie constant and, is the Weiss constant.
Figure 6.
Left: DC-Susceptibility Li2.15Os0.85O3 versus temperature. Also shown is the inverse susceptibility after subtracting a van Vleck term as described in the text. Right: ac-susceptibility versus temperature at different values of applied magnetic field. The curves have been offset vertically by 0.0020, 0.0032, 0.0044, and 0.0056 emu for H = 88, 126, 500, and 1000 G respectively, for clarity.
Fitting the data between 50 and 200 K yields a Weiss constant of θ = −11.5 K and a finite effective moment eff = 0.85 , significantly greater than expected for the Jeff = 0 state of Os(+4). Given the above XAS and neutron scattering refinement results showing that the average Os valence is 4.7, however, an alternate ionic scenario is for 70 of the Os ions to be in the +5 state (Jeff = ) and 30% in the +4 state (Jeff = 0). This analysis yields = 1.01 (θ = −11.8 K) for the magnetic (+5) ions, which is now significantly less than the expected moment.
We discuss possible sources of this discrepancy below. These χdc data were augmented with ac-susceptibility (χac) data down to 0.1 K, which were calibrated to the χdc data in the overlapping temperature range 2.0–2.5 K. A peak in χac is observed at 0.5 K, but is rapidly suppressed by magnetic fields far less than 0.1 T. Given the usual relationship between H and T for a g-factor of two, one expects suppression of an antiferromagnetic ordering feature at 0.5 K for H values an order of magnitude larger than observed. Alternatively, such a cusp in χac can be attributed to spin glass freezing, a scenario consistent with the high degree of disorder in this spin system. The spins involved in such freezing may not represent the bulk of the Os(+5) spin population, as we argue below.
The existence of a small subset of spins that are interacting at a mean field energy scale of kBT for T = 0.5 K, as suggested by the χac peak, is also supported by C(T, H), shown in Fig. 7. Here, C/T exhibits an upturn below its minimum at T = 6 K. This upturn is only moderately affected by fields up to 8 T, so we model this as C = C1(T) + C2(T, H). Here C1 is a combination of the lattice specific heat and an H-independent electronic contribution. Taking the difference between C(H = 8 T) and C(H = 0), we find that C2(T, H = 8 T) resembles a broadened Schottky anomaly (Fig. 7 upper inset). We can fit this contribution to either a single Jeff = (g = 1.3) Schottky anomaly or a pair of Jeff = (g = 2.6 and 7.4) Schottky anomalies with molar concentrations of 4.1 and 9.6 (total for the pair) respectively (Assuming 70 of the spins are magnetic, these fractions become 5.9 and 13.7%). Thus, it is not unlikely that the spins undergoing spin-glass-like freezing are the same spins responsible for the Curie-tail susceptibility. We now turn to the C1(T) term, which is calculated using the two different Schottky approximations mentioned above and plotted in the lower inset of Fig. 7. We note that, below 8 K, C1(T) Tα, where α = 0.69 and 0.57 for the Jeff = and Schottky analyses respectively. Such a sublinear form cannot persist down to the lowest temperatures, and importantly is clearly distinct from the phonon contribution visible above 8 K. At the same time, it appears that, among the 70 of Os ions that are in a +5 state (within an ionic picture) and thus possibly magnetic, less than 15 are accounted for in either susceptibility or field-dependent specific heat. If the sublinear low-T contribution is due to these unaccounted for, but nevertheless magnetic, Os(+5) ions, then they must be in a type of singlet state due to exchange interactions with a strength greater than the Zeeman energy of an 8 Tesla field, but of a type that invalidates the effective moment approximation below room temperature.
Figure 7.
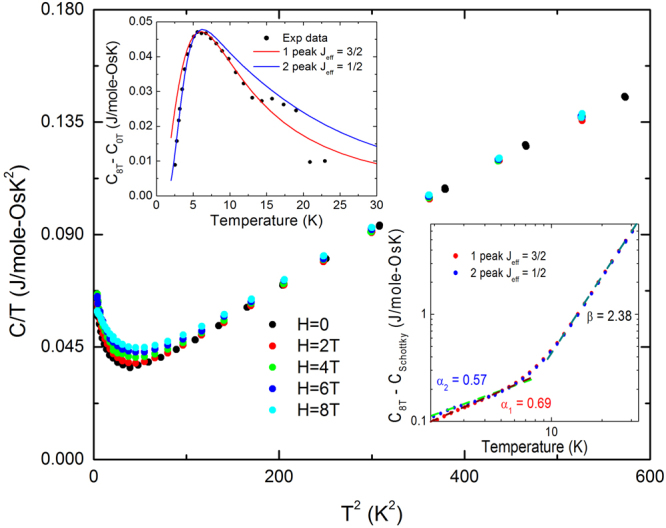
The specific heat C(T) of Li2.15Os0.85O3 in various applied fields, measured using a Physical Property Measurement System. Upper Inset: Impurity spins modeled with a Schottky anomaly. Lower Inset: Specific heat after removing the impurity contribution.
Electronic structure
Early model treatments of 5d oxides on honeycomb lattices built on the ionic description of crystal field splitting, additionally with strong SOC among orbitals, focused attention on the t2g subshell Jeff = and subspaces. The relevant energy scales of individual bandwidth W, Hubbard U, Hund’s JH, and SOC strength ξ, all lie in the 0.5–1.5 eV range, and studies of the electronic structure and especially the exchange coupling have concluded that the ionic picture provides a challenging starting point at best. The electronic structure of octahedral osmates is complicated by several features. First, the active t2g orbitals are strongly hybridized with the oxygen 2p orbitals, resulting in strongly coupled Os 5d − O 2p states as the fundamental chemical unit. Osmates in the Ba2NaOsO6 family, for example, have half of the spin density residing on the O octahedron38,39. Iridates behave similarly, leading to their characterization as molecular orbital compounds, which can lead to longer range exchange coupling parameters compared to more localized moments40. Second, SOC also affects the electronic structure, creating both single-ion as well as exchange anisotropy, the relative effects of which are difficult to disentangle. Third, the distortion from ideal rhombohedral symmetry introduces new lower symmetry Fourier components of the potential that causes band anti-crossings. These in turn result in very narrow, 0.3 eV, individual bandwidths and the likelihood of small gaps, as shown below.
Several theoretical studies of honeycomb iridates have concluded that magnetic interactions beyond the Heisenberg-Kitaev model are important, suggesting a more itinerant picture of the electronic structure19,41–46. Many of the general findings for iridates carry over to osmates. Our compound presents the additional complication of Os possessing a nominal valence of +4.7, so one must consider a mixture of d3 with d4 ions. The ionic picture of d4 begins with a non-magnetic Jeff = 0 ion and for d3 the ionic value is Jeff = , and the insulating nature suggests these different ionic states reside on distinct lattice sites, as opposed to the intermediate valence picture. In this ionic picture, the measured = 0.85 is challenging to account for, as mentioned above, which leads us to consider the general question of moment formation in nearly itinerant systems.
In an effort to reconcile the valence state measurements with the magneto-thermal measurements, we have applied density functional theory (DFT) methods including SOC, correlation effects, and a fixed atomic spin moment method in our study of Li2OsO3 (see Methods for the description)47–52. Without magnetism, SOC is strong enough to provide a pseudogap but no gap, within the Os t2g bands. This SOC-driven separation is compromised by crystal subfield splittings, bandwidth effects, and anti-crossings arising from structural distortion away from rhombohedral symmetry leaving two inequivalent Os sites. The resulting band structure (not shown) is that of a very narrow, essentially zero (indirect) gap semiconductor. Due to the molecular orbital nature of the t2g band complex, intra-atomic repulsion effects as treated by the Hubbard U repulsion are ineffective in opening a gap, for reasonable values of U (2 eV or less). Antiferromagnetic order tends to encourage gap opening, producing Os moments of 0.3 .
To include in the modeling the effect of the observed Os moment, we have adopted the constrained atomic moment method as implemented in the abinit code47. This method proceeds not by specifying a value for U for the Os 5d orbitals, but by fixing the spin moment by applying an intra-atomic Zeeman field determined self-consistently; both magnitude and direction can be specified separately for any atom. Magnitudes of 0.8 and 0.5 have been studied; the latter value represents the ordered component expected of a 0.8 local (C-W) moment. Bandgaps of 0.25 eV and larger were obtained, depending weakly on the imposed moment but strongly on the magnetic alignment (the larger ones were for AFM order). The resulting orbital moments are minor, only a few hundredths of 1 , independent of the chosen direction of spin. These results do not fit that of a Mott insulator: there is no robust local moment, and Hubbard U is not needed to open a gap and has little effect on the size of the gap. Thus our model rationalizes the observations of a narrow transport gap and small magnetic moment in Li2. 15Os0.85O3.
Due to intermixing of Li on the Os honeycomb lattice, we have made an initial study of the effect of intermixing, by replacing 25 of the Os sublattice by Li while keeping the Li sublattice intact. The Os moments are fixed with magnitude 0.8 and oriented along separate (111) axes to mimic disordered moments. The resulting band structure, shown in Fig. 8, illustrates the flat individual bands that arise, and that a very small gap exists or is imminent, depending on details of the calculations. The bands are not significantly different in appearance from those of Li2OsO3.
Figure 8.
Plot of bands in the Os t2g region of 25 Li-substituted Li2OsO3 on the Os honeycomb sublattice, with energy zero (horizontal red dashed line) denoting the gap region. The fatbands plots emphasize the Os 5d character on (a) the Os[0] site with no Li neighbor, (b) the Os[1] site with one Li neighbor, and (c) the Os[2] site with two Li neighbors. While Os[0] and Os[1] show some differences, Os[2] is qualitatively different.
We now focus on the effect of Li substitution on the remaining Os ions. This 25 replacement results in three Os sites, denoted by Os[j] which has j Li neighbors, j = 0, 1 or 2. The formal valences of Os in this Li2(Li1/4Os3/4)O3 structure should average to 5+. The periodicity leaves Os[0]-Os[1] chains and comparatively isolated Os[2] ions, which in addition to two Li neighbors the Os neighbor is at a long Os-Os separation. The spectral distribution of Os[2] in Fig. 8 is substantially different from the other two, more representative of a lower oxidation state. While simple electron count indicates that Li substitution must oxidize some Os ions, having two Li neighbors strongly affects the formal valence of the Os ion.
This modeling illustrates that the Os valence is sensitive not only to the total charge available, but also to the local environment. Different valence states carry different moments, and sensitivity to the local environment suggests that variation of exchange constants promotes a frustration of magnetic order. Note in Fig. 8 that the spectral distributions of 5d weight are significantly different for Os[0] and Os[1], while that of Os[2] is less weight in the occupied bands. This implication then is that of one Os(4+) ions and two Os(5+) ion, with an average valence of 4.67 consistent with spectroscopic evidence on our samples. More of a specific nature cannot be concluded because the Os moments were constrained (to be equal), whereas those of different valence states would not be equal.
Summary
We have presented the first example of Os on a honeycomb structure, Li2.15(3)Os0.85(3)O3, and have characterized it with atomic, structural, and magneto-thermal probes. The Os ions have an average valence state of +4.7 and large site disorder exists in the honeycomb layers. This compound is a narrow band gap semiconductor. The magnetic susceptibility and specific heat present a picture in which the effective Os moment is reduced to a value well below that expected from the valence-state measurements, which suggests that the valence electrons are on the verge of itineracy, a conclusion supported by our density functional theory calculations. These results strongly suggest that spin orbit coupling of Os is playing an important role in the collective electronic behavior of this honeycomb system, and that further studies of osmates on frustrating lattices are warranted.
Methods
Synthesis and Structure Characterization
Stoichiometric amounts of Li2CO3 and OsO2 (synthesized from osmium metal) were intimately ground, pressed into a pellet, loaded into an alumina crucible, and fired in a tube furnace at 700 C under Argon flow. Firing was repeated to 850 C with 50 C increments, grinding the sample before each firing. Each firing was performed under argon flow. Phase analysis of the powder samples was performed by X-ray diffraction using a Rigaku MiniFlex II diffractometer with Cu K radiation and a graphite monochromator for the diffracted beam. Time of Flight (TOF) neutron diffraction measurements were collected at ORNL NOMAD BL-1B SNS beamline. X-ray absorption spectroscopy measurements were carried out at beamline 4-ID-D of the Advanced Photon Source at Argonne National Laboratory using a transmission geometry. Reference samples for valence determination included Os metal, Os4+O2 and Sr2FeOs5+O653.
Electronic and Thermal Properties
The Seebeck coefficient and electrical conductivity data (350 K–600 K) were collected on an ULVAC ZEM-3 under a helium atmosphere. Magnetization measurements (2 K–300 K) were obtained with a Quantum Design MPMS. Resistivity, (T), (200 K–350 K) and specific heat, C(T), data (2 K–30 K) were obtained using a Quantum Design PPMS. Magnetic ac-susceptibility data down to 0.1 K were obtained in a 3He-4He dilution refrigerator with thermal contact to the mixing chamber made via a copper wire bundle bonded to the sample with Stycast 1266 epoxy. Data were obtained at 143 Hz and with an excitation current low enough to eliminate heating from the coils.
Theoretical Methods
We use the open-source package ABINIT48 to perform electronic calculations, with the generalized gradient approximation (GGA)49 for the semilocal exchange-correlation functional and the projector augmented wave method (PAW)50 for core electrons. A Hubbard U repulsive interaction was applied with magnitude as indicated, Hund’s JH = 0.4 eV was applied, on the Os 5d orbitals51. A mesh of 9 × 5 × 9 was used for k-sampling and 500 eV for energy cutoff. The constrained atomic spin moment on Os method52 was used in some calculations to fix moments at or near the observed value. Constraints are managed by the use of Lagrangian multipliers, imposed with constraint parameters; the input parameter λ = 1.0 was used48.
Electronic supplementary material
Acknowledgements
This work is supported by NSF DMREF Grant Nos DMR-1534711 (M.A.S), DMR-1534741 (A.P.R), DMR-1534719 (W.E.P.) and DMR-1534734(D.S.D). Work at Argonne is supported by the U.S. Department of Energy, Office of Science, Office of Basic Energy Sciences under Contract No. DE-AC-02-06CH11357. The authors would like to acknowledge ORNL for providing access to their neutron research facilities. For computation, the National Energy Research Scientific Computing Center (NERSC), a DOE Office of Science User Facility supported by DOE under Contract No. DE-AC02-05CH11231, as well as an in-house cluster at UC Davis, are gratefully acknowledged.
Author Contributions
M.A.S. and A.P.R. conceived the interest. M.K.W. designed, constructed, and carried out the synthesis. P.G.L. and M.K.W. collected electronic and magnetic properties. M.K.W. and J.L. performed TOF neutron refinements and M.K.W. performed stacking fault modeling. S.T.P. and W.E.P. performed DFT calculations. D.H. collected and analyzed XAS measurements. A.P.R., W.E.P., D.S.D., and P.G.L. analyzed and discussed electronic properties and M.A.S., M.K.W., and J.L. discussed structure characterization. All authors contributed to the manuscript.
Competing Interests
The authors declare no competing interests.
Footnotes
Electronic supplementary material
Supplementary information accompanies this paper at 10.1038/s41598-018-25028-0.
Publisher's note: Springer Nature remains neutral with regard to jurisdictional claims in published maps and institutional affiliations.
References
- 1.Khaliullin G. Excitonic magnetism in van vleck-type d4 mott insulators. Physical Review Letters. 2013;111:197201. doi: 10.1103/PhysRevLett.111.197201. [DOI] [PubMed] [Google Scholar]
- 2.Kitaev A. Anyons in an exactly solved model and beyond. Annals of Physics. 2006;321:2–111. doi: 10.1016/j.aop.2005.10.005. [DOI] [Google Scholar]
- 3.Felner I, Bradarić IM. The magnetic behavior of Li2MO3 (M = Mn, Ru and Ir) and Li2(Mn1−xRux)O3. Physica B: Condensed Matter. 2002;311:195–199. doi: 10.1016/S0921-4526(01)01038-9. [DOI] [Google Scholar]
- 4.James ACWP, Goodenough J. Structure and bonding in Li2MoO3 and Li2−xMoO3 (0 ≤ x ≤ 1.7) J. Solid State Chem. 1988;76:87–96. doi: 10.1016/0022-4596(88)90194-6. [DOI] [Google Scholar]
- 5.Lee S, et al. Antiferromagnetic ordering in Li2MnO3 single crystals with a two-dimensional honeycomb lattice. Journal of Physics: Condensed Matter. 2012;24:456004. doi: 10.1088/0953-8984/24/45/456004. [DOI] [PubMed] [Google Scholar]
- 6.Wang JC, et al. Lattice-tuned magnetism of Ru4 + (4d4) ions in single-crystals of the layered honeycomb ruthenates: Li2RuO3 and Na2RuO3. Phys. Rev. B. 2014;90:161110. doi: 10.1103/PhysRevB.90.161110. [DOI] [Google Scholar]
- 7.Breger J, et al. High-resolution X-ray diffraction, DIFFaX, NMR and first principles study of disorder in the Li2MnO3-Li[Ni1/2Mn1/2]O2 solid solution. J. Solid State Chem. 2005;178:2575–2585. doi: 10.1016/j.jssc.2005.05.027. [DOI] [Google Scholar]
- 8.Schmidt W, Berthelot R, Etienne L, Wattiaux A, Subramanian MA. Synthesis and characterization of O3-Na3LiFeSbO6: A new honeycomb ordered layered oxide. Mater. Res. Bull. 2014;50:292–296. doi: 10.1016/j.materresbull.2013.10.049. [DOI] [Google Scholar]
- 9.Lu Z, Dahn JR. Effects of stacking fault defects on the X-ray diffraction patterns of T2, O2, and O6 structure Li2/3[CoxNi1/3−xMn2/3]O2. Chemistry of Materials. 2001;13:2078–2083. doi: 10.1021/cm000885d. [DOI] [Google Scholar]
- 10.Torres-Castro L, Abreu-Sepulveda MA, Katiyar RS, Manivannan A. Electrochemical investigations on the effect of Mg-substitution in Li2MnO3 cathode. Journal of the Electrochemical Society. 2017;164:A1464–A1473. doi: 10.1149/2.0661707jes. [DOI] [Google Scholar]
- 11.Hodeau JL, Marezio M, Santoro A, Roth RS. Neutron profile refinement of the structures of Li2SnO3 and Li2ZrO3. Journal of Solid State Chemistry. 1982;45:170–179. doi: 10.1016/0022-4596(82)90273-0. [DOI] [Google Scholar]
- 12.Manni S, et al. Effect of isoelectronic doping on honeycomb lattice iridate A2IrO3. Phys. Rev. B. 2014;89:1–7. [Google Scholar]
- 13.Singh Y, Gegenwart P. Antiferromagnetic mott insulating state in single crystals of the honeycomb lattice material. Phys. Rev. B. 2010;82:1–7. [Google Scholar]
- 14.Mccalla E, et al. Visualization of O-O peroxo-like dimers in high-capacity layered oxides for li-ion batteries. Science. 2015;350:1516–1521. doi: 10.1126/science.aac8260. [DOI] [PubMed] [Google Scholar]
- 15.Okada S, et al. Cathode characteristics of layered rocksalt oxide, Li2PtO3. Electrochim. Acta. 1999;45:329–334. doi: 10.1016/S0013-4686(99)00214-5. [DOI] [Google Scholar]
- 16.Baklanova YV, et al. Photo- and radioluminescence of lithium hafnate Li2HfO3. Optical Materials. 2012;34:1037–1041. doi: 10.1016/j.optmat.2011.12.024. [DOI] [Google Scholar]
- 17.Kobayashi H, Tabuchi M, Shikano M, Kageyama H, Kanno R. Structure, and magnetic and electrochemical properties of layered oxides, Li2IrO3. J. Mater. Chem. 2003;13:957–962. doi: 10.1039/b207282c. [DOI] [Google Scholar]
- 18.Kumari SL, et al. Charge transfer instability in a mixed Ir/Rh honeycomb lattice in Li2Ir1−xRhxO3 solid solution. Solid State Sciences. 2016;61:232–238. doi: 10.1016/j.solidstatesciences.2016.10.001. [DOI] [Google Scholar]
- 19.Yogesh S, et al. Relevance of the heisenberg-kitaev model for the honeycomb lattice iridates A2IrO3. Phys. Rev. Lett. 2012;108:127203. doi: 10.1103/PhysRevLett.108.127203. [DOI] [PubMed] [Google Scholar]
- 20.Singh Y, Gegenwart P. Antiferromagnetic mott insulating state in single crystals of the honeycomb lattice material, Na2IrO3. Phys. Rev. B. 2010;82:064412. doi: 10.1103/PhysRevB.82.064412. [DOI] [Google Scholar]
- 21.Takayama T, Kato A, Dinnebier R, Nuss J, Takagi H. Hyper-honeycomb iridate β-Li2IrO3 as a platform for kitaev magnetism. Phys. Rev. Lett. 2015;114:077202. doi: 10.1103/PhysRevLett.114.077202. [DOI] [PubMed] [Google Scholar]
- 22.Banerjee A, et al. Neutron scattering in the proximate quantum spin liquidα-RuCl3. Science. 2017;356:1055–1059. doi: 10.1126/science.aah6015. [DOI] [PubMed] [Google Scholar]
- 23.Ramirez AP. Strongly geometrically frustrated magnets. Ann. Rev, Mater. Sci. 1994;24:453–480. doi: 10.1146/annurev.ms.24.080194.002321. [DOI] [Google Scholar]
- 24.Makintosh, A. R. & Andersen, O. K. Electrons at the Fermi Surface, vol. 149 (M. Springford, 1980).
- 25.Heiba ZK, El-Sayed K. Structural and anisotropic thermal expansion correlation of Li2ZrO3 at different temperatures. Journal of Applied Crystallography. 2002;35:634–636. doi: 10.1107/S0021889802011214. [DOI] [Google Scholar]
- 26.Jansen V, Hoppe RZ. Zur kenntnis der nacl-strukturfamilie: Neue untersuchungen an Li2MnO3. Anorg. Allg. Chem. 1973;397:279. doi: 10.1002/zaac.19733970307. [DOI] [Google Scholar]
- 27.Boulineau A, Croguennec L, Delmas C, Weill F. Reinvestigation of Li2MnO3 structure: Electron diffraction and high resolution TEM. Journal of Applied Crystallography. 2009;21:4216–4222. [Google Scholar]
- 28.Hibble SJ, Fawcett ID, Hannon AC. Structure of two disordered molybdates, Li2MoIVO3 and Li4Mo3IVO8, from total neutron scattering. Acta Crystallographica. 1997;B53:604–612. doi: 10.1107/S0108768197003844. [DOI] [Google Scholar]
- 29.O’Malley MJ, Verweij H, Woodward PM. Structure and properties of ordered Li2IrO3 and Li2PtO3. Journal of Solid State Chemistry. 2008;181:1803–1809. doi: 10.1016/j.jssc.2008.04.005. [DOI] [Google Scholar]
- 30.O’Malley, M. J. & Woodward, P. M. A Structural, Bonding, and Properties Study of the Ordered Rock Salt Structures, Li2MO3 (M = Ru, Ir, Pt) (Dissertation Thesis, Ohio State University, 2009).
- 31.Katukuri VM, et al. Strong magnetic frustration and anti-site disorder causing spin-glass behavior in honeycomb Li2RhO3. Scientific Reports. 2018;5:14718. doi: 10.1038/srep14718. [DOI] [PMC free article] [PubMed] [Google Scholar]
- 32.Lei H, Yin W-G, Zhong Z, Hosono H. Structural, magnetic, and electrical properties of Li2Ir1−xRuxO3. Physical Review B. 2014;89:020409. doi: 10.1103/PhysRevB.89.020409. [DOI] [Google Scholar]
- 33.Larson, A. C. & Von-Dreele, R. B. General structure analysis system (GSAS). Los Alamos National Laboratory Report 86–748 (1994).
- 34.Toby BH. EXPGUI, a graphical user interface for GSAS. Journal of Applied Crystallography. 2001;34:210–213. doi: 10.1107/S0021889801002242. [DOI] [Google Scholar]
- 35.Treacy MMJ, Newsam JM, Deem MW. A general recursion method for calculating diffracted intensities from crystals containing planar faults. Proc. R. Soc. Lond. Ser. A. 1991;433:499. doi: 10.1098/rspa.1991.0062. [DOI] [Google Scholar]
- 36.van der Laan G, Thole BT. Local probe for spin-orbit interaction. Physical Review Letters. 1988;60:1977. doi: 10.1103/PhysRevLett.60.1977. [DOI] [PubMed] [Google Scholar]
- 37.van der Laan G, Thole BT. Orbital magnetism and spin-orbit effects in the electronic structure of BaIrO3. Physical Review Letters. 2010;105:216407. doi: 10.1103/PhysRevLett.105.216407. [DOI] [PubMed] [Google Scholar]
- 38.Laguna-Marco MA, et al. Orbital magnetism and spin-orbit effects in the electronic structure of BaIrO3. Physical Review Letters. 2010;105:216407. doi: 10.1103/PhysRevLett.105.216407. [DOI] [PubMed] [Google Scholar]
- 39.Gangopadhyay S, Pickett WE. Interplay between spin-orbit coupling and strong correlation effects: Comparison of the three osmate double perovskites Ba2AOsO6 (A = Na, Ca, Y) Physical Review B. 2016;93:155126. doi: 10.1103/PhysRevB.93.155126. [DOI] [Google Scholar]
- 40.Mazin II, Jeschke HO, Foyevtsova K, Valentí R, Khomskii DI. Na2IrO3 as a molecular orbital crystal. Phys. Rev. Lett. 2012;109:197201. doi: 10.1103/PhysRevLett.109.197201. [DOI] [PubMed] [Google Scholar]
- 41.Mazin II, et al. Origin of the insulating state in honeycomb iridates and rhodates. Phys. Rev. B. 2013;88:035115. doi: 10.1103/PhysRevB.88.035115. [DOI] [Google Scholar]
- 42.Yamaji Y, Nomura Y, Kurita M, Arita R, Imada M. First-principles study of the honeycomb-lattice iridates Na2IrO3 in the presence of strong spin orbit interaction and electronic correlations. Phys. Rev. lett. 2014;113:107201. doi: 10.1103/PhysRevLett.113.107201. [DOI] [PubMed] [Google Scholar]
- 43.Nishimoto S, et al. Strongly frustrated triangular spin lattice emerging from triplet dimer formation in honeycomb Li2IrO3. Nat. Commun. 2016;7:10273. doi: 10.1038/ncomms10273. [DOI] [PMC free article] [PubMed] [Google Scholar]
- 44.Hu K, Wang F, Feng J. First-principles study of the magnetic structure of Na2IrO3. Phys. Rev. Lett. 2015;115:167204. doi: 10.1103/PhysRevLett.115.167204. [DOI] [PubMed] [Google Scholar]
- 45.Kim M, Kim BH, Min BI. Insulating nature of Na2IrO3: Mott-type or slater-type. Phys. Rev. B. 2016;93:195135. doi: 10.1103/PhysRevB.93.195135. [DOI] [Google Scholar]
- 46.Li Y, Winter SM, Jeschke HO, Valenti R. Electronic excitations in gamma-Li2IrO3. Phys. Rev. B. 2017;95:045129. doi: 10.1103/PhysRevB.95.045129. [DOI] [Google Scholar]
- 47.Gonze X, et al. Abinit: first-principles approach to materials and nanosystem properties. Comp. Phys. Commun. 2009;180:2582. doi: 10.1016/j.cpc.2009.07.007. [DOI] [Google Scholar]
- 48.Gonze X, et al. Recent developments in the ABINIT software package. Computer Phys. Comm. 2016;205:106. doi: 10.1016/j.cpc.2016.04.003. [DOI] [Google Scholar]
- 49.Perdew JP, Burke K, Ernzerhof M. Generalized gradient approximation made simple. Phys. Rev. Lett. 1996;77:3865. doi: 10.1103/PhysRevLett.77.3865. [DOI] [PubMed] [Google Scholar]
- 50.Torrent M, Jollet F, Bottin F, Zerah G, Gonze X. Implementation of the projector augmented-wave method in the ABINIT code. Comput. Mat. Science. 2008;42:337. doi: 10.1016/j.commatsci.2007.07.020. [DOI] [Google Scholar]
- 51.Amadon B, Jollet F, Torrent M. Gamma and beta cerium: LDA + U calculations of ground-state parameters. Phys. Rev. B. 2008;77:155104. doi: 10.1103/PhysRevB.77.155104. [DOI] [Google Scholar]
- 52.O’Regna DD, Teobaldi G. Optimization of constrained density functional theory. Phys. Rev. 2016;94:035159. doi: 10.1103/PhysRevB.94.035159. [DOI] [Google Scholar]
- 53.Veiga LSI, et al. Fragility of ferromagnetic double exchange interactions and pressure tuning of magnetism in 3d–5d double perovskite Sr2FeOsO6. Physical Review B. 2015;91:235135. doi: 10.1103/PhysRevB.91.235135. [DOI] [Google Scholar]
Associated Data
This section collects any data citations, data availability statements, or supplementary materials included in this article.


