

Abstract
Bacterial populations can use bet‐hedging strategies to cope with rapidly changing environments. One example is non‐growing cells in clonal bacterial populations that are able to persist antibiotic treatment. Previous studies suggest that persisters arise in bacterial populations either stochastically through variation in levels of global signalling molecules between individual cells, or in response to various stresses. Here, we show that toxins used in contact‐dependent growth inhibition (CDI) create persisters upon direct contact with cells lacking sufficient levels of CdiI immunity protein, which would otherwise bind to and neutralize toxin activity. CDI‐mediated persisters form through a feedforward cycle where the toxic activity of the CdiA toxin increases cellular (p)ppGpp levels, which results in Lon‐mediated degradation of the immunity protein and more free toxin. Thus, CDI systems mediate a population density‐dependent bet‐hedging strategy, where the fraction of non‐growing cells is increased only when there are many cells of the same genotype. This may be one of the mechanisms of how CDI systems increase the fitness of their hosts.
Keywords: bet‐hedging, contact‐dependent growth inhibition, persisters, toxin
Subject Categories: Microbiology, Virology & Host Pathogen Interaction; Signal Transduction
Introduction
Clonal populations of bacteria often show remarkable phenotypic variability in gene expression (Elowitz et al, 2002; Ozbudak et al, 2002) and growth rate (Balaban et al, 2004). Such population heterogeneity can be useful for division of labour between cells (Ackermann, 2015) or as a bet‐hedging strategy where short time fitness is sacrificed in a fraction of the cells to ensure survival of the population upon rapid changes to harsh conditions (Veening et al, 2008). For example, non‐growing cells in a heterogeneous bacterial population are able to tolerate antibiotic treatment, a phenomenon referred to as persistence (Balaban et al, 2004; Keren et al, 2004a). Persisters consist of heterogeneous populations of cells with transient phenotypes that allow them to survive antibiotic exposure through different mechanisms (Amato et al, 2013; Amato & Brynildsen, 2015; Pu et al, 2016). When the concentration of antibiotics in the host subside, for example at the end of therapy, the non‐growing persisters can cause a relapse of the infection (Butler, 2011).
Even though the persistence phenomenon has been known for decades (Bigger, 1944), the mechanisms of persister formation have only recently been investigated. Isolation of high persistence (hip) mutants indicated that persisters constitute a pre‐existing subpopulation of cells that form stochastically in bacterial populations (Moyed & Bertrand, 1983). The first identified and most excessively studied hip alleles were identified in the hipBA locus, which encodes a toxin–antitoxin (TA) system (Moyed & Bertrand, 1983; Korch et al, 2003). When the levels of the HipA toxin exceed a threshold in single cells, growth is arrested (Balaban et al, 2004). HipA phosphorylates an amino acid close to the active site of the glutamyl‐tRNA synthetase enzyme (GltX), which in turn inhibits aminoacylation, inducing a conserved bacterial response to nutrient starvation known as the stringent response (Germain et al, 2013). During the stringent response in Escherichia coli, RelA and SpoT synthesize (p)ppGpp, an alarmone that directly interacts with RNA polymerase and thereby changes the expression of more than 500 genes, decelerating growth (Durfee et al, 2008; Traxler et al, 2008). One widely accepted model suggests that persister subpopulations arise from what appears to be stochastic cell‐to‐cell variation in the level of the signalling molecule (p)ppGpp. Cells with sufficiently high (p)ppGpp concentrations activate the Lon protease (Kuroda et al, 2001; Maisonneuve et al, 2013), which can degrade antitoxins and other unfolded proteins. Degradation of antitoxins results in unneutralized toxins that become free to corrupt essential processes in the cell, ultimately entailing growth arrest and entry into a persister state (Appendix Fig S1A; Keren et al, 2004b; Maisonneuve et al, 2011, 2013; Vazquez‐Laslop et al, 2006). A recent study suggested an addition to this model where increased ATP levels in some cells, rather than low (p)ppGpp levels, result in a subpopulation of cells tolerant to antibiotics (Conlon et al, 2016; Shan et al, 2017). Interestingly, increased (p)ppGpp levels also result in expression of the type I HokB toxin, mediated by the GPTase Obg. HokB dissipates the proton motive force and depletes cellular ATP levels (Verstraeten et al, 2015; Appendix Fig S1A), suggesting that stochastic variation in (p)ppGpp could influence the ATP levels in cells and that the two models are not necessarily exclusive of one another.
Like intracellular TA systems, contact‐dependent growth inhibition (CDI) systems also inhibit cell growth through toxin‐dependent mechanisms (Aoki et al, 2005, 2010). During CDI, cells encoding CDI systems express a two‐component system, where the β‐barrel transporter CdiB exports and displays the CdiA protein on the cell surface (Ruhe et al, 2013a). CdiA proteins are modular, comprising of an N‐terminal domain of triple stranded beta helix structure, a receptor binding domain and a C‐terminal toxin domain (CdiA‐CT) (Ruhe et al, 2013a, 2017). Upon contact with cells carrying the correct species‐specific receptor [β‐barrel assembly machine protein A, BamA (Ruhe et al, 2013b), outer membrane protein OmpC (Beck et al, 2016) or small‐molecule transporter Tsx, respectively, for different CdiA binding domains (Ruhe et al, 2017)], the CdiA protein binds to its cognate receptor, undergoes a proteolytic cleavage event and delivers its toxic CT into target cells (Webb et al, 2013; Fig EV1A). To avoid auto‐inhibition, cells with CDI systems express an immunity protein, CdiI, that prevents toxicity by forming a tight complex with the CdiA‐CT (Fig EV1A and B; Aoki et al, 2010, 2005). Different toxins have distinct toxic activities. For example, the CdiA‐CT from EC93 (CdiA‐CTEC93) acts as an ionophore toxin dissipating the proton motive force (Fig EV1A, lower left panel; Aoki et al, 2009), whereas the CdiA‐CT from uropathogenic E. coli 536 (CdiA‐CTUPEC536) and enterohemorrhagic E. coli 869 (CdiA‐CTEC869) are nucleases that cleave tRNAs (Fig EV1A, upper and lower right panels; Aoki et al, 2010; Diner et al, 2012; Jones et al, 2017). A peculiar attribute suggested for CDI is that toxin delivery is limited to its own species, which allows CDI‐positive cells to deliver toxins between one another, but limits competitiveness in populations with mixed bacterial species (Ruhe et al, 2013b). Thus, the evolutionary benefit of inhibiting the growth specifically of the same species is unclear.
Figure EV1. Overview of the plasmid and chromosomally encoded contact‐dependent growth inhibition systems.
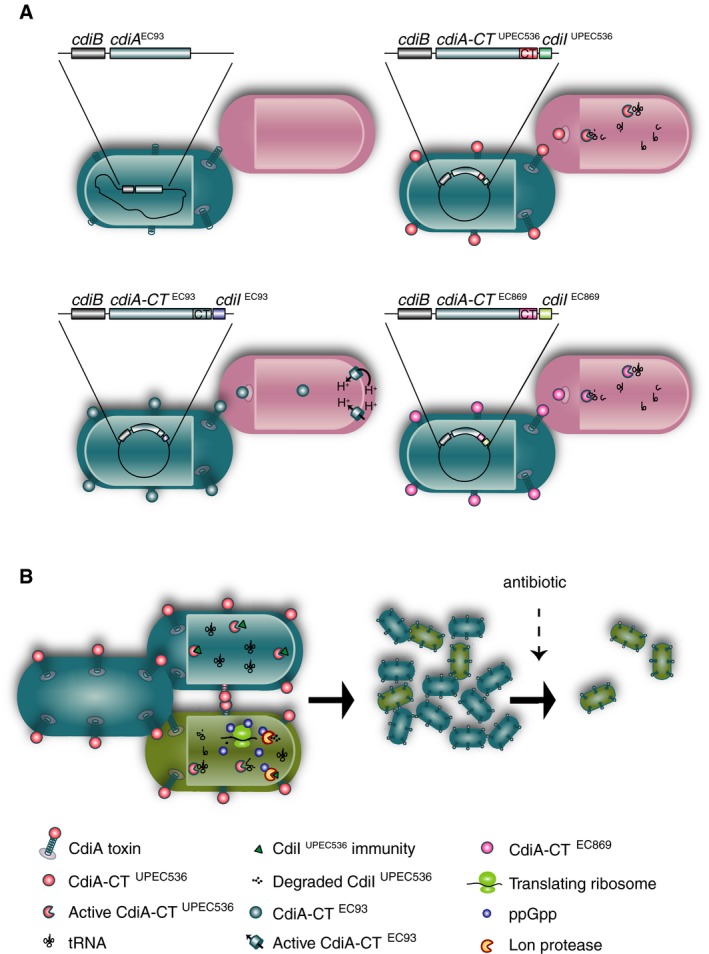
- The cdiBA locus from EC93‐expressing CdiB and the N‐terminal part of CdiA, but no CT or immunity from the native EC93 cdiBAI promoter was used as for all constructs. The constructs were modified to contain the C‐terminal toxins and cognate immunity genes from EC93 (CdiA‐CT‐IEC93), UPEC 536 (CdiA‐CT‐IUPEC536) or EC869 (CdiA‐CT‐IEC869). These constructs were either inserted on the MG1655 chromosome as indicated for the CdiBAEC93 (upper left), or on the medium‐copy pWEB vector as indicated for the CdiA‐CT‐IEC93 (lower left), CdiA‐CT‐IUPEC 536 (upper right) or CdiBA‐CT‐IEC869 (lower right). Cells with these systems (turquoise) deliver C‐terminal toxins with distinct activities to target cells (pink), resulting in growth arrest due to collapse of the membrane potential (lower left) or degradation of tRNA (upper and lower right) in the target cell.
- In an isogenic population of CDI‐positive cells (turquoise and green), in some cells (green) the toxin molecules outnumber the immunity proteins, resulting in toxin‐induced stringent response, which in turn results in the degradation of CdiI immunity protein, and a feedforward cycle where amplification of a small signal results in arrested cell growth in an all‐or‐none manner.
Cells undergoing CDI mediated by CdiA‐CTEC93 show a reversible downregulation of steady‐state ATP levels. Inhibited cells can restart growth up to 6 h into growth arrest, upon induced expression of the immunity protein (Aoki et al, 2009). This shows that CDI can be reversible and results in inhibition of growth rather than cell death. However, whether CDI contributes to population heterogeneity in terms of growth has not yet been investigated. Here, we show that CDI increases the fraction of persisters in bacterial populations. These persisters are formed in the presence of CdiI through a feedforward cycle in which the toxins induce the stringent response, resulting in Lon‐mediated degradation of the CDI immunity proteins and growth arrest (Fig EV1B). In contrast to previously identified toxins that contribute to persister formation, CDI only creates non‐growing cells upon cell‐to‐cell contact. Cell‐to‐cell contacts are more common at high cell densities; for example, both stationary phase and in biofilms are conditions where persisters are found frequently (Spoering & Lewis, 2001; Keren et al, 2004a; Maisonneuve et al, 2013; Gutierrez et al, 2017). But in contrast to previously identified systems involved in generation of persisters, CDI functions as a quorum sensing system where an increased fraction of persisters is generated only when there are many cells of the same genotype. Thus, this suggests that it is cell number and not nutrient availability that determines when more persisters are formed through CDI. As the contact‐dependent mechanism facilitates persister formation only when there are many cells of the same genotype, increasing the fraction of non‐growing cells will have little effect on the growth of the entire population. This makes density‐dependent regulation of persister formation through CDI a highly rational bet‐hedging strategy that does not limit population expansion.
Results
CDI toxins increase bacterial survival to antibiotics
Cells inhibited by the CdiA‐CTEC93 toxin show characteristics typical of persister cells (Aoki et al, 2009), yet whether CDI systems contribute to antibiotic tolerance has not been tested. To examine a possible role of CDI in generation of persisters, we removed the cdiBAI loci in the E. coli strain EC93 where CDI was first discovered (Aoki et al, 2005). EC93 cells deleted for the CDI loci had 5–10 times fewer survivors than wild‐type EC93 cells after 3 h of treatment with bactericidal antibiotics [ciprofloxacin, CIP (Fig 1A and Appendix Fig S2A) or cefotaxime, CEF (Fig EV2A and Appendix Fig S3A)], suggesting that CDI systems could be involved in the generation of persisters. For clarity, we use the term survival instead of persister frequency when referring to figures throughout the paper. Similarly, although to lesser extent, uropathogenic E. coli UPEC 536 cells lacking the toxic C‐terminal domain and cognate cdiI gene (cdiA ΔCT–I) had ~50% fewer survivors after CIP (Fig 1B and Appendix Fig S2B) and CEF (Fig EV2B and Appendix Fig S3B) treatment. This strain has previously been shown to express very little cdiBAI during laboratory conditions (Aoki et al, 2010), which could explain why only a small difference could be observed between cells with and without CDI toxin. The C‐terminal domains of CdiA proteins from various E. coli strains encode toxins with different activity and we therefore wanted to investigate if the ability to increase the fraction of non‐growing cells in a population was limited to the CdiA toxin from EC93, or if other CdiA toxins also contribute to persister formation when expressed. We chose two additional CdiA toxins from other E. coli strains and used a previously described simplified system to test this. In these constructs, the entire CDI locus from E. coli strain EC93, expressing cdiBAI with either the native EC93 toxin (CdiA‐CT‐IEC93), the UPEC536 toxin (CdiA‐CT‐IUPEC536), or the EC869 main toxin (CdiA‐CT‐IEC869), and their respective cognate immunity protein were cloned into a medium‐copy vector downstream of the native EC93 promoter (Fig EV1A; Aoki et al, 2010, 2005). These plasmids as well as an empty vector control were transferred to E. coli MG1655 cells. For all experiments, the empty vector control was used to determine how the presence of the plasmid in the absence of CDI affected persister formation. Inhibitor strains carrying the entire cdiBAI locus on a medium‐copy number plasmid were exposed to CIP or CEF, and survivors were counted. MG1655 cells with cdi‐loci (either CdiA‐CT‐IEC93, CdiA‐CT‐IUPEC536, or CdiA‐CT‐IEC869 toxins) displayed 6–10 (CIP) (Fig 1C and Appendix Fig S2C) and 10–100 times (CEF) (Fig EV2C and Appendix Fig S3C) more survivors than the empty vector control strain after 3 h of antibiotic treatment. As CDI toxins are delivered from one cell to another upon cell‐to‐cell contacts, the number of molecules delivered is expected to be low also when the delivering cell has multiple copies of the CDI loci. However, most CDI loci are found on the bacterial chromosome, that is, in one copy per cell. To test if the presence of CDI loci on the chromosome increased persister formation in MG1655 [as was observed in EC93 (Fig 1A)], we inserted the entire cdiBAI loci from the CdiA‐CT‐IEC93 and CdiA‐CT‐IUPEC536 vectors downstream of the lacA gene on the MG1655 chromosome. To verify that these chromosomal copies of the cdiBAI genes were able to mediate CDI, we mixed these strains with MG1655 cells marked with a chromosomal chloramphenicol (cat) resistance marker (lacA‐cat) and observed viability over time. MG1655 cells with chromosomally encoded cdiBA‐CT‐I EC93 or cdiBA‐CT‐I UPEC536 loci inhibited the growth of MG1655 cells similarly as observed with the plasmid based constructs described previously (Appendix Fig S4A and B), suggesting that these new constructs were active in CDI. Interestingly, MG1655 cells with chromosomally encoded cdiBA‐CT‐I EC93 or cdiBA‐CT‐I UPEC536 loci showed 10‐fold increase in persisters to CIP (Fig 1D and Appendix Fig S2D), compared to control cells encoding cdiB and the N‐terminal part of cdiA (no toxin and immunity). This suggests that the copy number of the genes does not affect the frequency of persisters in the population. Thus, our data show that CDI toxins with different activity confer significantly increased frequencies of persisters. To further confirm that the observed increase in persisters was due to delivery of toxins between cells and not simply due to expression of the cdiBAI genes, the plasmid‐encoded cdiBAI genes with CT‐I from EC93, UPEC 536 or EC869 were transformed into cells expressing a non‐cognate BamA receptor protein from Salmonella typhimurium LT2 (bamA Sty). Previous studies have shown that delivery of CdiA toxins does not occur to cells expressing this non‐cognate BamASty receptor (Ruhe et al, 2013b, 2015, 2016), but to confirm that this strain truly was resistant to CdiA toxin delivery, we competed the MG1655 strain with bamA Sty against MG1655 expressing cdiBA‐CT‐I EC93 or cdiBA‐CT‐I UPEC536. The growth of MG1655 target cells with bamA Sty was not affected by co‐culturing with strains expressing CdiA toxins from EC93 or UPEC 536 (Appendix Fig S4C), to be compared to the 2‐log inhibition observed in bamA wild‐type MG1655 target cells (Appendix Fig S4B). Interestingly, cells with the non‐cognate receptor BamASty and the plasmid‐encoded cdiBAI genes with toxin and immunity from EC93, UPEC 536 or EC869 did not survive antibiotic exposure better than cells with empty vector (Fig 1E and Appendix Fig S2E for CIP and Fig EV2D and Appendix Fig S3D for CEF), suggesting that the CDI‐mediated increase in persisters depends on delivery of CdiA toxin and is not due to expression of the CdiBAI proteins per se.
Figure 1. Contact‐dependent growth inhibition systems increase antibiotic tolerance.
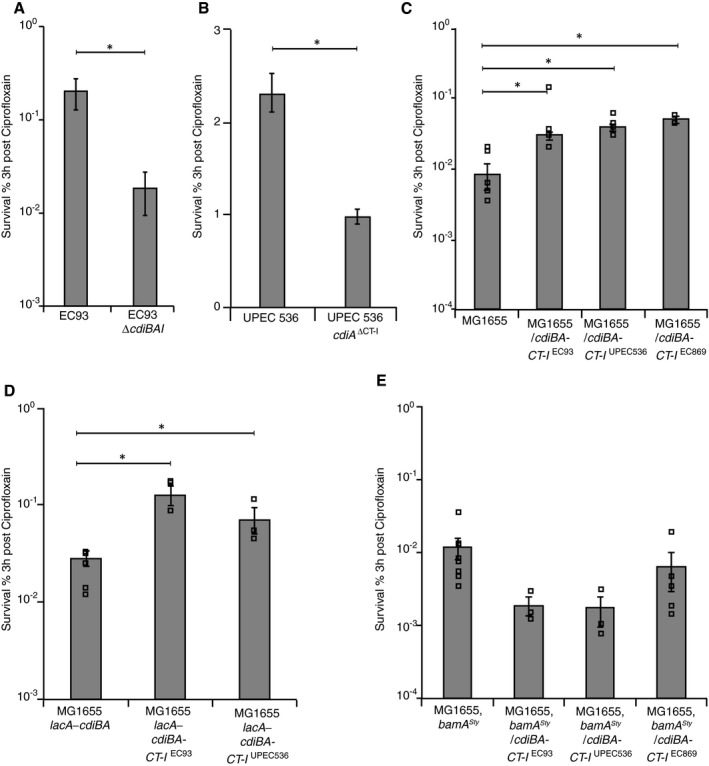
- EC93 cells with or without cdiBAI loci (n = 5).
- Uropathogenic E. coli 536 (UPEC 536) cells with or without CdiA C‐terminal toxin and immunity (cdiA ΔCT‐I) (n = 7).
- MG1655 cells with empty, cdiBA‐CT‐I EC93, cdiBA‐CT‐I UPEC536 or cdiBA‐CT‐I EC869 plasmids (n = 5, 4, 4, 3).
- MG1655 cells with chromosomally encoded cdiBA, cdiBA‐CT‐I EC93 or cdiBA‐CT‐I UPEC536 (n = 7, 4, 3).
- MG1655 bamA Sty cells with empty, cdiBA‐CT‐I EC93 , cdiBA‐CT‐I UPEC536 or cdiBA‐CT‐I EC869 plasmids (n = 8, 3, 3, 5).
Figure EV2. CDI systems increase tolerance to cefotaxime.
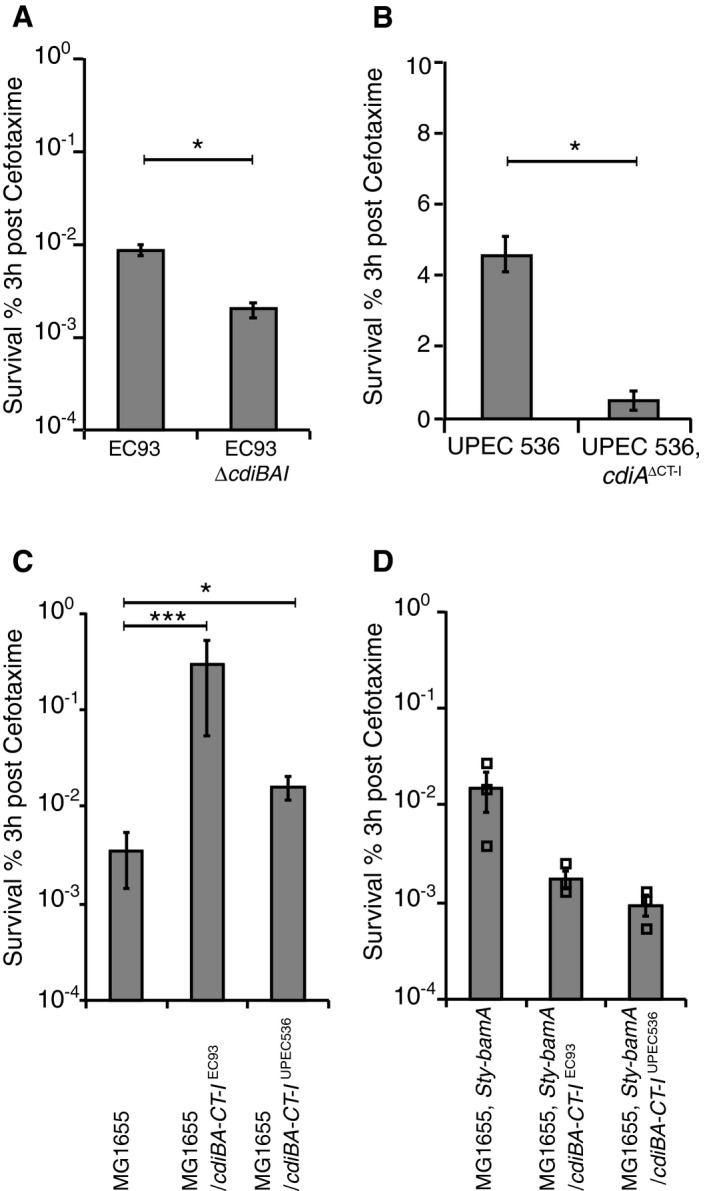
- EC93 cells with or without cdiBAI loci (n = 5).
- Uropathogenic E. coli 536 (UPEC 536) cells with or without CdiA C‐terminal toxin and immunity (cdiA ΔCT‐I) (n = 5).
- MG1655 cells with empty, cdiBA‐CT‐I EC93 or cdiBA‐CT‐I UPEC536 plasmids (n = 8).
- MG1655 bamA Sty cells with empty, cdiBA‐CT‐I EC93 or cdiBA‐CT‐I UPEC536 plasmids (n = 3).
Cells inhibited by CdiA toxins become persister cells
Cells with cdiBAI loci show increased fractions of persisters in the bacterial population, but whether it is CDI toxicity per se that entails antibiotic tolerance is not known. To test if cells inhibited by CDI toxins survive antibiotic exposure better than uninhibited cells, EC93 cells lacking CdiA‐CT and CdiI (cdiA ΔCT‐I, RIFR) were challenged by wild‐type EC93 cells [able to inhibit cells lacking CdiI (cdiA ΔCT‐I)] or EC93 cells lacking the CdiA‐CT toxin and immunity (cdiA ΔCT‐I) [unable to inhibit cells lacking CdiI (cdiA ΔCT‐I)]. After 15 min, the culture was treated with CIP, and the number of surviving target cells was monitored by plating on LB plates supplemented with rifampicin (RIF) to select for target cells in the mixed population (Fig 2A). Inhibited EC93 cells survived antibiotic exposure (CIP) ~100 times better than the uninhibited control (Fig 2B and C). The EC93 toxin is an ionophore that dissipates the proton motive force (Aoki et al, 2009) and the only CDI toxin with this activity described so far, whereas most studied CDI toxins are nucleases. To test if also nuclease toxins increase survival to antibiotics in cells inhibited by the toxin, we used the vector‐based systems described above (and shown in Fig EV1). Escherichia coli MG1655 cells expressing cdiBAI with CdiA‐CT‐IEC93 or CdiA‐CT‐IUPEC536 were added to otherwise isogenic E. coli MG1655 target cells without the cdiBAI locus, and thus cdiI. To differentiate the target cells from the inhibitors, the targets carry a chromosomal kanamycin resistance marker in setB that does not affect persister formation (Appendix Fig S5A and B). Target cells inhibited by either of the two CdiA toxins, CdiA‐CTEC93 that dissipates the proton motive force or CdiA‐CTUPEC536 that cleaves tRNA (Aoki et al, 2010), survived CIP and CEF exposure 1,000–10,000 times better than uninhibited target cells (Figs 2D, and EV3A and B). In contrast, target cells expressing the cognate immunity protein from a high‐copy vector failed to form more survivors when challenged by cells expressing the toxin (Figs 2D, and EV3A and B). Thus, these data suggest that growth inhibition per se, rather than toxin delivery and other potential effects that the delivered toxin may have in the cell, increases antibiotic tolerance. To verify that the inhibited cells were indeed persisters, the cells from Fig 2D were regrown and treated with CIP when they reached exponential phase. Regrown survivors behaved like untreated cells, confirming that the survivors in our experiments were indeed persisters, and ruling out mutations resulting in antibiotic resistance (Appendix Fig S6). To test if the copy number and thus expression level of cdiBAI affected delivery‐mediated persister formation in cells lacking cdiI, we used the strains where the entire CDI loci from the two vectors above was cloned in the MG1655 chromosome. Cells inhibited by chromosomally encoded CDI loci showed a 20‐ to 1,000‐fold increase in survival to CIP (Fig 2E) similar, although to lesser extent, to what was observed for the multi‐copy system. Thus, the copy number of CDI loci does seem to change CDI‐induced persistence in cells with no cdiI immunity, in contrast to what was observed in the cdiI‐positive populations (Fig 1C and D). An obvious difference between these two conditions is that in the cdiI‐negative cells, every toxin delivered can arrest growth of the cell. In contrast, only cells where the CdiA toxin molecules outnumber the CdiI molecules will arrest growth of the cdiI‐positive cells. As the fraction of persisters in cdiI‐positive populations does not increase with increased production of CdiA molecules, it must be the CdiI levels that are different between individual cells. Thus, it is possible that some cells in the cdiI‐positive populations are predisposed for persistence, with low CdiI levels, prior to CdiA toxin delivery, and that it is the number of such cells that limits the fraction of persisters that are formed by CDI under these conditions. The majority of previous studies on CDI have been performed with the vector‐based systems described above (e.g. Aoki et al, 2005, 2008, 2009, 2010; Diner et al, 2012; Ruhe et al, 2013b, 2015; Beck et al, 2016), which is the reason we decided to use these constructs for the remainder of the study.
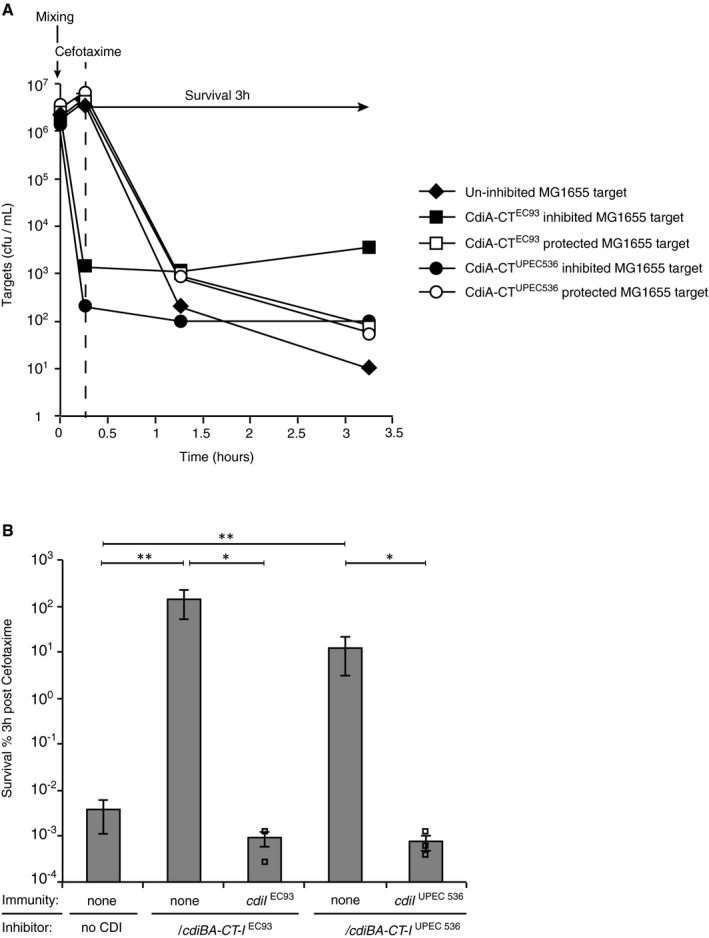
Figure 2. CdiA toxins induce antibiotic tolerance in growth‐inhibited cells.
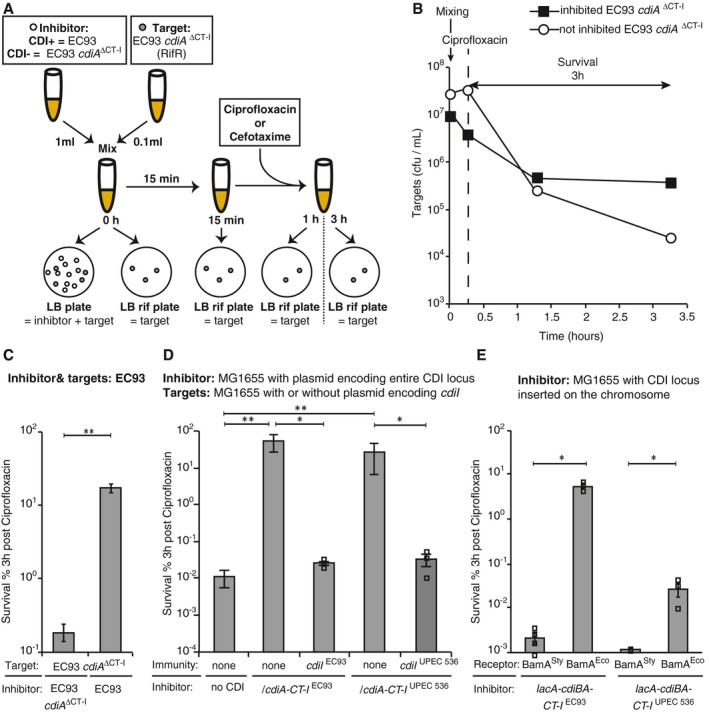
- Overview of experiment. EC93 inhibitor cells with or without CDI (EC93 cdiA ΔCT‐I) were mixed with target cells lacking cdiI (EC93 cdiA ΔCT‐I) at a 10:1 ratio for 15 min prior to addition of antibiotics (CIP or CEF). The number of viable cells was monitored over time through plating on LB plates (measuring both inhibitor and target cells) and LB rifampicin plates (measuring target cells only). In the figure, only target plates are shown at later time points due to space restriction, but plating on both plates was done at all time points to control the presence of inhibitors in the mix.
- A representative experiment (included in C) where cells lacking CdiI (EC93 cdiA ΔCT‐I) were co‐cultured with wild‐type EC93 cells (black squares) or with cdiA ΔCT‐I cells (white circles) cells for 15 min before treatment with CIP. Mixing is indicated by a vertical arrow and survival (plotted in C) by a horizontal arrow. Addition of CIP is indicated with a dashed line.
- Average survival of EC93 cdiA ΔCT‐I cells co‐cultured with wild‐type or cdiA ΔCT‐I EC93 cells, after 3 h of CIP treatment (n = 6).
- Average survival of MG1655 cells with or without immunity to the corresponding toxin (cdiI EC93 or cdiI UPEC536) co‐cultured with empty vector, plasmid‐encoded cdiBA‐CT‐I EC93‐ or cdiBA‐CT‐I UPEC536‐positive inhibitor cells, after 3 h of CIP treatment. (n = 10 for empty vector and cdiBA‐CT‐I EC93, n = 8 for cdiBA‐CT‐I UPEC536 and n = 3 for immunity complemented targets).
- Average survival of wild‐type or bamA Sty MG1655 cells co‐cultured with chromosomally encoded cdiBA‐CT‐I EC93‐ or cdiBA‐CT‐I UPEC536‐positive inhibitor cells, after 3 h of CIP treatment (n = 4 for cdiBA‐CT‐I EC93 and n = 3 for cdiBA‐CT‐I UPEC536).
Figure EV3. CdiA toxins induce cefotaxime tolerance in growth‐inhibited cells.
- A representative experiment (included in B) where MG1655 cells with (white symbols) or without (black symbols) cognate cdiI were co‐cultured with empty vector (diamonds), plasmid‐encoded cdiBA‐CT‐I EC93 (squares) or with plasmid‐encoded cdiBA‐CT‐I EC93 (circles) cells for 15 min before treatment with CEF. Mixing is indicated by a vertical arrow and survival (plotted in B) by a horizontal arrow. Addition of CEF is indicated with a dashed line.
- Average survival of MG1655 cells with or without immunity to the corresponding toxin (cdiI EC93 or cdiI UPEC536) co‐cultured with empty vector, plasmid‐encoded cdiBA‐CT‐I EC93‐ or cdiBA‐CT‐I UPEC536‐positive inhibitor cells, after 3 h of CIP treatment (n = 5 for empty vector, cdiBA‐CT‐I EC93 and cdiBA‐CT‐I UPEC536, n = 3 for immunity complemented targets).
Growing and persister cells are targeted similarly by contact‐dependent growth inhibition
A possible caveat in the experiments described above lies in the fact that CDI might target either only growing cells, or both growing and persister cells. This distinction is critical to correctly assess the survival of the inhibited population (Fig 2B), because exclusive targeting of growing cells would leave pre‐existing persisters unaffected. To test if CDI targets growing and persister cells alike, cell growth was transiently arrested by treatment with serine hydroxamate (SHX, a serine analogue that inhibits serine‐tRNA synthetase), thus mimicking amino acid starvation and inducing stringent response (Tosa & Pizer, 1971) before addition of inhibitor cells expressing CDI (for competitions), or only antibiotics (for persister assay) (Fig 3A). Clearly, CdiA‐expressing cells inhibited SHX‐treated and untreated target cells to the same extent (2 orders of magnitude within 3 h; Fig 3B, compare solid and striped bars). The SHX‐treated cells displayed complete tolerance against CEF, showing that they represent bona fide persisters (Fig 3C). Taken together, these results suggest that CDI does not discriminate between growing and non‐growing cells, confirming that the estimate of persisters in Fig 2 is correct.
Figure 3. CdiA toxins affect antibiotic‐tolerant and growing cells alike.
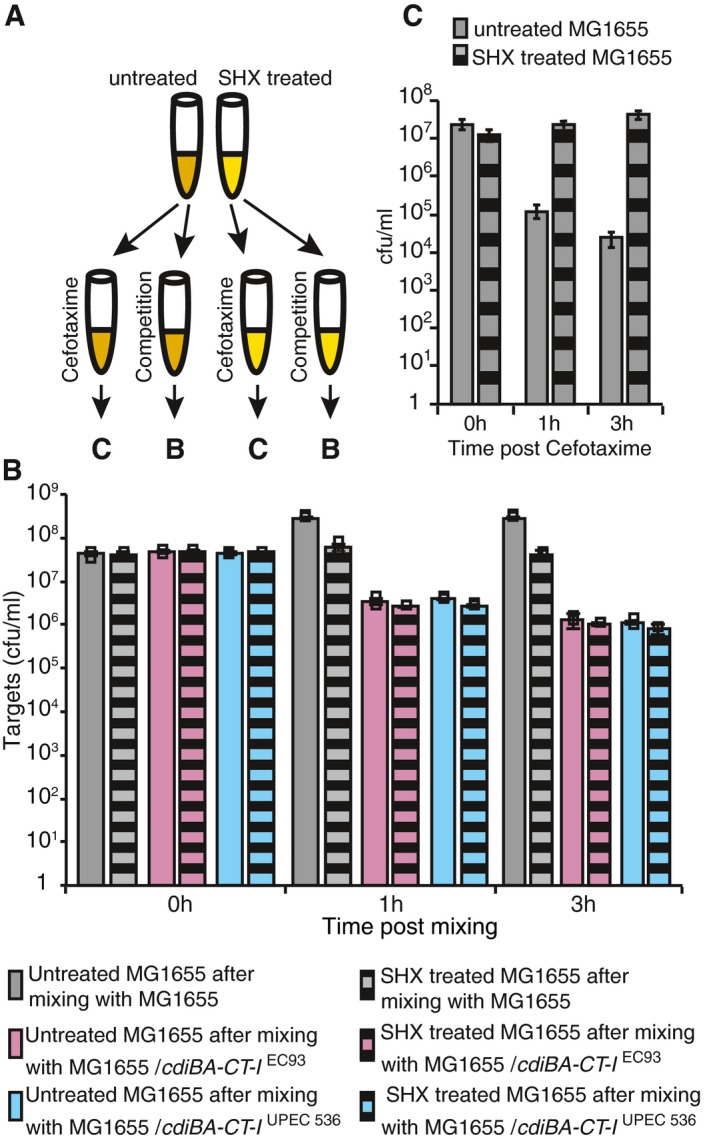
- Overview of the experiment. Cells grown to exponential phase are split and are either untreated (solid bars) or SHX‐treated (striped bars) for 15 min. After treatment, cells are split again and tested in competitions (B) or for antibiotic tolerance (C).
- Average survival of untreated (solid bars) or SHX‐treated (striped bars) MG1655 target cells after co‐culturing with empty vector (grey bars), plasmid‐encoded cdiBA‐CT‐I EC93 (pink bars)‐ or cdiBA‐CT‐I UPEC536 (blue bars)‐positive inhibitor cells. Bars display surviving cfu/ml (n = 3).
- Average survival of untreated (grey bars) or SHX‐treated (striped bars) MG1655 cells after 0, 1 and 3 h of CEF treatment (n = 9 and 5 respectively).
CdiI immunity protein is degraded upon stringent response
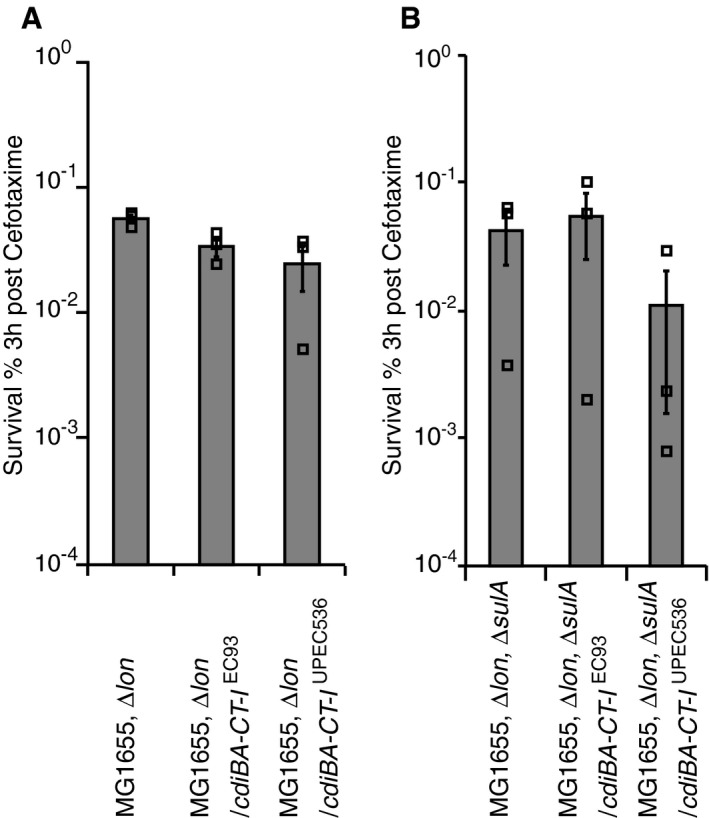
In cells encoding a CDI system, the CdiI immunity protein binds tightly to its cognate toxin to protect from auto‐inhibition (Aoki et al, 2010). So how could the presence of a CDI system infer toxicity to cells with immunity protein to increase persister frequencies? We hypothesized that the CdiA toxins increase the frequency of persisters in cells with CdiI because Lon degrades the immunity protein, as has been observed for antitoxins of several TA systems (Tsuchimoto et al, 1992; Van Melderen et al, 1994; Smith & Rawlings, 1998; Christensen et al, 2003, 2004), and asked if this in turn depends on (p)ppGpp production by RelA/SpoT and activation of the Lon protease via Ppk (Appendix Fig S1A and B; Maisonneuve et al, 2013). Plasmids with or without cdi‐loci were transformed into strains lacking the two (p)ppGpp synthases, ∆relA, ∆spoT, or the protease ∆lon, and the resulting strains were tested for tolerance to antibiotics. Cells carrying plasmids with cdi‐loci (cdiBA‐CT‐I EC93 or cdiBA‐CT‐I UPEC536), but deleted for ∆relA, ∆spoT, or lon, did not survive CIP (Fig 4A and B, Appendix Fig S7A and B) treatment better than those carrying the empty vector. Lon protease also degrades the major cell‐division inhibitor protein SulA, which is induced by antibiotics that target DNA (e.g. CIP). Thus, SulA accumulation in the absence of Lon could potentially affect the outcome of the experiment. However, cells carrying plasmids with cdi‐loci (cdiBA‐CT‐I EC93 or cdiBA‐CT‐I UPEC536), but deleted for lon did not survive exposure to antibiotics that target cell wall biosynthesis (CEF) better than those carrying the empty vector (Fig EV4A and Appendix Fig S8A). In addition, the assay was repeated in cells lacking sulA (∆lon, ∆sulA). Similar to the lon mutants, double deletion cells with cdi‐loci did not survive CIP (Fig 4C and Appendix Fig S7C) or CEF (Fig EV4B and Appendix Fig S8B) treatment better than the empty vector strain. To validate that Lon indeed was involved in the degradation of CdiI immunity proteins, the in vivo decay of a C‐terminally HA‐tagged CdiI immunity protein was monitored in exponentially growing cells. Lon protease was activated by SHX treatment for 1 h, to trigger the stringent response. The starvation protocol resulted in degradation of the CdiI immunity proteins in the wild type, but not in the protease‐deficient strain (Fig 4D), thus suggesting that Lon can degrade CdiI upon induction of the stringent response (Appendix Fig S1B).
Figure 4. CdiI immunity is degraded by the Lon protease.

-
A–C(A) ΔrelA, ΔspoT, (B) Δlon, (C) Δ lon, Δ sulA cells after 3 h of CIP treatment (n = 3 for Δ relA, Δ spoT, 4 for Δ lon and 3 for Δ lon, Δ sulA). Scales are logarithmic.
-
DImmunoblot analysis of UPEC 536 CdiI‐HA protein (14.8 kDa) stability in the presence and absence of Lon protease before and after SHX treatment for 1 h. The lower panel shows the corresponding Coomassie‐stained SDS–PAGE gel as a volume loading control.
Figure EV4. cdi‐loci does not increase survival to cefotaxime in Δlon or ΔlonΔsulA cells.
-
A, BAverage survival of exponentially growing Escherichia coli MG1655 cells with empty vector (black bars), plasmid‐encoded cdiBA‐CT‐I EC93 (white bars) or plasmid‐encoded cdiBA‐CT‐I UPEC 536 (grey bars) after 3 h of CEF treatment. (A) Δlon or (B) ΔlonΔsulA cells (n = 3). Error bars represent s.e.m. and n‐values indicate biological replicates. Scales are logarithmic.
Source data are available online for this figure.
CdiA toxins induce the stringent response
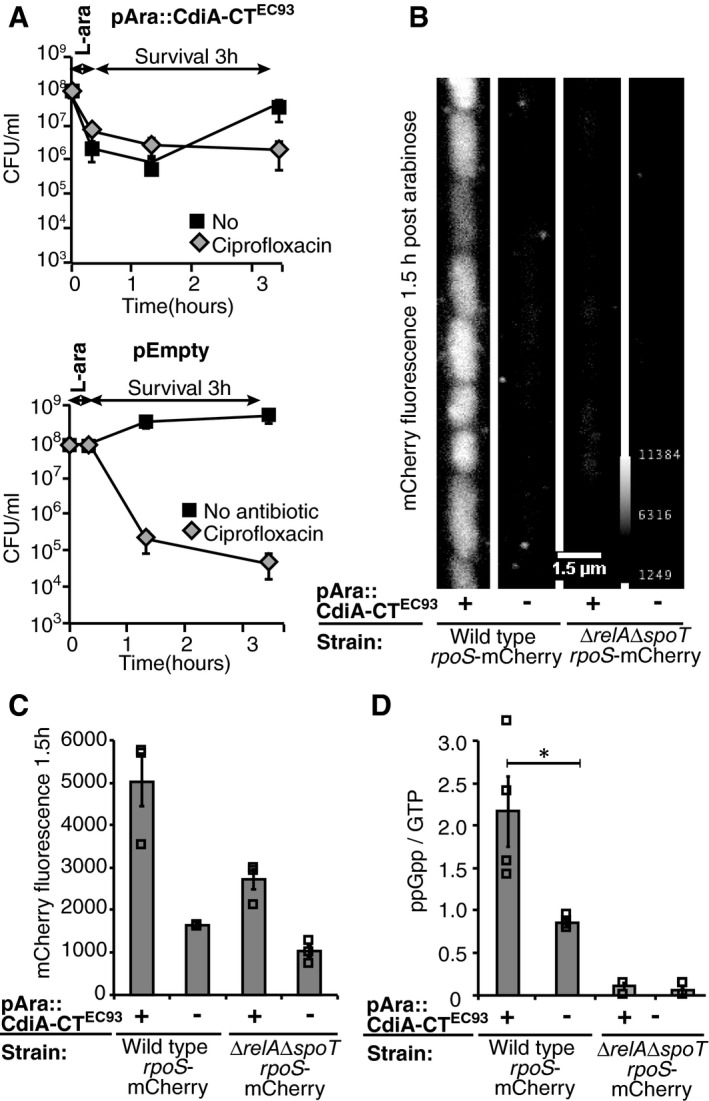
Similarly to type II TA modules, the CdiI immunity protein seems to be degraded in cells with increased levels of (p)ppGpp. To investigate if CdiA toxins themselves induce the stringent response as has been observed for some type II TA toxins (Germain et al, 2013), the C‐terminal toxin of CdiAEC93 was cloned on plasmid and expressed from an arabinose‐inducible promoter in a strain where the (p)ppGpp‐regulated protein RpoS was fused to mCherry (Maisonneuve et al, 2013). The alarmone (p)ppGpp has been shown to promote RpoS stability by prevention of protein degradation and is also required for maintaining basal level rpoS expression (Hirsch & Elliott, 2002; Bougdour & Gottesman, 2007). To verify that this new construct actually provided toxicity and transient growth arrest as observed with delivered toxins above, the cells were tested for antibiotic tolerance. Exponentially growing cells with the toxin plasmid (pAra‐CdiA‐CTEC93) or empty vector were induced with arabinose for 15 min after which the inducer was removed and the cells were resuspended in fresh media supplemented with glucose to repress further expression of the toxin. Viability was monitored in the presence or absence of CIP through plating and colony counting (Fig 5A). Intracellular over‐expression of the CdiA‐CTEC93 resulted in ~10% survival after antibiotic exposure (Figs 5A and 7C). However, a large fraction (90%) of cells overexpressing CdiA‐CTEC93 did not resume growth after toxin induction was terminated (Fig 5A), suggesting irreversible damage to the cells. A large fraction of cdiI‐negative cells targeted by CdiA toxins also never resume growth (drop in cfu/ml at mixing in Figs 1B and EV3A). In both of these set‐ups, the cells experiencing the toxic effect of CdiA lack the cdiI gene and are therefore unable to relieve the toxicity by producing more CdiI. Thus, to resume growth these cells must degrade the CdiA toxins produced/delivered and it is possible that the cells unable to resume growth were not able to degrade all CdiA toxins.
Figure 5. CdiA toxins induce the stringent response.
-
AAverage cfu/ml of MG1655 cells with a chromosomal RpoS‐mCherry fusion and with pAra::CdiA‐CTEC93 (upper graph) or empty vector (lower graph) after 15 min of l‐arabinose induction followed by washing and either no (black squares) or CIP (grey diamonds) treatment (n = 3 and 5 for CIP and no antibiotic series, respectively).
-
B, CCells from A were loaded in a microfluidics device after the 15‐min L‐ara induction and mCherry fluorescence was measured using fluorescent microscopy after 1.5 h. (B) A representative image of the wild‐type or ΔrelAΔspoT cells with a chromosomal RpoS‐mCherry fusion grown with empty or CdiA‐CTEC93 vector. Scale bar is 1.5 μm. (C) Average mCherry fluorescence of the wild‐type or ΔrelAΔspoT cells with a chromosomal RpoS‐mCherry fusion grown with empty or CdiA‐CTEC93 vector (n = 3).
-
DAverage ratio of ppGpp/GTP in wild‐type or ΔrelAΔspoT cells with empty or CdiA‐CTEC93 plasmid after l‐arabinose induction (n = 4 and 3 for WT and ΔrelAΔspoT strains, respectively).
To facilitate screening of many individual cells (100 cells/sample), mCherry fluorescence was visualized in individual cells using a microfluidics device (representative image in Fig 5B). Quantification of the fluorescent signal showed that cells with empty vector (wild type or ∆relA∆spoT) had a background fluorescence of about 1,500 units mCherry fluorescence already at the beginning of the experiment (Appendix Table S1). Cells expressing CdiA‐CTEC93 showed a 3,500‐unit increase in mCherry fluorescence 1.5 h after arabinose addition, whereas the empty vector control remained at 1,500 units mCherry fluorescence (Fig 5C). To verify that the observed increase in RpoS levels was dependent on activation of the stringent response, the experiment was repeated in a ∆relA, ∆spoT strain, that is, lacking both (p)ppGpp synthases. In cells unable to produce (p)ppGpp, only a small increase of 1,000 units mCherry fluorescence could be observed 1.5 h after arabinose induction in the toxin‐expressing strain, suggesting that most of the increase observed in wild‐type cells was through (p)ppGpp. In line with this, cells expressing the CdiAEC93 toxin from an arabinose‐inducible promoter showed a 3.5‐fold increase in ppGpp levels as compared to cells with an empty vector (done by thin‐layer chromatography; Fig 5D and Appendix Fig S9).
Even though our persister experiment suggested that over‐expression of the C‐terminal toxin inside of cells could have similar outcome as toxin delivery, the large number of toxins produced could have additional effect on the cell. To test if also delivered toxins induce the stringent response in targeted cells, we used flow cytometry. To be able to separate targeted cells (lacking CdiI) from delivering cells (with the plasmid‐encoded cdiBA‐CT‐I EC93), we constructed reporter strain with either native BamA or BamASty that constitutively expresses RFP from the chromosome (galK::RFP‐cat). These strains were transformed with a reporter plasmid where the PosmY RpoS‐regulated promoter (Yim et al, 1994) was fused to BFP (Appendix Fig S10). These target reporter cells were mixed with delivering cells expressing cdiBA‐CT‐I EC93, and BFP fluorescence was observed in the RFP+ population after 1 h (Fig 6A). Interestingly, ~3% of the reporter cells with cognate E. coli BamA showed BFP fluorescence after 1 h of co‐incubation with CDI− positive cells. In contrast, < 0.1% of the reporter cells with non‐cognate Salmonella BamA (BamASty) were BFP+ (Fig 6B). In addition, also reporter cells with BamA from either species mixed with CDI‐negative cells also showed <0.1% BFP+ events (Fig 6A and B). To compare the number of RpoS‐activated cells with survival to antibiotics, we treated the cells as described above and added CIP to the mix. A similar sized fraction, ~3%, of the reporter cells expressing cognate BamAEco survived 1 h of CIP treatment, whereas only 0.01% survival was observed in the non‐cognate BamASty reporter and control strains (Fig 6C). Taken together, our results show that CdiA‐CTEC93 increases (p)ppGpp levels in cells experiencing toxicity, suggesting that cell‐to‐cell variations in (p)ppGpp levels could also be due to contact‐dependent toxins and not only due to intrinsic stochastic events as suggested previously (Maisonneuve et al, 2013). Thus, delivery of CDI toxins can contribute to the induction of the stringent response, which in turn entails degradation of CdiI immunity protein. These data suggest a feedforward cycle where amplification of a signal can result in growth arrest in an all‐or‐none manner.
Figure 6. Delivery of CdiA‐CTEC 93 induces stringent response in receiving cells.
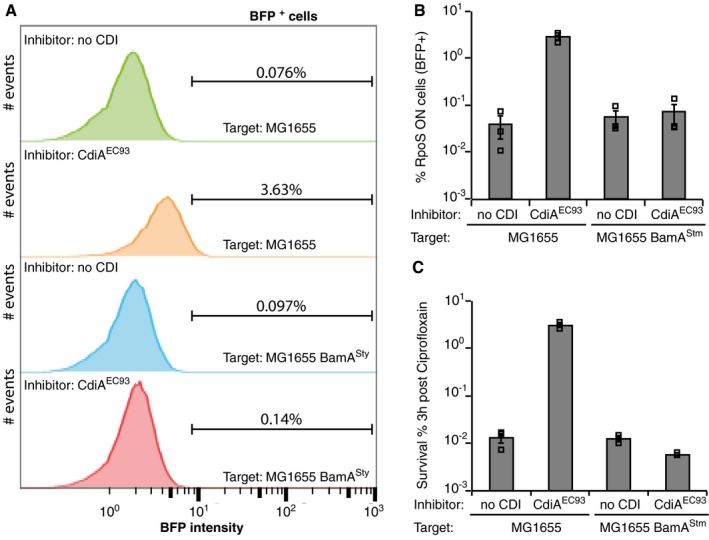
- A representative image of flow cytometry data from the experiment analysed in FlowJo. Inhibitors in each experiment are indicated in the top left corner and targets in the right bottom corner. Gating for BFP is indicated with a line, and the % of BFP+ events are shown above the line.
- Average BFP+ cells in the RFP+ population (n = 3).
- Average survival of the RFP+ target population (CAMR) after 3 h of CIP treatment (n = 3).
CdiA toxins induce growth arrest by two distinct pathways
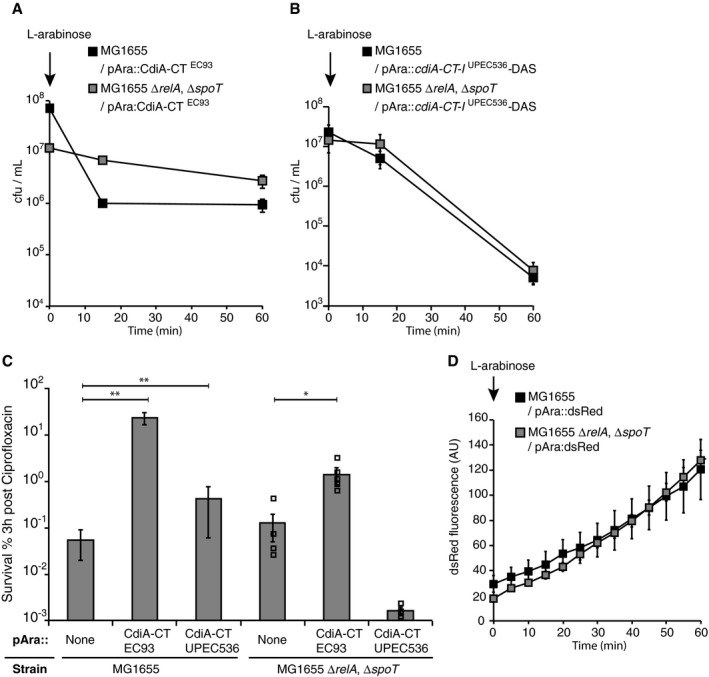
Induction of the stringent response results in decelerated growth of the affected cell. If the toxic activity of CdiA increases cellular (p)ppGpp levels, it is possible that the observed growth arrest is mediated by the stringent response. However, the toxic effects of the CdiA toxins alone, dissipating the proton motive force (CdiAEC93; Aoki et al, 2009), and degrading tRNAs (CdiAUPEC536) (Aoki et al, 2010; Diner et al, 2012), should be able to arrest growth by depleting ATP levels and arresting translation, respectively. To investigate if cells unable to induce stringent response responded similar to the CdiA toxins, we used the above‐described construct for over‐expression of CdiA‐CTEC93 and a previously described construct for over‐expression of CdiA‐CTUPEC536 (pCH450::cdiA‐CT‐I UPEC536‐DAS; Diner et al, 2012) from arabinose‐inducible promoters. Cloning of the C‐terminal toxin from UPEC 536 (and many other CdiA‐CTs) alone results in immediate toxicity and growth arrest of the expressing cell and is therefore not possible. Instead, a degradation tag is attached to the CdiI immunity protein, resulting in fast degradation of CdiI upon induction of expression, entailing growth arrest. Cells with CdiA‐CTEC93 or CdiA‐CTUPEC536 plasmids were induced with arabinose for 15 min in cells able (wild type) or unable (∆relA, ∆spoT) to induce stringent response. The growth of cells lacking relA and spoT was not arrested as rapidly as in wild‐type cells upon expression of CdiA toxins (Fig 7A and B). As a consequence, these cells did not survive antibiotic treatment to the same extent as wild‐type cells with toxin (Fig 7C). To control that ∆relA, ∆spoT cells express similar amount of protein upon arabinose induction as wild‐type cells, a plasmid carrying the dsRed protein under an arabinose‐inducible promoter (Helaine et al, 2010) was used. ∆relA, ∆spoT and wild‐type cells produced dsRed fluorescent protein similarly upon arabinose induction (Fig 7D). Thus, it is likely that CdiA toxins stop the growth of targeted cells through inducing stringent response in addition to their toxic activity. Taken together, CdiA toxins can mediate growth arrest even in cells unable to induce the stringent response when expressed at very high levels. However, in populations of cells with CDI loci, where the toxin molecules have to outnumber the CdiI immunity molecules, the ability to induce stringent response is absolutely essential for increasing the non‐growing fraction of cells through a Lon‐mediated feedforward mechanism of growth arrest (Fig 4A).
Figure 7. CdiA toxins require stringent response to mediate growth arrest and antibiotic tolerance.
-
A, BAverage cfu/ml of MG1655 wild‐type or ΔrelAΔspoT cells with (A) pAra::CdiA‐CTEC93 (n = 3 and 5 for WT and ΔrelAΔspoT, respectively) or (B) pAra::CdiA‐CT‐IUPEC536‐DAS plasmid after 15 min of l‐arabinose treatment followed by washing and resuspension in LB (n = 3).
-
CAverage survival of the MG1655 wild type or ΔrelAΔspoT with empty, pAra::CdiA‐CTEC93 or pAra::CdiA‐CT‐IUPEC536‐DAS plasmid after 3 h of CIP treatment. (n = 9, 6, 5, 4, 5 and 3).
-
DAverage dsRed fluorescence in MG1655 wild‐type (black squares) or ΔrelAΔspoT (grey squares) cells with pAra::mCherry plasmid after 15 min of l‐arabinose treatment followed by washing and resuspension in LB (n = 4).
Discussion
In this paper, we show that CDI can contribute to the generation of persisters in bacterial populations. Since its discovery, CDI has been considered an advanced competition machinery used in antagonistic bacterial interactions. However, there are two features of CDI that are puzzling: (i) why is delivery of toxin limited to cells of the same species, when the ability to inhibit the growth of others would provide an even greater advantage, and (ii) what is the purpose of delivering CDI toxins between immune cells? The evolutionary benefit of creating phenotypic diversity in a clonal bacterial population could be one of the explanations to why a system that specifically intoxicates cells of the same genotype would evolve.
A remaining question concerns why such a mechanism should be contact‐dependent and require external delivery, that is why is it not sufficient that the toxin is produced from inside the cell as with conventional TA systems? A possible explanation is that, as a bet‐hedging strategy, it would be wasteful to create many persisters when the population density is low, since sacrificing the growth of many cells delays the expansion of the population. On the other hand, it is likely beneficial to form a higher fraction of persisters in dense populations where there are many cell‐to‐cell contacts, since there are sufficiently many cells that can carry population expansion forward even with a significant non‐growing fraction. In support of this hypothesis, CDI‐expressing cells do not exhibit increased persister frequencies at low cell densities (107 cfu/ml; Fig 8A and B). Furthermore, bacteria in dense populations such as biofilms or in stationary phase display increased tolerance to antibiotics compared to exponentially growing planktonic cells (Spoering & Lewis, 2001; Keren et al, 2004a; Maisonneuve et al, 2013; Gutierrez et al, 2017). In addition, repeated exposure to antibiotics rapidly select for mutations that increase the fraction of persisters in stationary phase cultures (Van den Bergh et al, 2016), suggesting that increasing the fraction of non‐growing cells at high cell densities is a good strategy for survival. However, in biofilms and in stationary phase, nutrient access is limited, making it difficult to distinguish whether it is population density per se or nutrient availability that affects persister frequency under these conditions. In our experiments, both high‐ and low‐density cells are in exponential phase and treated otherwise identically, allowing us to show that population density per se affects CDI‐mediated persister formation.
Figure 8. Population density‐dependent persister formation.

-
A, BAverage cfu/ml of exponentially growing MG1655 cells with empty (black bars), cdiBA‐CT‐I EC93 (white bars) and cdiBA‐CT‐I UPEC536 (grey bars) plasmids after treatment with CIP for 3 h. Cells at (A) low (˜107) or (B) high (˜108) confluence were taken from the same exponentially growing culture, centrifuged and resuspended in PBS with CIP (n = 5). Viable cfu/ml at 0, 1 and 3 h after centrifugation are shown. Error bars represent s.e.m. and n‐values indicate biological replicates. Statistical significance was determined using Mann‐Whitney U‐test. Scales are logarithmic. *P < 0.05, **P < 0.01.
Source data are available online for this figure.
Bacteria could also regulate growth in response to increasing population density through other social interactions, for example, quorum sensing. Indeed, Pseudomonas aeruginosa, Streptococcus mutans and E. coli form increased frequencies of persisters in response to quorum sensing signals (acyl‐homoserine‐lactone (AHL), stress‐inducible pheromone peptide (CSP) and indole, respectively) (Moker et al, 2010; Leung & Levesque, 2012; Vega et al, 2012). Somewhat surprising, one of these molecules, indole, also promotes persister formation in S. typhimurium, a bacterium that does not produce indole itself, suggesting that density‐dependent persister formation through indole allows determination of cell density per se rather than functioning as a bet‐hedging strategy. Clearly, several mechanisms are in place to increase the fraction of persisters in the population as a response to increasing population densities, supporting the notion that it is more beneficial to create non‐growing cells when there are many cells of the same genotype.
Persisters form also in unstressed exponentially growing populations, although at lower frequencies than at high cell density or during stress. Two different models suggest that stochastic variation in the levels of ATP or (p)ppGpp in individual cells results in a subpopulation of cells that reaches ATP or (p)ppGpp concentrations that promote growth arrest (Maisonneuve et al, 2013; Shan et al, 2017). However, the mechanism causing variation in ATP or (p)ppGpp levels in individual cells is unknown. Our results demonstrate that CDI toxins can cause variations in (p)ppGpp levels between individual cells through cell‐to‐cell contacts. In addition, the CdiA‐CTEC93 is an ionophore toxin, which creates pores in the inner membrane of Gram‐negative bacteria, dissipating the proton motive force and thus depleting ATP levels in the targeted cells (Aoki et al, 2009). Thus, at least one of the CdiA toxins should change ATP levels in the cells that sense the toxic effect, suggesting that CDI can cause variation in ATP levels between individual cells. In conclusion, our results suggest that when an exponentially growing population of isogenic cells with CDI systems reaches high cell density, random cell‐to‐cell interactions create subpopulations of cells in which the toxin molecules outnumber the immunity molecules. In these cells, the toxic effect of the CdiA toxin is sensed, resulting in initiation of the stringent response and a feedforward cycle where Lon degrades the remaining CdiI protein, eventually promoting growth arrest.
In addition to antagonistic interactions, CDI was recently suggested to promote biofilm formation and other community‐associated behaviours in Burkholderia thailandensis through contact‐dependent signalling (Garcia et al, 2016). Moreover, P. aeruginosa cells lacking CDI systems show differential gene expression (swarming and cyanide production) and altered virulence when compared to CDI‐positive cells (Melvin et al, 2017). In these studies, the delivery of a CdiA toxin between CDI immune cells was associated with altered gene expression, but how this would mechanistically be achieved remains to be answered. Based on our findings, it is likely that CdiA toxin delivery to a subpopulation of cells where the CDI immunity protein is degraded would alter gene expression in the affected cell, creating population heterogeneity in terms of gene expression, rather than a homogenous change in all cells. If so, the changes in gene expression observed in these studies (Garcia et al, 2016; Melvin et al, 2017) would be an average of the population and greatly underestimate the changes in gene expression in individual cells. Though the CdiA toxin‐immunity pair in B. thailandensis and P. aeruginosa may regulate gene expression through a different mechanism, the notion that CDI could cause heterogeneity by changing gene expression in bacterial populations is intriguing and should be investigated further.
Though first discovered in E. coli, CDI systems have been found in most bacteria (Aoki et al, 2010; Poole et al, 2011; Koskiniemi et al, 2013, 2014, 2015; Beck et al, 2014; Mercy et al, 2016). Even so, new classes of CDI toxins like those encoded by the maf‐genes in Neisseria gonorrhea (Jamet et al, 2015) are still being discovered, suggesting CDI systems to be even more widespread than we know. Finally, other classes of bacteriostatic toxins, like some colicins (Sakai et al, 2015) and Type VI secretion effectors (Whitney et al, 2015), could also in principal contribute to inter‐bacterial induction of persister formation at high cell densities. Thus, cell‐to‐cell contact‐mediated delivery of bacterial toxins could be a common bet‐hedging mechanism used for creating population density‐dependent heterogeneity.
Materials and Methods
All experiments were performed semi‐blinded, using a number instead of the genotype as indicator of the strains included in each experiment. For all main experiments, at least three biological replicates were used to ensure reproducibility. No samples were excluded from the analysis.
Strains and growth conditions
The bacterial strains used in this study were derived from E. coli MG1655 (Appendix Table S2). Cells were grown in Luria‐Bertani broth (LB) and incubated at 37°C/200 rpm shaking unless stated otherwise. When applicable, antibiotics were added to the growth media as follows: ampicillin (AMP) 100 mg/l, chloramphenicol (CAM) 12.5 mg/l and kanamycin (KAN) 50 mg/l, ciprofloxacin (CIP) 0.1 mg/l (10× MIC) and cefotaxime (CEF) 10 mg/l (MG1655 and UPEC 536 strains) or 40 mg/l (EC93 strain) (10× MIC for respective strains).
Construction of plasmids and chromosomal constructs
Gene deletions and chromosomal constructs were made by Lambda red recombination as described previously (Datsenko & Wanner, 2000) or retrieved from the Keio collection (Baba et al, 2006). Plasmids were constructed with conventional restriction digest, overlapping extension PCR or through Gibson assembly (New England Biolabs, USA). All mutations were moved to clean background after construction. Markers were moved between strains using P1 transduction, and moved constructs were verified using PCR with primers that annealed outside of the locus (Appendix Table S3). All constructs used in this study were verified by sequencing. Please check the supplemental material for detailed description of the constructed plasmids and chromosomal constructs used in this study.
Antibiotic tolerance assays
The cells were grown overnight in LB supplemented with appropriate antibiotics. Cells were diluted 1:100 in LB and grown until OD600 ~ 0.3; 1 ml of cell culture was harvested by centrifugation (6,000 × g for 3 min) and the supernatant removed before resuspending cells in 1 ml of 1× PBS. After resuspension, the number of viable target cells was determined by plating on LB plates. CEF or CIP was added to the cells, followed by incubation at 37°C/200 rpm shaking. At 1 and 3 h, the number of viable colony‐forming units was determined by plating. Bacterial survival in the population was calculated as the ratio of viable cells at 1 h or 3 h compared to the number of cells at 0 h. Statistical significance was determined using Mann–Whitney U‐test, which is suitable for comparing data with small sample size of unknown distribution.
Antibiotic tolerance after co‐culturing with cells expressing CdiA toxins
Cells were grown to OD600 ~ 0.3 as mentioned above. Inhibitor and target cells were mixed 10:1, and the viable target cell counts were obtained by plating on LB plates containing the appropriate antibiotics to separate target cells from inhibitors. Cells were mixed for 15 min at 37°C/200 rpm shaking, and 1 ml was then harvested by centrifugation (3,300 × g for 3 min) and subjected to the antibiotic tolerance assay as described before with the difference that viable target cell counts were obtained by plating on LB plates containing the appropriate antibiotics to separate target cells from inhibitors. Bacterial survival in these populations was calculated as the ratio of viable cells at 1 and 3 h compared to the number of cells after 15 min of co‐culturing with inhibitor cells.
Antibiotic‐tolerant cells in competitions with cells expressing CdiA toxins
Bacteria were grown to an OD600 ~ 0.3, and 1 ml of target cells was harvested by centrifugation (3,300 × g, 3 min) in an Eppendorf tube. Cells were resuspended in 1 ml LB and were either treated or not treated with 1 g/l SHX for 15 min at 37°C/200 rpm shaking. At this point, the cultures were split and were either treated with CEF or mixed 1:10 with inhibitor cells grown to an OD600 of ~0.3. The number of viable colony‐forming units was determined as above.
Antibiotic tolerance after expression of CdiA‐CTs from plasmids
For induction of toxin from the arabinose‐inducible promoter, spent LB was used as LB contains residual sugar from yeast extract, which we found represses arabinose‐inducible promoters. Spent LB was obtained from E. coli MG1655 cells grown to OD600 ~ 0.5 in LB by centrifugation (to remove cells) and filtering through 0.2‐μm filters (for sterilization). For over‐expression of CdiA‐CTUPEC536, we used a previously published construct (Diner et al, 2012) in which the CdiI immunity protein was fused to a degradation tag (CdiA‐CT‐IUPEC536‐DAS). Upon arabinose induction, both CdiA‐CTUPEC536 and CdiIUPEC536 are produced, but CdiI will be degraded, resulting in growth arrest.
Cells encoding toxin under an arabinose‐inducible promoter were grown overnight in LB broth supplemented with 1% glucose and 100 mM KH2PO4/K2HPO4 to repress leaky expression of toxin and to maintain pH ~ 7.5, respectively. Cells were diluted 1:500 and grown to OD600 ~ 0.3 at 37°C/200 rpm shaking. For over‐expression of toxin, cells were resuspended in spent LB supplemented with 0.2% l‐arabinose. After 15 min at 37°C/200 rpm shaking, the cells were harvested again and resuspended in LB broth supplemented with 1% glucose and 100 mM KH2PO4/K2HPO4 (to repress further expression of toxin) before subjected to the standard antibiotic tolerance assay described above.
Measurement of in vivo ppGpp levels by thin‐layer chromatography (TLC)
Cells were grown to OD600 ~ 0.05 as described for CdiA‐CT expression from plasmid. Cells were labelled with 32P (orthophosphate (H3 32PO4), NEX053H005MC, PerkinElmer) to a 100 μCi/ml final concentration. After three to four generations of growth, at OD600 of 0.25–0.3, cells were centrifuged and resuspended in spent LB + 0.02% l‐arabinose. After 15 min, D‐glucose was added to 0.1% to terminate induction, and 0.5 ml of culture was harvested. Cells were resuspended in 1 ml 0.9% NaCl and washed by centrifugation three times. Pellets were resuspended in 200 μl 0.9% NaCl, and 200 μl of 20% formic acid was added to lyse the cells. Cell lysates were kept at −20°C. Cell debris was removed by centrifugation at 10,000 g for 5 min, and 20 μl of supernatant was loaded onto a TLC PEI Cellulose membrane (Merck, Germany). As a size marker, 0.2 μM of non‐radioactive ppGpp (TriLink Biotechnologies, San Diego, USA) was applied. Chromatography was performed in 1.5 M KH2PO4 (pH 3.0) (modified from Schneider et al, 2003). The unlabelled ppGpp marker was visualized under UV‐light. The membrane was dried, and labelled nucleotides were visualized on a PhosphorImager (Molecular Dynamics), quantified with ImageQuant software, version 4.2a (Molecular Dynamics). Ratios of ppGpp/GTP were calculated to normalize ppGpp content to the number of cells as described previously (Denapoli et al, 2013; Benoist et al, 2015).
Time‐lapse microscopy
To investigate induction of stringent response, cells carrying either the empty vector (pBAD33) or the CdiA‐CTEC93 under an arabinose‐inducible promoter (pSK008) were transferred into wild‐type MG1655 cells carrying rpoS fused to mCherry (Maisonneuve et al, 2013). Cells were grown to OD600 ~ 0.3 as described for CdiA‐CTEC93 expression from plasmid. At this point, cells were diluted 1:500 one more time and grown to OD600 ~ 0.3 to dilute out excess RpoS‐mCherry protein produced in stationary phase. To express CdiA‐CTEC93, the cells were resuspended in spent LB (see description above) supplemented with 0.2% l‐arabinose to induce expression from the arabinose‐inducible promoter for 15 min at 37°C/200 rpm shaking. Cells were diluted 1:50 in induction medium and loaded onto a PDMS‐glass microfluidic device constructed for live cell imaging (Baltekin et al, 2017). The cells were imaged in fluorescence (to detect cellular mCherry expression levels) and bright field channels (to locate the cells for data analysis) using a Nikon Ti‐E microscope with a Nikon Plan Apo Lambda 100× Oil immersion objective (NA 1.45), an Andor iXon3 897 EMCCD camera, and a stage incubator set to 37°C. Fluorescent microscopy employed a 561 nm DPSS‐laser (Coherent) at 445 W/cm2 in the sample plane and an exposure time of 100 ms. The dichroic mirror was zt561rdc (Chroma), and the emission filters HQ565LP (Chroma), 561NF (Chroma), and 561 nm Razor Edge Long Pass (Semrock). More than 100 cells per strain per replicate were randomly selected in bright field. Average cell fluorescence was collected from a 49 px2 (0.123 μm2) square region in the middle of the selected cell. Background fluorescence was measured from the cell‐free region between the cell traps. Background value times 0.7 was subtracted from the cell fluorescence value. The factor of 0.7 was used to account for the lower background fluorescence in the cell traps region compared to the region in between the traps. Data analysis is performed by custom developed algorithm in MATLAB.
Author contributions
SK conceived the study. AG, ÖB, MW, JE and SK designed research; AG, ÖB, MW, DE, DLH and SK performed research; AG, ÖB and SK analysed data; JE and SK wrote the paper.
Conflict of interest
The authors declare that they have no conflict of interest.
Supporting information
Appendix
Expanded View Figures PDF
Source Data for Expanded View and Appendix
Review Process File
Source Data for Figure 1
Source Data for Figure 2
Source Data for Figure 3
Source Data for Figure 4
Source Data for Figure 5
Source Data for Figure 6
Source Data for Figure 7
Source Data for Figure 8
Acknowledgements
This study was supported by grants from the Swedish Foundation of Strategic Research, the Swedish research council, and the Åke Wiberg and Wenner‐Gren foundations (to S.K) and European research council (to J.E.).
The EMBO Journal (2018) 37: e98026
References
- Ackermann M (2015) A functional perspective on phenotypic heterogeneity in microorganisms. Nat Rev Microbiol 13: 497–508 [DOI] [PubMed] [Google Scholar]
- Amato SM, Orman MA, Brynildsen MP (2013) Metabolic control of persister formation in Escherichia coli . Mol Cell 50: 475–487 [DOI] [PubMed] [Google Scholar]
- Amato SM, Brynildsen MP (2015) Persister heterogeneity arising from a single metabolic stress. Curr Biol 25: 2090–2098 [DOI] [PubMed] [Google Scholar]
- Aoki SK, Pamma R, Hernday AD, Bickham JE, Braaten BA, Low DA (2005) Contact‐dependent inhibition of growth in Escherichia coli . Science 309: 1245–1248 [DOI] [PubMed] [Google Scholar]
- Aoki SK, Malinverni JC, Jacoby K, Thomas B, Pamma R, Trinh BN, Remers S, Webb J, Braaten BA, Silhavy TJ, Low DA (2008) Contact‐dependent growth inhibition requires the essential outer membrane protein BamA (YaeT) as the receptor and the inner membrane transport protein AcrB. Mol Microbiol 70: 323–340 [DOI] [PMC free article] [PubMed] [Google Scholar]
- Aoki SK, Webb JS, Braaten BA, Low DA (2009) Contact‐dependent growth inhibition causes reversible metabolic downregulation in Escherichia coli . J Bacteriol 191: 1777–1786 [DOI] [PMC free article] [PubMed] [Google Scholar]
- Aoki SK, Diner EJ, de Roodenbeke CT, Burgess BR, Poole SJ, Braaten BA, Jones AM, Webb JS, Hayes CS, Cotter PA, Low DA (2010) A widespread family of polymorphic contact‐dependent toxin delivery systems in bacteria. Nature 468: 439–442 [DOI] [PMC free article] [PubMed] [Google Scholar]
- Baba T, Ara T, Hasegawa M, Takai Y, Okumura Y, Baba M, Datsenko KA, Tomita M, Wanner BL, Mori H (2006) Construction of Escherichia coli K‐12 in‐frame, single‐gene knockout mutants: the Keio collection. Mol Syst Biol 2: 2006.0008 [DOI] [PMC free article] [PubMed] [Google Scholar]
- Balaban NQ, Merrin J, Chait R, Kowalik L, Leibler S (2004) Bacterial persistence as a phenotypic switch. Science 305: 1622–1625 [DOI] [PubMed] [Google Scholar]
- Baltekin O, Boucharin A, Tano E, Andersson DI, Elf J (2017) Antibiotic susceptibility testing in less than 30 min using direct single‐cell imaging. Proc Natl Acad Sci USA 114: 9170–9175 [DOI] [PMC free article] [PubMed] [Google Scholar]
- Beck CM, Morse RP, Cunningham DA, Iniguez A, Low DA, Goulding CW, Hayes CS (2014) CdiA from Enterobacter cloacae delivers a toxic ribosomal RNase into target bacteria. Structure 22: 707–718 [DOI] [PMC free article] [PubMed] [Google Scholar]
- Beck CM, Willett JL, Cunningham DA, Kim JJ, Low DA, Hayes CS (2016) CdiA effectors from uropathogenic Escherichia coli use heterotrimeric osmoporins as receptors to recognize target bacteria. PLoS Pathog 12: e1005925 [DOI] [PMC free article] [PubMed] [Google Scholar]
- Benoist C, Guerin C, Noirot P, Dervyn E (2015) Constitutive stringent response restores viability of bacillus subtilis lacking structural maintenance of chromosome protein. PLoS One 10: e0142308 [DOI] [PMC free article] [PubMed] [Google Scholar]
- Bigger JW (1944) Treatment of staphylococcal infections with penicillin by intermittent sterilisation. Lancet 244: 497–500 [Google Scholar]
- Bougdour A, Gottesman S (2007) ppGpp regulation of RpoS degradation via anti‐adaptor protein IraP. Proc Natl Acad Sci USA 104: 12896–12901 [DOI] [PMC free article] [PubMed] [Google Scholar]
- Butler T (2011) Treatment of typhoid fever in the 21st century: promises and shortcomings. Clin Microbiol Infect 17: 959–963 [DOI] [PubMed] [Google Scholar]
- Christensen SK, Pedersen K, Hansen FG, Gerdes K (2003) Toxin‐antitoxin loci as stress‐response‐elements: ChpAK/MazF and ChpBK cleave translated RNAs and are counteracted by tmRNA. J Mol Biol 332: 809–819 [DOI] [PubMed] [Google Scholar]
- Christensen SK, Maenhaut‐Michel G, Mine N, Gottesman S, Gerdes K, Van Melderen L (2004) Overproduction of the Lon protease triggers inhibition of translation in Escherichia coli: involvement of the yefM‐yoeB toxin‐antitoxin system. Mol Microbiol 51: 1705–1717 [DOI] [PubMed] [Google Scholar]
- Conlon BP, Rowe SE, Gandt AB, Nuxoll AS, Donegan NP, Zalis EA, Clair G, Adkins JN, Cheung AL, Lewis K (2016) Persister formation in Staphylococcus aureus is associated with ATP depletion. Nat Microbiol 1: 16051 [DOI] [PubMed] [Google Scholar]
- Datsenko KA, Wanner BL (2000) One‐step inactivation of chromosomal genes in Escherichia coli K‐12 using PCR products. Proc Natl Acad Sci USA 97: 6640–6645 [DOI] [PMC free article] [PubMed] [Google Scholar]
- Denapoli J, Tehranchi AK, Wang JD (2013) Dose‐dependent reduction of replication elongation rate by (p)ppGpp in Escherichia coli and Bacillus subtilis . Mol Microbiol 88: 93–104 [DOI] [PMC free article] [PubMed] [Google Scholar]
- Diner EJ, Beck CM, Webb JS, Low DA, Hayes CS (2012) Identification of a target cell permissive factor required for contact‐dependent growth inhibition (CDI). Genes Dev 26: 515–525 [DOI] [PMC free article] [PubMed] [Google Scholar]
- Durfee T, Hansen AM, Zhi H, Blattner FR, Jin DJ (2008) Transcription profiling of the stringent response in Escherichia coli . J Bacteriol 190: 1084–1096 [DOI] [PMC free article] [PubMed] [Google Scholar]
- Elowitz MB, Levine AJ, Siggia ED, Swain PS (2002) Stochastic gene expression in a single cell. Science 297: 1183–1186 [DOI] [PubMed] [Google Scholar]
- Garcia EC, Perault AI, Marlatt SA, Cotter PA (2016) Interbacterial signaling via Burkholderia contact‐dependent growth inhibition system proteins. Proc Natl Acad Sci USA 113: 8296–8301 [DOI] [PMC free article] [PubMed] [Google Scholar]
- Germain E, Castro‐Roa D, Zenkin N, Gerdes K (2013) Molecular mechanism of bacterial persistence by HipA. Mol Cell 52: 248–254 [DOI] [PubMed] [Google Scholar]
- Gutierrez A, Jain S, Bhargava P, Hamblin M, Lobritz MA, Collins JJ (2017) Understanding and sensitizing density‐dependent persistence to quinolone antibiotics. Mol Cell 68: 1147–1154.e3 [DOI] [PubMed] [Google Scholar]
- Helaine S, Thompson JA, Watson KG, Liu M, Boyle C, Holden DW (2010) Dynamics of intracellular bacterial replication at the single cell level. Proc Natl Acad Sci USA 107: 3746–3751 [DOI] [PMC free article] [PubMed] [Google Scholar]
- Hirsch M, Elliott T (2002) Role of ppGpp in rpoS stationary‐phase regulation in Escherichia coli . J Bacteriol 184: 5077–5087 [DOI] [PMC free article] [PubMed] [Google Scholar]
- Jamet A, Jousset AB, Euphrasie D, Mukorako P, Boucharlat A, Ducousso A, Charbit A, Nassif X (2015) A new family of secreted toxins in pathogenic Neisseria species. PLoS Pathog 11: e1004592 [DOI] [PMC free article] [PubMed] [Google Scholar]
- Jones AM, Garza‐Sanchez F, So J, Hayes CS, Low DA (2017) Activation of contact‐dependent antibacterial tRNase toxins by translation elongation factors. Proc Natl Acad Sci USA 114: E1951–E1957 [DOI] [PMC free article] [PubMed] [Google Scholar]
- Keren I, Kaldalu N, Spoering A, Wang Y, Lewis K (2004a) Persister cells and tolerance to antimicrobials. FEMS Microbiol Lett 230: 13–18 [DOI] [PubMed] [Google Scholar]
- Keren I, Shah D, Spoering A, Kaldalu N, Lewis K (2004b) Specialized persister cells and the mechanism of multidrug tolerance in Escherichia coli . J Bacteriol 186: 8172–8180 [DOI] [PMC free article] [PubMed] [Google Scholar]
- Korch SB, Henderson TA, Hill TM (2003) Characterization of the hipA7 allele of Escherichia coli and evidence that high persistence is governed by (p)ppGpp synthesis. Mol Microbiol 50: 1199–1213 [DOI] [PubMed] [Google Scholar]
- Koskiniemi S, Lamoureux JG, Nikolakakis KC, t'Kint de Roodenbeke C, Kaplan MD, Low DA, Hayes CS (2013) Rhs proteins from diverse bacteria mediate intercellular competition. Proc Natl Acad Sci USA 110: 7032–7037 [DOI] [PMC free article] [PubMed] [Google Scholar]
- Koskiniemi S, Garza‐Sanchez F, Sandegren L, Webb JS, Braaten BA, Poole SJ, Andersson DI, Hayes CS, Low DA (2014) Selection of orphan Rhs toxin expression in evolved Salmonella enterica serovar typhimurium. PLoS Genet 10: e1004255 [DOI] [PMC free article] [PubMed] [Google Scholar]
- Koskiniemi S, Garza‐Sanchez F, Edman N, Chaudhuri S, Poole SJ, Manoil C, Hayes CS, Low DA (2015) Genetic analysis of the CDI pathway from Burkholderia pseudomallei 1026b. PLoS One 10: e0120265 [DOI] [PMC free article] [PubMed] [Google Scholar]
- Kuroda A, Nomura K, Ohtomo R, Kato J, Ikeda T, Takiguchi N, Ohtake H, Kornberg A (2001) Role of inorganic polyphosphate in promoting ribosomal protein degradation by the Lon protease in E. coli . Science 293: 705–708 [DOI] [PubMed] [Google Scholar]
- Leung V, Levesque CM (2012) A stress‐inducible quorum‐sensing peptide mediates the formation of persister cells with noninherited multidrug tolerance. J Bacteriol 194: 2265–2274 [DOI] [PMC free article] [PubMed] [Google Scholar]
- Maisonneuve E, Shakespeare LJ, Jorgensen MG, Gerdes K (2011) Bacterial persistence by RNA endonucleases. Proc Natl Acad Sci USA 108: 13206–13211 [DOI] [PMC free article] [PubMed] [Google Scholar] [Retracted]
- Maisonneuve E, Castro‐Camargo M, Gerdes K (2013) (p)ppGpp controls bacterial persistence by stochastic induction of toxin‐antitoxin activity. Cell 154: 1140–1150 [DOI] [PubMed] [Google Scholar]
- Melvin JA, Gaston JR, Phillips SN, Springer MJ, Marshall CW, Shanks RMQ, Bomberger JM (2017) Pseudomonas aeruginosa contact‐dependent growth inhibition plays dual role in host‐pathogen interactions. mSphere 2: e00336–17 [DOI] [PMC free article] [PubMed] [Google Scholar]
- Mercy C, Ize B, Salcedo SP, de Bentzmann S, Bigot S (2016) Functional characterization of pseudomonas contact dependent growth inhibition (CDI) systems. PLoS One 11: e0147435 [DOI] [PMC free article] [PubMed] [Google Scholar]
- Moker N, Dean CR, Tao J (2010) Pseudomonas aeruginosa increases formation of multidrug‐tolerant persister cells in response to quorum‐sensing signaling molecules. J Bacteriol 192: 1946–1955 [DOI] [PMC free article] [PubMed] [Google Scholar]
- Moyed HS, Bertrand KP (1983) hipA, a newly recognized gene of Escherichia coli K‐12 that affects frequency of persistence after inhibition of murein synthesis. J Bacteriol 155: 768–775 [DOI] [PMC free article] [PubMed] [Google Scholar]
- Ozbudak EM, Thattai M, Kurtser I, Grossman AD, van Oudenaarden A (2002) Regulation of noise in the expression of a single gene. Nat Genet 31: 69–73 [DOI] [PubMed] [Google Scholar]
- Poole SJ, Diner EJ, Aoki SK, Braaten BA, t'Kint de Roodenbeke C, Low DA, Hayes CS (2011) Identification of functional toxin/immunity genes linked to contact‐dependent growth inhibition (CDI) and rearrangement hotspot (Rhs) systems. PLoS Genet 7: e1002217 [DOI] [PMC free article] [PubMed] [Google Scholar]
- Pu Y, Zhao Z, Li Y, Zou J, Ma Q, Zhao Y, Ke Y, Zhu Y, Chen H, Baker MA, Ge H, Sun Y, Xie XS, Bai F (2016) Enhanced efflux activity facilitates drug tolerance in dormant bacterial cells. Mol Cell 62: 284–294 [DOI] [PMC free article] [PubMed] [Google Scholar]
- Ruhe ZC, Low DA, Hayes CS (2013a) Bacterial contact‐dependent growth inhibition. Trends Microbiol 21: 230–237 [DOI] [PMC free article] [PubMed] [Google Scholar]
- Ruhe ZC, Wallace AB, Low DA, Hayes CS (2013b) Receptor polymorphism restricts contact‐dependent growth inhibition to members of the same species. MBio 4: e00480–13 [DOI] [PMC free article] [PubMed] [Google Scholar]
- Ruhe ZC, Townsley L, Wallace AB, King A, Van der Woude MW, Low DA, Yildiz FH, Hayes CS (2015) CdiA promotes receptor‐independent intercellular adhesion. Mol Microbiol 98: 175–192 [DOI] [PMC free article] [PubMed] [Google Scholar]
- Ruhe ZC, Nguyen JY, Chen AJ, Leung NY, Hayes CS, Low DA (2016) CDI systems are stably maintained by a cell‐contact mediated surveillance mechanism. PLoS Genet 12: e1006145 [DOI] [PMC free article] [PubMed] [Google Scholar]
- Ruhe ZC, Nguyen JY, Xiong J, Koskiniemi S, Beck CM, Perkins BR, Low DA, Hayes CS (2017) CdiA effectors use modular receptor‐binding domains to recognize target bacteria. MBio 8: e00290–17 [DOI] [PMC free article] [PubMed] [Google Scholar]
- Sakai F, Sugita R, Chang JW, Ogawa T, Tsumadori N, Takahashi K, Hidaka M, Masaki H (2015) Transfer‐messenger RNA and SmpB mediate bacteriostasis in Escherichia coli cells against tRNA cleavage. Microbiology 161: 2019–2028 [DOI] [PubMed] [Google Scholar]
- Schneider DA, Murray HD, Gourse RL (2003) Measuring control of transcription initiation by changing concentrations of nucleotides and their derivatives. Methods Enzymol 370: 606–617 [DOI] [PubMed] [Google Scholar]
- Shan Y, Brown Gandt A, Rowe SE, Deisinger JP, Conlon BP, Lewis K (2017) ATP‐dependent persister formation in Escherichia coli . MBio 8: e02267–16 [DOI] [PMC free article] [PubMed] [Google Scholar]
- Smith AS, Rawlings DE (1998) Efficiency of the pTF‐FC2 pas poison‐antidote stability system in Escherichia coli is affected by the host strain, and antidote degradation requires the lon protease. J Bacteriol 180: 5458–5462 [DOI] [PMC free article] [PubMed] [Google Scholar]
- Spoering AL, Lewis K (2001) Biofilms and planktonic cells of Pseudomonas aeruginosa have similar resistance to killing by antimicrobials. J Bacteriol 183: 6746–6751 [DOI] [PMC free article] [PubMed] [Google Scholar]
- Tosa T, Pizer LI (1971) Effect of serine hydroxamate on the growth of Escherichia coli . J Bacteriol 106: 966–971 [DOI] [PMC free article] [PubMed] [Google Scholar]
- Traxler MF, Summers SM, Nguyen HT, Zacharia VM, Hightower GA, Smith JT, Conway T (2008) The global, ppGpp‐mediated stringent response to amino acid starvation in Escherichia coli . Mol Microbiol 68: 1128–1148 [DOI] [PMC free article] [PubMed] [Google Scholar]
- Tsuchimoto S, Nishimura Y, Ohtsubo E (1992) The stable maintenance system pem of plasmid R100: degradation of PemI protein may allow PemK protein to inhibit cell growth. J Bacteriol 174: 4205–4211 [DOI] [PMC free article] [PubMed] [Google Scholar]
- Van den Bergh B, Michiels JE, Wenseleers T, Windels EM, Boer PV, Kestemont D, De Meester L, Verstrepen KJ, Verstraeten N, Fauvart M, Michiels J (2016) Frequency of antibiotic application drives rapid evolutionary adaptation of Escherichia coli persistence. Nat Microbiol 1: 16020 [DOI] [PubMed] [Google Scholar]
- Van Melderen L, Bernard P, Couturier M (1994) Lon‐dependent proteolysis of CcdA is the key control for activation of CcdB in plasmid‐free segregant bacteria. Mol Microbiol 11: 1151–1157 [DOI] [PubMed] [Google Scholar]
- Vazquez‐Laslop N, Lee H, Neyfakh AA (2006) Increased persistence in Escherichia coli caused by controlled expression of toxins or other unrelated proteins. J Bacteriol 188: 3494–3497 [DOI] [PMC free article] [PubMed] [Google Scholar]
- Veening JW, Smits WK, Kuipers OP (2008) Bistability, epigenetics, and bet‐hedging in bacteria. Annu Rev Microbiol 62: 193–210 [DOI] [PubMed] [Google Scholar]
- Vega NM, Allison KR, Khalil AS, Collins JJ (2012) Signaling‐mediated bacterial persister formation. Nat Chem Biol 8: 431–433 [DOI] [PMC free article] [PubMed] [Google Scholar]
- Verstraeten N, Knapen WJ, Kint CI, Liebens V, Van den Bergh B, Dewachter L, Michiels JE, Fu Q, David CC, Fierro AC, Marchal K, Beirlant J, Versees W, Hofkens J, Jansen M, Fauvart M, Michiels J (2015) Obg and membrane depolarization are part of a microbial bet‐hedging strategy that leads to antibiotic tolerance. Mol Cell 59: 9–21 [DOI] [PubMed] [Google Scholar]
- Webb JS, Nikolakakis KC, Willett JL, Aoki SK, Hayes CS, Low DA (2013) Delivery of CdiA nuclease toxins into target cells during contact‐dependent growth inhibition. PLoS One 8: e57609 [DOI] [PMC free article] [PubMed] [Google Scholar]
- Whitney JC, Quentin D, Sawai S, LeRoux M, Harding BN, Ledvina HE, Tran BQ, Robinson H, Goo YA, Goodlett DR, Raunser S, Mougous JD (2015) An interbacterial NAD(P)(+) glycohydrolase toxin requires elongation factor Tu for delivery to target cells. Cell 163: 607–619 [DOI] [PMC free article] [PubMed] [Google Scholar]
- Yim HH, Brems RL, Villarejo M (1994) Molecular characterization of the promoter of osmY, an rpoS‐dependent gene. J Bacteriol 176: 100–107 [DOI] [PMC free article] [PubMed] [Google Scholar]
Associated Data
This section collects any data citations, data availability statements, or supplementary materials included in this article.
Supplementary Materials
Appendix
Expanded View Figures PDF
Source Data for Expanded View and Appendix
Review Process File
Source Data for Figure 1
Source Data for Figure 2
Source Data for Figure 3
Source Data for Figure 4
Source Data for Figure 5
Source Data for Figure 6
Source Data for Figure 7
Source Data for Figure 8