

Abstract
P4‐ATPases are phospholipid flippases that translocate phospholipids from the exoplasmic/luminal to the cytoplasmic leaflet of biological membranes. All P4‐ATPases in yeast and some in other organisms are required for membrane trafficking; therefore, changes in the transbilayer lipid composition induced by flippases are thought to be crucial for membrane deformation. However, it is poorly understood whether the phospholipid‐flipping activity of P4‐ATPases can promote membrane deformation. In this study, we assessed membrane deformation induced by flippase activity via monitoring the extent of membrane tubulation using a system that allows inducible recruitment of Bin/amphiphysin/Rvs (BAR) domains to the plasma membrane (PM). Enhanced phosphatidylcholine‐flippase activity at the PM due to expression of ATP10A, a member of the P4‐ATPase family, promoted membrane tubulation upon recruitment of BAR domains to the PM. This is the important evidence that changes in the transbilayer lipid composition induced by P4‐ATPases can deform biological membranes.
Keywords: BAR domain, curvature, flippase, lipid, plasma membrane
Subject Categories: Membrane & Intracellular Transport
Introduction
P4‐ATPases flip phospholipids across the bilayer to generate and regulate the asymmetric distributions of lipids in eukaryotic cells. Phosphatidylserine (PS) and phosphatidylethanolamine (PE) are enriched in the cytoplasmic leaflet of the plasma membrane (PM), whereas phosphatidylcholine (PC) and sphingomyelin are abundant in the exoplasmic leaflet (Devaux, 1991; Zachowski, 1993; Murate et al, 2015). Genetic studies in Saccharomyces cerevisiae, Arabidopsis thaliana, and Caenorhabditis elegans revealed that P4‐ATPases play roles in membrane trafficking. All five yeast P4‐ATPases are involved in membrane trafficking at different stages of the secretory and endocytic pathways (Muthusamy et al, 2009; Graham & Burd, 2011). In addition, PS flipping at the trans‐Golgi network participates in exocytic protein sorting and enhances membrane curvature in yeast (Chen et al, 1999; Xu et al, 2013; Hankins et al, 2015). The human genome encodes 14 P4‐ATPases; however, their functions are poorly understood (Andersen et al, 2016). Among mammalian P4‐ATPases, ATP8A1 and ATP9A are required for endosome‐mediated membrane trafficking, and PS flipping by ATP8A1 is needed for recruitment of EHD1 to recycling endosomes (Lee et al, 2015; Tanaka et al, 2016). Therefore, the activities of P4‐ATPases seem to be required for the recruitment of proteins involved in membrane trafficking to cellular compartments. Another plausible hypothesis is that P4‐ATPase‐mediated phospholipid translocation generates an imbalance in the level of lipids between the leaflets of the bilayer. The resultant lipid loading in the cytoplasmic leaflet would drive inwardly directed membrane deformation, leading to the membrane curvature required for vesicle budding (Graham, 2004; Takeda et al, 2014; Panatala et al, 2015). Cell shape drastically changes upon exogenous application of lyso‐PC or impermeable amphipathic drugs, suggesting that the shape of lipid species and/or an imbalance in lipid mass (translocation of lyso‐PC is much slower than that of PC) are involved in the generation of membrane curvature (Sheetz & Singer, 1974; Devaux et al, 2008). Changes in lipid composition following addition of exogenous phospholipids alter the shape of erythrocytes, and it was thus hypothesized that ATP‐dependent lipid translocases at the PM are involved in membrane shape changes (Seigneuret & Devaux, 1984; Daleke & Huestis, 1989). We and other groups have recently shown the flippase activities of mammalian P4‐ATPases (Zhu et al, 2012; Takatsu et al, 2014; Lee et al, 2015; Naito et al, 2015; Segawa et al, 2016) using a cell‐based flippase assay. However, it remains unknown whether flippase activity of P4‐ATPase family can induce membrane curvature because spatiotemporal flippase activity cannot be visualized together with membrane deformation in biological membranes. To overcome this technical problem, we designed an experiment to indirectly assess membrane deformation induced by flippase activity in the PM.
We have previously shown that enhanced PC‐flippase activity at the PM changes cell shape, decreases cell size, and delays cell spreading on extracellular matrix, possibly by increasing inwardly directed PM bending (Naito et al, 2015; Miyano et al, 2016). Therefore, spatiotemporally regulated movement of lipids between the leaflets of the bilayer could contribute to PM remodeling. In fact, a mutation in the mouse Atp11c gene, another member of the P4‐ATPase family, alters the morphology of erythrocytes (Yabas et al, 2014), and a complex comprising ATP8A1 and CDC50A has been implicated to play a role in cell migration (Kato et al, 2013). CDC50A interacts with most P4‐ATPases and is required for the transport of newly synthesized P4‐ATPases from the endoplasmic reticulum to cellular compartments and/or the PM (Takatsu et al, 2011; Naito et al, 2015).
To investigate whether a lipid imbalance in the bilayer induced by P4‐ATPases is directly linked with membrane curvature, we used BIN/amphiphysin/Rvs (BAR) domains, which dimerize to form a crescent‐shaped structure, sense membrane curvature, and generate tubular membrane structures via self‐oligomerizing in biological membranes (Peter et al, 2004; Itoh & De Camilli, 2006; Frost et al, 2008; Yin et al, 2009). BAR domains are categorized into four main subfamilies: classic BAR, N‐terminal amphipathic helix‐containing BAR (N‐BAR), Fes‐CIP4 homology BAR (F‐BAR), and inverse BAR (I‐BAR; Itoh & De Camilli, 2006; Frost et al, 2009). These domains mediate membrane curvature by performing scaffolding roles and/or inserting amphipathic helices along lipid bilayers, and form membrane tubules in cells and artificial liposomes (Gallop et al, 2006; Masuda et al, 2006; Bhatia et al, 2009; Poudel et al, 2016).
Membrane deformation/tubulation induced by BAR domains from the PM has been visualized using a chemically inducible dimerization (CID) technique that allows acute recruitment of these domains to the PM (Komatsu et al, 2010; Suarez et al, 2014). The PM‐recruited N‐BAR domain induces dramatic membrane tubulation from the PM (Suarez et al, 2014). By striking contrast, the ΔN‐BAR domain, which lacks the N‐terminal amphipathic helix of the N‐BAR domain and thus is structurally similar to classic BAR domains, and the F‐BAR domain rarely promote the formation of membrane tubules from the PM (Suarez et al, 2014), although classic BAR and F‐BAR domains can induce membrane tubule formation from liposomes (Peter et al, 2004; Henne et al, 2007). The amphipathic helix of the N‐BAR domain penetrates the lipid bilayer, leading to increased membrane curvature into the cytoplasm, and the BAR domain subsequently senses this curvature and drives membrane tubule formation (Fig 8A; Gallop et al, 2006; Campelo et al, 2008; McMahon & Boucrot, 2015; Poudel et al, 2016). Therefore, we hypothesized that if proper membrane curvature is generated, the ΔN‐BAR and/or F‐BAR domains should be able to induce the generation of membrane tubules from the PM in the same way as the N‐BAR domain does. We assessed membrane curvature induced by flippase activity via monitoring the extent of membrane tubulation using the CID technique that allows acute recruitment of BAR domains to the PM.
Figure 8. Schematic illustration of the sensing and/or generation of membrane curvature by BAR domains.
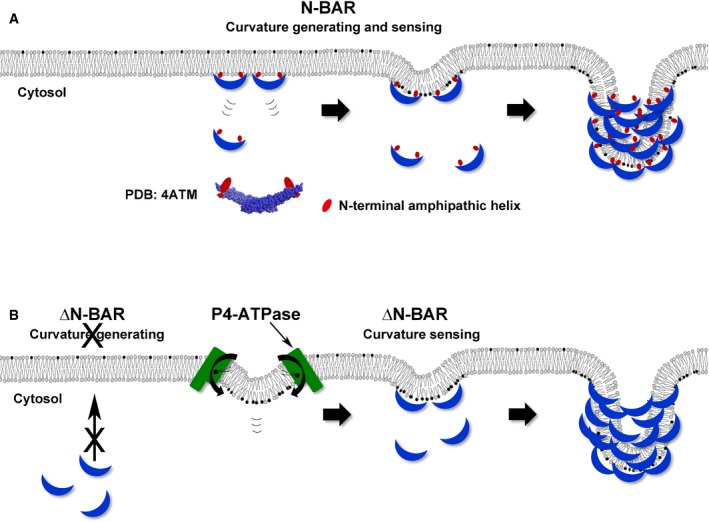
- Penetration of the N‐terminal amphipathic helix of the N‐BAR domain has a wedging effect, leading to increased membrane curvature into the cytoplasm. The N‐BAR domain subsequently senses this membrane curvature and triggers membrane tubulation by oligomerizing along the membrane (PDB: 4ATM, N‐BAR domain of amphiphysin 1).
- By contrast, the ΔN‐BAR domain, which lacks the amphipathic helix, cannot generate membrane curvature by itself, but can still sense membrane curvature. Thus, the ΔN‐BAR domain can generate membrane tubulation following induction of membrane deformation by P4‐ATPases.
Results and Discussion
Recruitment of the N‐BAR domain, but not of the ΔN‐BAR or F‐BAR domain, to the PM induces the generation of membrane tubules from the PM
We transfected HeLa cells with two constructs: fluorescent protein‐fused PM‐targeting FRB [FK506‐binding protein (FKBP)–rapamycin‐binding domain] and fluorescent protein‐fused FKBP‐BAR domains (Fig EV1A). TagBFP2‐ or TagRFP‐tagged FRB was targeted to the PM by adding the N‐terminal 11 amino acids (AA) of Lyn, and EGFP‐ or mCherry‐tagged FKBP was fused to each BAR domain [N‐BAR (N‐BAR domain of human amphiphysin 1), ΔN‐BAR (lacking the N‐terminal amphipathic helix of the N‐BAR domain), or F‐BAR (F‐BAR domain of formin‐binding protein 17, FBP17)] (Suarez et al, 2014). The morphology of the PM was visualized by confocal or epifluorescence microscopy, as shown by fluorescent signals of the PM‐targeting FRB and FKBP‐BAR domains, following treatment with rapamycin, which triggers heterodimerization of FRB and FKBP (Fig EV1A). In the absence of rapamycin, all FKBP‐BAR domains, as well as EGFP‐FKBP, were predominantly distributed throughout the cytoplasm, and PM‐targeting FRB was localized at the PM as described previously (Fig EV1B–D, a and c, Movies EV1, EV2, EV3 and EV4; Suarez et al, 2014). Upon treatment with rapamycin, the FKBP‐BAR domains and EGFP‐FKBP were rapidly recruited to the PM (Fig EV1B–D, b–b″ and d–d″, Movies EV1, EV2, EV3 and EV4). The CID‐engineered N‐BAR domain rapidly induced dramatic formation of tubular structures from the PM (Fig EV1B, b–b″ and d–d″, Movie EV2, Fig 8; Yin et al, 2009; Suarez et al, 2014). These tubular structures did not colocalize with markers of endosomes or the Golgi complex (Fig EV1E); therefore, it is unlikely that they were generated from these intracellular compartments. By contrast, the CID‐engineered ΔN‐BAR and F‐BAR domains, as well as EGFP alone, failed to induce membrane tubulation from the PM, even if they were efficiently recruited to the PM upon rapamycin treatment (Fig EV1C and D, b–b″ and d–d″, Movies EV1, EV3, and EV4; Suarez et al, 2014). Thus, penetration of the amphipathic helix of the N‐BAR domain may have a wedging effect, leading to increased curvature of the PM into the cytoplasm, and the BAR domain may subsequently sense this membrane curvature and drive membrane tubulation via oligomerizing along the membrane (Fig 8A; Gallop et al, 2006; Campelo et al, 2008; Poudel et al, 2016).
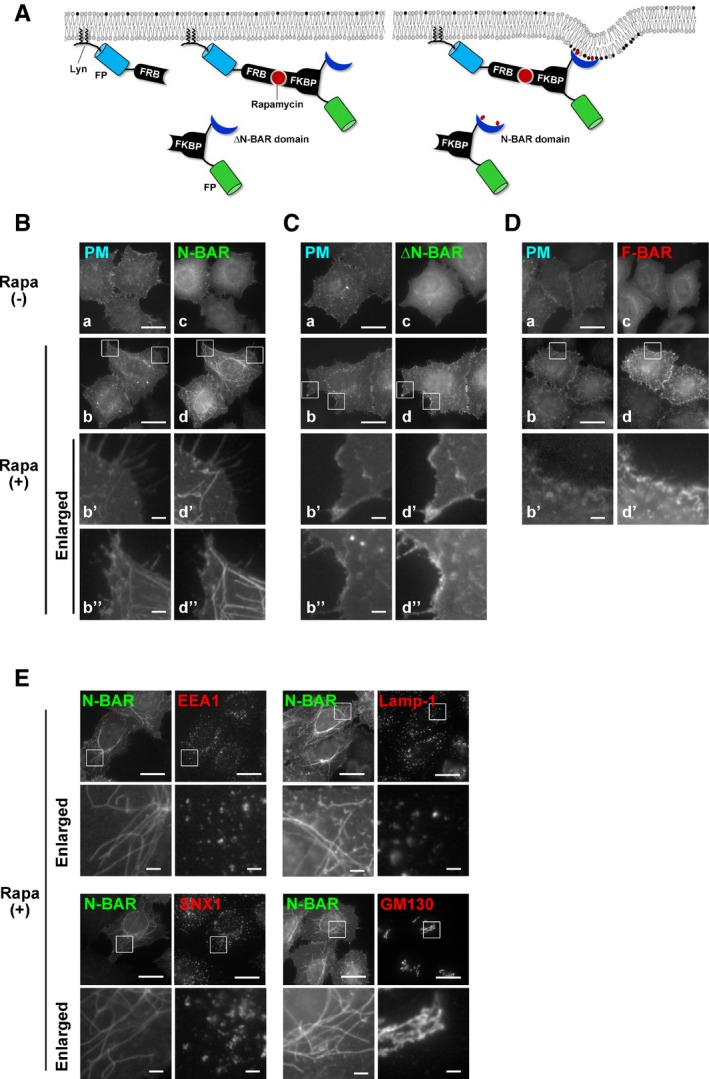
Figure EV1. Membrane tubulation is induced by recruitment of the N‐BAR domain, but not of the ΔN‐BAR or F‐BAR domain, to the PM.
-
ASchematic illustration of the CID system that allows acute recruitment of BAR domains to the PM following treatment with rapamycin. FP, fluorescent protein; FKBP, FK506‐binding protein; FRB, FKBP–rapamycin‐binding domain.
-
B–DHeLa cells were transiently co‐transfected with expression vectors for Lyn‐TagBFP2‐FRB (PM) and EGFP‐FKBP‐N‐BAR (N‐BAR), EGFP‐FKBP‐ΔN‐BAR (ΔN‐BAR), or mCherry‐FKBP‐F‐BAR (F‐BAR). After 24 h, cells were treated with vehicle alone [Rapa(−)] or 200 nM rapamycin [Rapa(+)] for 15 min, fixed, and observed using an epifluorescence microscope. Panels b′, b″, d′, and d″ show enlarged images of the insets in b and d. Scale bars, 20 μm. Scale bars in enlarged images, 2 μm.
-
EHeLa cells were transiently co‐transfected with expression vectors for Lyn‐TagBFP2‐FRB (PM) and EGFP‐FKBP‐N‐BAR (N‐BAR). After 24 h, cells were treated with 200 nM rapamycin for 15 min, fixed, and stained with an antibody against EEA1, Lamp‐1, sorting nexin 1 (SNX1), or GM130 (markers of early endosomes, late endosomes/lysosomes, endosomes, and the Golgi complex, respectively) followed by an Alexa Fluor 555‐conjugated anti‐mouse secondary antibody. Insets were enlarged. Scale bars, 20 μm. Scale bars in enlarged images, 2 μm.
Recruitment of the ΔN‐BAR or F‐BAR domain to the PM leads to the generation of membrane tubules in cells stably expressing ATP10A
We previously showed that ATP10A localizes at the PM and exhibits relatively high PC‐flipping activity and that its exogenous expression changes cell shape and delays cell adhesion and cell spreading on the extracellular matrix (Naito et al, 2015; Miyano et al, 2016). PC is primarily enriched in the exoplasmic leaflet of the PM (Murate et al, 2015). Thus, increased PC‐flippase activity due to ATP10A expression allows continuous and excessive phospholipid flipping from the exoplasmic to the cytoplasmic leaflet, resulting in changes in cell shape, decreases in cell size, and delays in cell spreading (Naito et al, 2015; Miyano et al, 2016). ATP10A is not expressed in HeLa cells (Takatsu et al, 2011; Fig EV4A), and thus, its expression may have marked effects on these cells. We hypothesized that ATP10A expression might trigger inward bending of the PM, thereby promoting membrane tubulation induced by PM‐recruited BAR domains. To test this hypothesis, we used HeLa cells stably expressing ATP10A; the ATP10A(E203Q) mutant, which lacks ATPase activity; and ATP11A, which specifically flips PS/PE at the PM (Takatsu et al, 2014; Fig 1). The expression level of ATP10A was comparable to that of ATP10A(E203Q) and lower than that of ATP11A (Fig EV2A), and PC‐flippase activity was not altered upon rapamycin treatment (Fig EV2B). We also confirmed that the PC‐flippase activity of ATP10A was not altered upon expression of BAR domains or their recruitment to the PM (Fig EV2C).
Figure EV4. Depletion of ATP10A in ATP10A‐expressing cells.
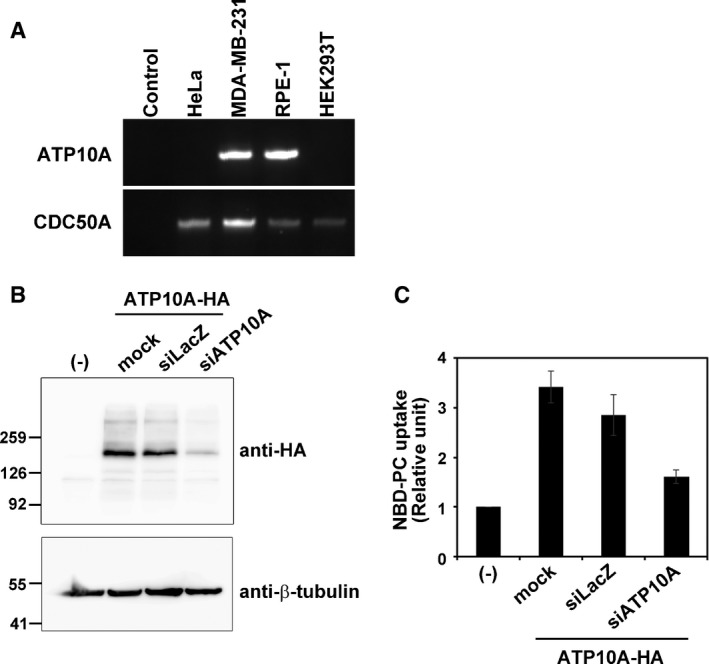
- RT–PCR was performed using total RNA isolated from the indicated cell lines. RNA was omitted in control reactions.
- HeLa cells stably expressing HA‐tagged ATP10A were treated with a pool of siRNAs targeting LacZ or ATP10A. After 120 h, cells were lysed and subjected to SDS–PAGE and immunoblotting with an anti‐HA or anti‐β‐tubulin antibody. (−) indicates parental HeLa cells.
- Cells treated with a pool of siRNAs targeting LacZ or ATP10A were incubated with NBD‐PC at 15°C as described in the legend of Fig EV2. The fold increase in NBD‐PC uptake relative to that in parental cells is shown. Graphs display means ± SD of three independent experiments.
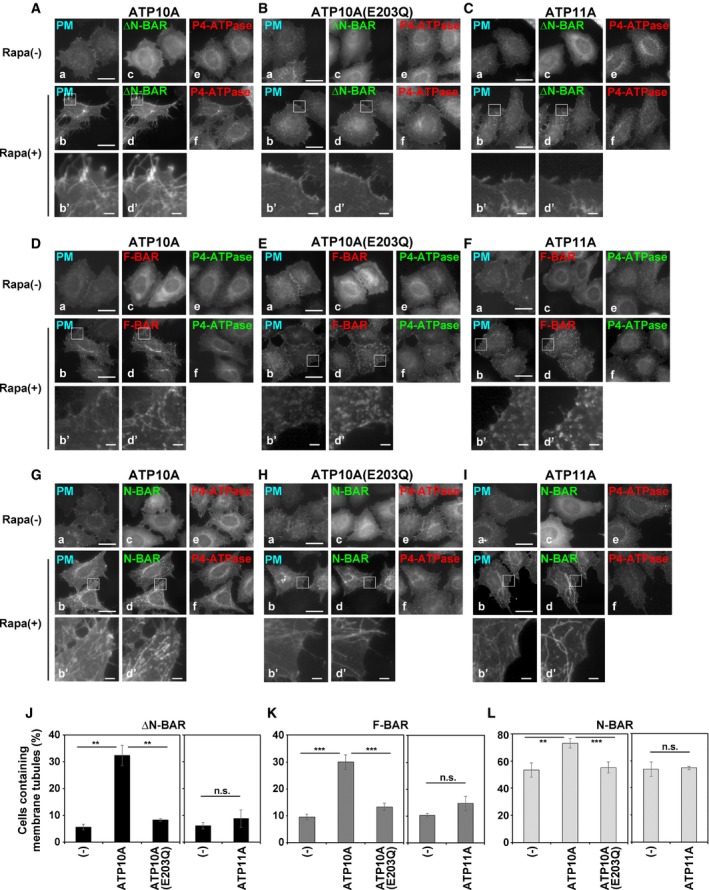
Figure 1. Enhancement of PC‐flippase activity at the PM upon expression of ATP10A triggers membrane tubulation by PM‐recruited ΔN‐BAR and F‐BAR domains.
-
A–IHeLa cells stably expressing C‐terminally HA‐tagged ATP10A, ATP10A(E203Q), and ATP11A were transiently co‐transfected with expression vectors for Lyn‐TagBFP2‐FRB (PM) and EGFP‐FKBP‐N‐BAR (N‐BAR), EGFP‐FKBP‐ΔN‐BAR (ΔN‐BAR), or mCherry‐FKBP‐F‐BAR (F‐BAR). Cells were treated with vehicle alone [Rapa(−)] or 200 nM rapamycin [Rapa (+)] for 15 min and fixed. Fixed cells were stained for an anti‐HA primary antibody, followed by a Cy3‐conjugated (A–C, G–I) or Alexa Fluor 488‐conjugated (D–F) anti‐rat secondary antibody. Panels b′ and d′ show enlarged images of the insets in b and d, respectively. Scale bars, 20 μm. Scale bars in enlarged images, 2 μm.
-
J–LCells containing membrane tubules were counted [420–672 cells (ΔN‐BAR), 417–527 cells (F‐BAR), and 422–805 cells (N‐BAR) per sample]. Graphs display means ± SD of three independent experiments. **P < 0.01; ***P < 0.005; Welch's t‐test.
Figure EV2. Flippase activity in ATP10A‐expressing cells.
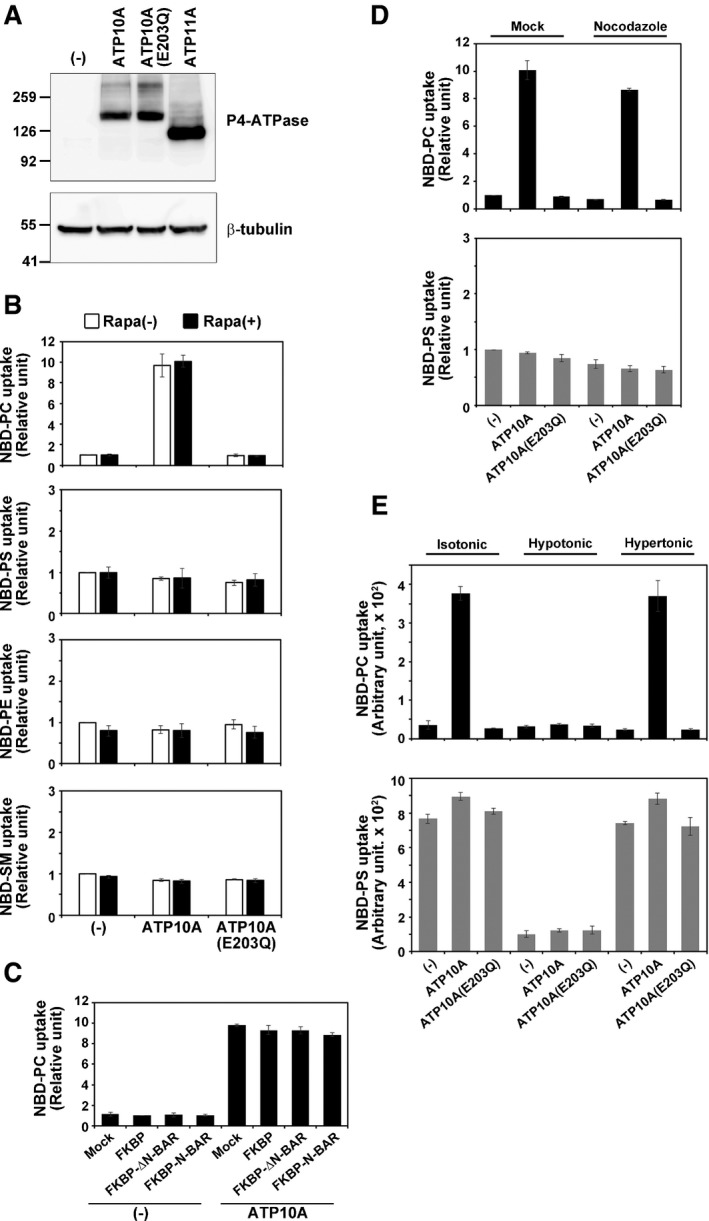
-
AHeLa cells stably expressing HA‐tagged P4‐ATPases were lysed and subjected to SDS–PAGE and immunoblotting with an anti‐HA or anti‐β‐tubulin antibody to determine the total level of the P4‐ATPase protein.
-
B–ECells were then incubated with the indicated NBD‐labeled lipids at 15°C for 15 min. After extraction with fatty acid‐free BSA, the residual fluorescence intensity associated with cells was determined by flow cytometry. The fold increase in NBD‐lipid uptake relative to that in vector‐infected control cells (−) (B and D) or mCherry‐FKBP‐transfected cells (FKBP, (−)) (C) is shown. Graphs display means ± SD of three independent experiments. (B) HeLa cells stably expressing P4‐ATPases were treated with vehicle alone [Rapa(−)] or 200 nM rapamycin [Rapa(+)] for 15 min. (C) HeLa cells stably expressing ATP10A were mock‐transfected (Mock) or transiently co‐transfected with expression vectors for Lyn‐TagRFP‐FRB (PM) and mCherry‐FKBP, mCherry‐FKBP‐ΔN‐BAR (ΔN‐BAR), or mCherry‐FKBP‐N‐BAR (N‐BAR). After 24 h, cells were treated with 200 nM rapamycin. (D, E) HeLa cells stably expressing P4‐ATPases were treated with vehicle alone (Mock), or 16.7 μM of nocodazole or incubated in isotonic, hypotonic, or hypertonic medium.
Recruitment of the ΔN‐BAR or F‐BAR domain to the PM did not cause membrane tubulation in parental HeLa cells (Fig EV1C and D). By contrast, recruitment of the ΔN‐BAR or F‐BAR domain to the PM induced drastic membrane tubulation in cells expressing ATP10A (Fig 1A and D, b, b′, d, and d′, Movies EV5, EV6, EV9, and EV10), but not in cells expressing ATP10A(E203Q; Fig 1B and E, b, b′, d, and d′, Movie EV7). These results demonstrate that the PC‐flippase activity of ATP10A mediates membrane tubule formation. Recruitment of the N‐BAR domain to the PM caused membrane tubulation in parental HeLa cells as well as cells expressing ATP10A, ATP10A(E203Q), and ATP11A (Fig 1G–I, b′ and d′, and Fig EV1B). No tubular membrane structures were observed in cells not treated with rapamycin (Fig 1A, D, and G, a and c, Movies EV5 and EV6). For semi‐quantitative analysis, we counted the numbers of cells containing tubular membrane structures following rapamycin treatment. Recruitment of the ΔN‐BAR or F‐BAR domain to the PM in ATP10A‐expressing cells increased the proportion of cells containing tubular structures relative to control and ATP10A(E203Q)‐expressing cells (Fig 1J and K). Although the PM‐recruited N‐BAR domain drove membrane tubulation in parental HeLa cells (Figs EV1B and 1L (−)), the number of cells containing tubular structures was slightly higher among those expressing ATP10A, but not among those expressing ATP10A(E203Q) or ATP11A (Fig 1L).
The PM‐recruited ΔN‐BAR and F‐BAR domains did not cause membrane tubulation in cells expressing ATP11A, which flips PS/PE at the PM (Takatsu et al, 2014; Fig 1C and F, b, b′, d, and d′, and J and K). The level of PS/PE is limited in the exoplasmic leaflet (Op den Kamp, 1979; Murate et al, 2015); therefore, exogenous expression of ATP11A may not trigger membrane deformation. Therefore, excessive PC flipping from the outer to the inner leaflet driven by ATP10A generates membrane curvature by inducing an imbalance of lipid mass between the two leaflets.
Disruption of cytoskeleton leads to a reduction in membrane tension that can initiate membrane tubulation mediated by an N‐BAR domain‐containing protein (Gauthier et al, 2012; Masters et al, 2013; Shi & Baumgart, 2015). We therefore investigated whether this membrane tubulation, which is induced by BAR domains in ATP10A‐expressing cells, is caused by disruption of cytoskeleton. The integrity of the actin cytoskeleton and microtubules was not affected by expression of ATP10A or recruitment of the ΔN‐BAR domain to the PM in ATP10A‐expressing cells in comparison with control cells (Fig 2A and B, a, a′, d, d′, g, and g′). These results suggest that enhanced PC‐flipping activity increases inward bending of the PM and generates membrane curvature. Thus, the PM‐recruited ΔN‐BAR and F‐BAR domains stably interact with curved membranes, resulting in membrane tubulation from the PM.
Figure 2. Expression of ATP10A does not affect the integrity of the actin cytoskeleton or microtubules.
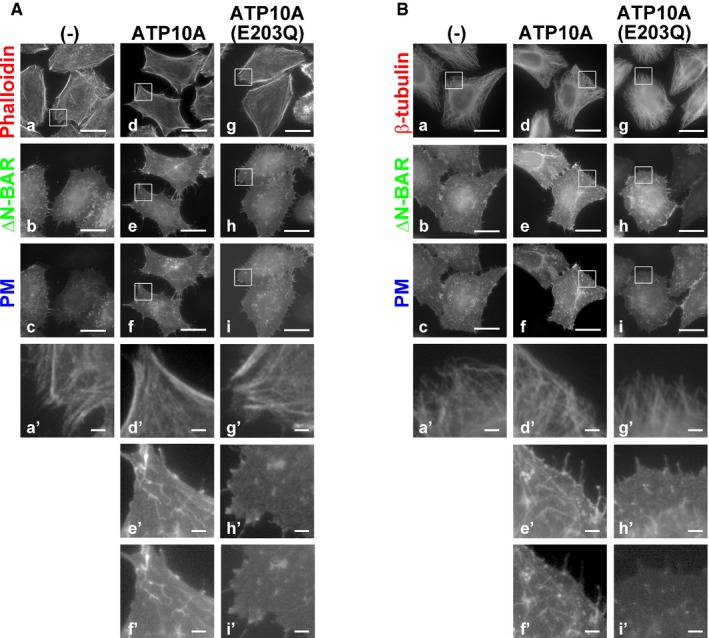
-
A, BHeLa cells stably expressing C‐terminally HA‐tagged ATP10A or ATP10A(E203Q) were transiently co‐transfected with expression vectors for Lyn‐TagBFP2‐FRB (PM) and EGFP‐FKBP‐ΔN‐BAR (ΔN‐BAR). Cells were treated with 200 nM rapamycin for 15 min and fixed. Fixed cells were permeabilized and incubated with Alexa Fluor 555‐conjugated phalloidin (A) or stained with an anti‐β‐tubulin primary antibody followed by an Alexa Fluor 555‐conjugated anti‐mouse secondary antibody (B). Panels a′ and d′–i′ show enlarged images of the insets in a and d–i, respectively. Scale bars, 20 μm. Scale bars in enlarged images, 2 μm.
Disruption of microtubules attenuates membrane tubulation caused by BAR domains
We next asked whether the membrane tubulation generated by the recruitment of BAR domains to the PM is dependent on microtubules. To this end, we treated cells with nocodazole to disrupt microtubules (Fig 3A–D). We confirmed that nocodazole treatment did not affect the flippase activity of ATP10A (Fig EV2D). Nocodazole treatment reduced the formation of tubular membrane structures by PM‐recruited N‐BAR domain (Fig 3A, e–f′, and E). In addition, membrane tubules generated by PM‐recruited ΔN‐BAR or F‐BAR domain in ATP10A‐expressing cells were also reduced by treatment with nocodazole (Fig 3C and D, e–f′, and F and G). Therefore, the membrane tubulation by the BAR domains was in a manner dependent on microtubules. Although cell populations containing long tubular structures were reduced upon nocodazole treatment (Fig 3E–G), very short tubules were observed (Fig 3A and C, e″ and f″), suggesting the possibility that elongation of membrane tubules requires the integrity of microtubules.
Figure 3. Disruption of microtubules reduced tubular structures caused by PM‐recruited BAR domains.
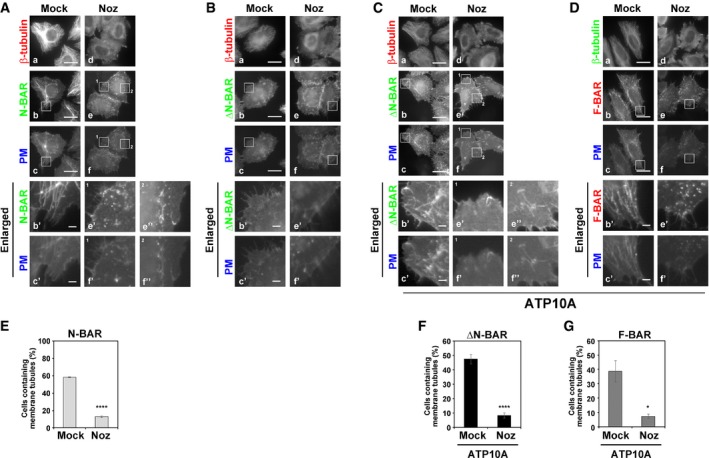
-
A–G(A, B, E) HeLa cells were transiently co‐transfected with expression vectors for Lyn‐TagBFP2‐FRB (PM) and EGFP‐FKBP‐N‐BAR (N‐BAR), or EGFP‐FKBP‐ΔN‐BAR (ΔN‐BAR). (C, D, F, G) HeLa cells stably expressing HA‐tagged ATP10A were transiently co‐transfected with expression vectors for Lyn‐TagBFP2‐FRB (PM) and EGFP‐FKBP‐ΔN‐BAR (ΔN‐BAR), or mCherry‐FKBP‐F‐BAR (F‐BAR). (A–G) Transfected cells were pretreated with vehicle alone (Mock) or nocodazole (Noz). The cells were further treated with vehicle alone or nocodazole in the presence of rapamycin. Cells were fixed, permeabilized, and stained with antibody against β‐tubulin followed by Alexa Fluor 555‐ or Alexa Fluor 488‐conjugated anti‐mouse secondary antibody. Panels of b′, c′, e′, e″, f′, and f″ are enlarged images of insets in b, c, e, and f. Scale bars, 20 μm. Scale bars in enlarged images, 2 μm. (E–G) Cells containing membrane tubules were counted [429–492 cells (E), 397–479 cells (F), and 404–436 cells (G) in each sample]. Graphs display means ± SD from three independent experiments. *P < 0.05; ****P < 0.001; Welch's t‐test. The experiments of (G) were performed together with Fig 5F, and thus, the graph of Mock is equivalent to that of Fig 5F.
An increase in PM tension prevents the generation of membrane tubules by BAR domains
We next investigated whether inward bending of the PM is a prerequisite for membrane tubulation driven by PM‐recruited BAR domains. To this end, we examined whether an increase in PM tension inhibited BAR domain‐driven membrane tubulation by exposing cells to hypotonic medium (Figs 4 and 5). Intriguingly, recruitment of the N‐BAR domain to the PM did not induce membrane tubulation in cells exposed to hypotonic conditions (Fig 4A, e–f′, and E, Movies EV2 and EV8). Cells were exposed to hypotonic medium before or after treatment with rapamycin (Movies EV8 and EV2, respectively), and cells did not generate membrane tubules in either case. Upon exposure to hypotonic conditions, cells swelled acutely (Movies EV2, EV5, and EV8), indicating that PM tension was increased. These results suggest that outward swelling of cells negatively affects membrane curvature toward the cytoplasm. We next investigated whether a decrease in membrane tension triggers membrane tubulation by exposing cells to hypertonic medium. However, hypertonic stress did not significantly affect membrane tubulation driven by the N‐BAR domain (Fig 4B, e–f′, and F) or trigger membrane tubulation driven by the ΔN‐BAR domain (Fig 4D, e–f′, and G). Thus, even in shrunken cells exposed to hypertonic medium, the PM may not bend properly to allow the ΔN‐BAR domain to form membrane tubules.
Figure 4. Hypotonic treatment of HeLa cells prevents membrane tubulation induced by the PM‐recruited N‐BAR domain.
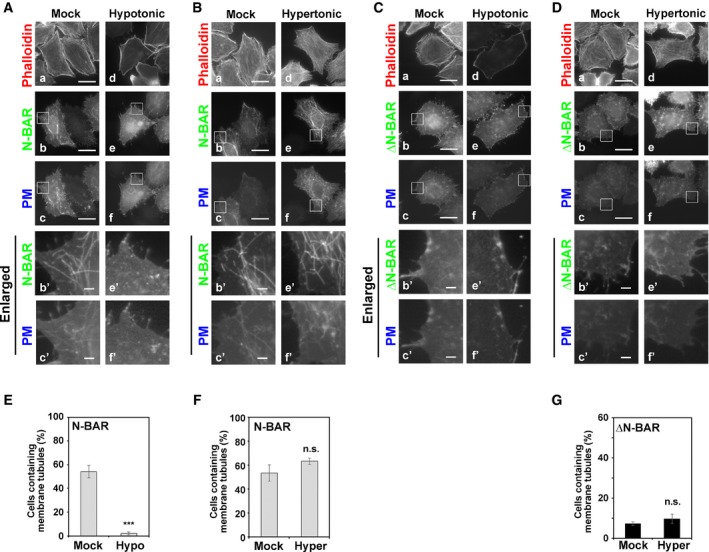
-
A–DTransfected cells were incubated in isotonic medium containing rapamycin (Mock) or exposed to hypotonic or hypertonic medium containing rapamycin. Cells were fixed, permeabilized, and incubated with Alexa Fluor 555‐conjugated phalloidin. Panels b′, c′, e′, and f′ show enlarged images of the insets in b, c, e, and f, respectively. Scale bars, 20 μm. Scale bars in enlarged images, 2 μm.
-
E–GCells containing membrane tubules were counted [416–577 cells (N‐BAR) and 402–467 cells (ΔN‐BAR) per sample]. Graphs display means ± SD of three independent experiments. ***P < 0.005; Welch's t‐test.
Figure 5. Hypotonic treatment of ATP10A‐expressing cells prevents membrane tubulation induced by PM‐recruited ΔN‐BAR and F‐BAR domains.
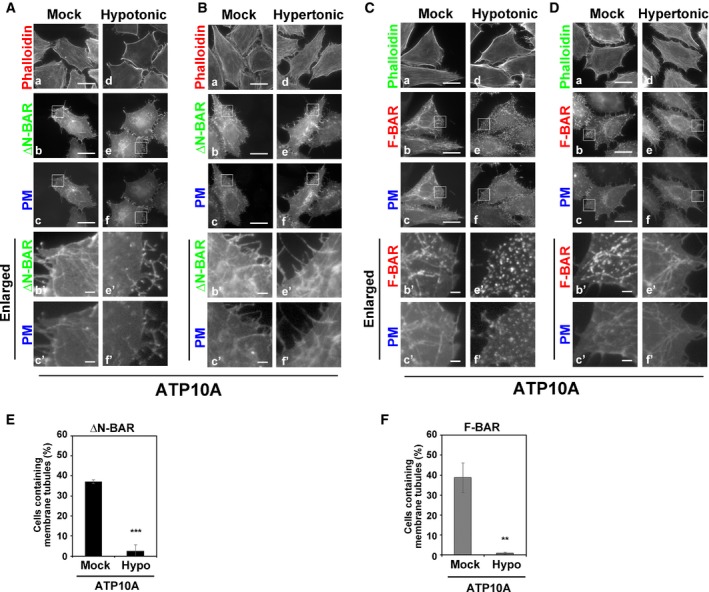
-
A–FHeLa cells stably expressing C‐terminally HA‐tagged ATP10A were transiently co‐transfected with expression vectors for Lyn‐TagBFP2‐FRB (PM) and EGFP‐FKBP‐ΔN‐BAR (ΔN‐BAR; A, B, E) or mCherry‐FKBP‐F‐BAR (F‐BAR; C, D, F). Transfected cells were incubated in isotonic medium containing rapamycin (Mock) or exposed to hypotonic or hypertonic medium containing rapamycin. Cells were fixed, permeabilized, and incubated with Alexa Fluor 555‐conjugated (A, B) or Alexa Fluor 488‐conjugated (C, D) phalloidin. Panels b′, c′, e′, and f′ show enlarged images of the insets in b, c, e, and f, respectively. Scale bars, 20 μm. Scale bars in enlarged images, 2 μm. (E, F) Cells containing membrane tubules were counted [400–452 cells (ΔN‐BAR) and 404–436 cells (F‐BAR) per sample]. Graphs display means ± SD of three independent experiments. **P < 0.01; ***P < 0.005; Welch's t‐test.
Exposure to hypotonic medium also abrogated membrane tubulation induced by the PM‐recruited ΔN‐BAR and F‐BAR domains in ATP10A‐expressing cells (Fig 5A and C, e–f′, and E and F, Movie EV5). Membrane tubules induced by the PM‐recruited ΔN‐BAR domain were readily disappeared upon exposure to hypotonic medium (Movie EV5), suggesting that tubular structures are highly dynamic and susceptible to a change in membrane tension. Thus, outward swelling of cells prevents inward PM bending triggered by the flippase activity of ATP10A and by insertion of the amphipathic helix of the N‐BAR domain. Notably, the PC‐flippase activity of ATP10A was abrogated under hypotonic conditions (Fig EV2D). Therefore, we cannot exclude the possibility that ablation of membrane tubules upon hypotonic stress is associated with the lack of flippase activities. However, we think that the disappearance of membrane tubules under hypotonic condition is due to the increase in membrane tension which prevents inward PM bending, because the N‐BAR domain did not generate membrane tubules (Fig 4A). Exposure to hypertonic medium did not affect membrane tubulation driven by the ΔN‐BAR or F‐BAR domain in ATP10A‐expressing cells (Fig 5B and D, e–f′). This result corresponds to the membrane tubulation driven by the N‐BAR domain (Fig 4B and F). Membrane tubulation was not observed in ATP10A(E203Q)‐expressing cells under any condition (Fig EV3).
Figure EV3. PM‐recruited ΔN‐BAR and F‐BAR domains do not induce membrane tubulation in ATP10A(E203Q)‐expressing cells.
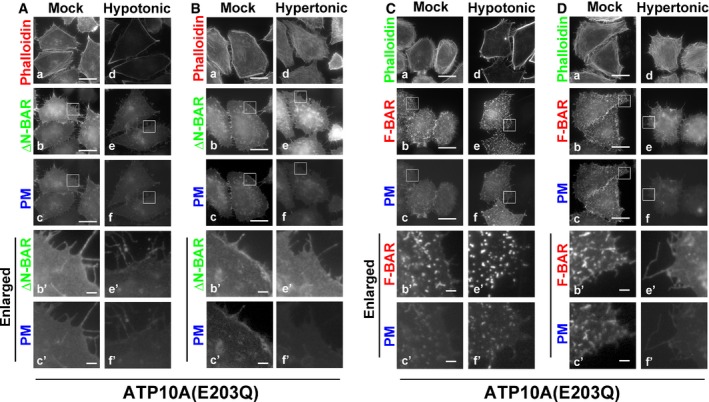
-
A–DHeLa cells stably expressing C‐terminally HA‐tagged ATP10A(E203Q) were transiently co‐transfected with expression vectors for Lyn‐TagBFP2‐FRB (PM) and EGFP‐FKBP‐ΔN‐BAR (ΔN‐BAR; A, B) or mCherry‐FKBP‐F‐BAR (F‐BAR; C, D). Transfected cells were incubated in isotonic medium containing rapamycin (Mock) or exposed to hypotonic or hypertonic medium containing rapamycin. Cells were fixed, permeabilized, and incubated with Alexa Fluor 555‐ or 488‐conjugated phalloidin. Scale bars, 20 μm. Scale bars in enlarged images, 2 μm.
Depletion of ATP10A inhibits membrane tubulation induced by the ΔN‐BAR and F‐BAR domains in cells stably expressing exogenous ATP10A
To confirm that the flippase activity of ATP10A is indispensable for deformation of the PM, we knocked down ATP10A via RNAi in cells stably expressing this flippase. Efficient knockdown of ATP10A was confirmed by immunoblot analysis (Fig EV4B), measurement of PC‐flippase activity (Fig EV4C), and immunofluorescence analysis (Fig 6A, C and E, k and l). Membrane tubulation driven by recruitment of the ΔN‐BAR and F‐BAR domains to the PM was significantly decreased in ATP10A‐depleted cells (Fig 6A and C, h, h′, j, and j′, and B and D). These results revealed that membrane tubulation induced by the ΔN‐BAR and F‐BAR domains in ATP10A‐expressing cells is due to increased PC‐flippase activity at the PM. Membrane tubulation induced by the N‐BAR domain was not decreased in ATP10A‐depleted cells (Fig 6E, h, h′, j, and j′, and F), probably due to its high membrane‐deforming activity and/or a modest level of residual ATP10A protein (Fig EV4B).
Figure 6. Depletion of ATP10A abrogates membrane tubulation induced by ΔN‐BAR and F‐BAR domains in ATP10A‐expressing cells.
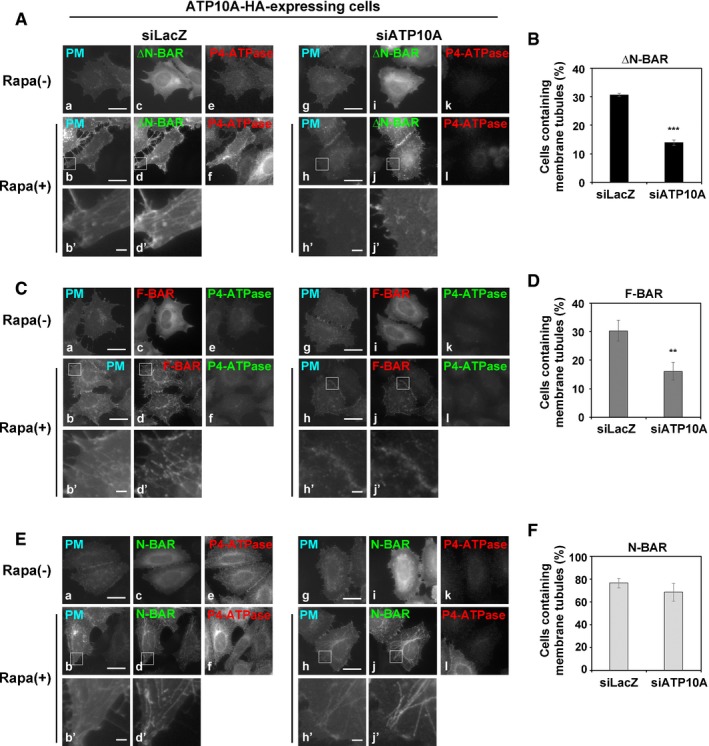
-
A–FHeLa cells stably expressing HA‐tagged ATP10A were transfected with a pool of siRNAs against LacZ (as a control) or ATP10A. After 96 h, cells were transiently co‐transfected with expression vectors for Lyn‐TagBFP2‐FRB (PM) and EGFP‐FKBP‐N‐BAR (N‐BAR), EGFP‐FKBP‐ΔN‐BAR (ΔN‐BAR), or mCherry‐FKBP‐F‐BAR (F‐BAR). Cells were treated with vehicle alone [Rapa(−)] or 200 nM rapamycin [Rapa(+)] for 15 min and fixed. Fixed cells were stained with an anti‐HA primary antibody followed by a Cy3‐conjugated (A, E) or Alexa Fluor 488‐conjugated (C) anti‐rat secondary antibody. Scale bars, 20 μm. Scale bars in enlarged images, 2 μm. (B, D, F) Cells containing membrane tubules were counted [410–535 cells (ΔN‐BAR), 389–464 cells (F‐BAR), and 331–645 cells (N‐BAR) per sample]. Graphs display means ± SD of three independent experiments. **P < 0.01; ***P < 0.005; Welch's t‐test.
Enhanced PC‐flipping activity increases endocytosis of β1‐integrin
Since incubation with phospholipids, but not lysophospholipids, enhances endocytosis in K562 cells (Farge et al, 1999), it was hypothesized that phospholipid treatment increased the concentration of phospholipids in the inner leaflet of the PM and endocytosis was subsequently enhanced. We examined whether increased flippase activity upon ATP10A expression facilitates endocytosis. To this end, β1‐integrin internalization was examined by following an extracellularly applied anti‐β1‐integrin antibody (Fig 7). Cells were incubated with an anti‐β1‐integrin antibody at 4°C for 1 h, washed with ice‐cold PBS to remove unbound antibodies, and incubated at 37°C for the indicated durations to allow the internalization of β1‐integrin (Fig 7). Cells were then washed with acidic solution to remove residual antibodies on the PM. The fluorescence intensity of intracellular β1‐integrin was estimated in cells expressing ATP10A and ATP10A(E203Q) and parental cells. Internalization of β1‐integrin was significantly increased at 15 and 30 min in cells stably expressing ATP10A, but not in those stably expressing ATP10A(E203Q) (Fig 7A and B). In addition, the internalization was not altered in cells stably expressing ATP11A as compared to control cells (Fig 7B). As we discussed above, the level of PS/PE is limited in the exoplasmic leaflet (Op den Kamp, 1979; Murate et al, 2015); therefore, exogenous expression of ATP11A may not trigger the phospholipids imbalance and membrane deformation. Therefore, enhanced inward bending of the PM induced by ATP10A expression facilitates the internalization of β1‐integrin, which may delay cell adhesion and cell spreading on extracellular matrix (Naito et al, 2015; Miyano et al, 2016). We also recognized that ATP1A1 (Na/K pump), which mainly localizes to the PM, appeared more frequently in intracellular puncta in cells expressing ATP10A than in control cells (Fig EV5A). Counting of cells in which ATP1A1 localized to the PM, and the PM and intracellular puncta revealed that the population of intracellular ATP1A1 was substantially increased in cells expressing ATP10A but not ATP10A(E203Q) (Fig EV5B) suggesting that ATP10A expression increased the internalization of ATP1A1.
Figure 7. Expression of ATP10A increases the internalization rate of β1‐integrin.
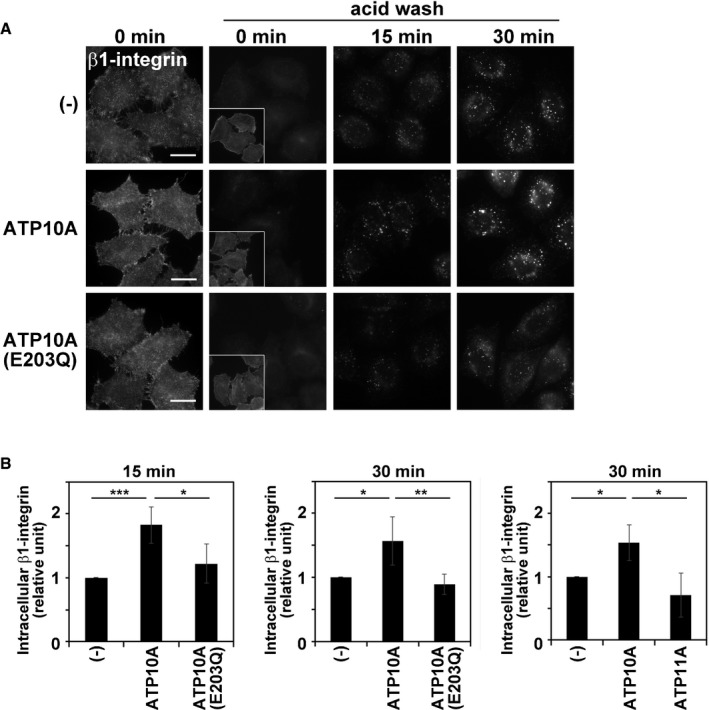
- Representative images are displayed. Insets show phalloidin staining. Scale bars, 20 μm.
- Fluorescence intensities of internalized β1‐integrin were quantitated using MetaMorph software. A total of 115–224 cells were analyzed per sample. Graphs display means ± SD of four independent experiments. *P < 0.05; **P < 0.01; ***P < 0.005; a one‐way ANOVA was performed to assess variance.
Figure EV5. ATP1A1 localization in ATP10A‐expressing cells.
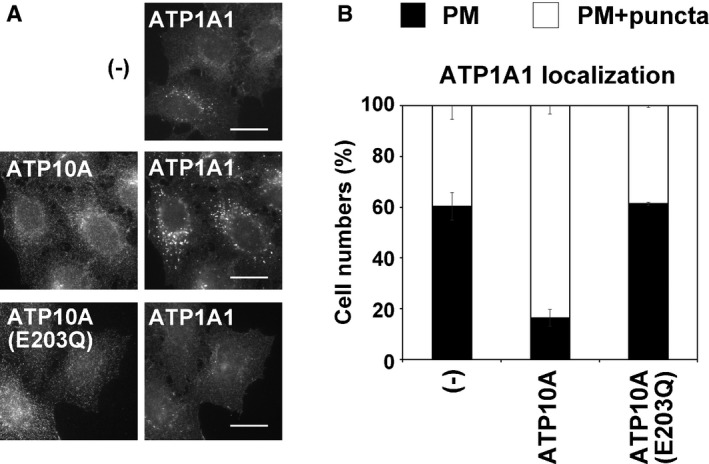
- HeLa cells stably expressing C‐terminally HA‐tagged ATP10A and ATP10A(E203Q) were fixed and stained for an anti‐HA and anti‐ATP1A1 primary antibodies, followed by a Cy3‐conjugated anti‐rat and Alexa Fluor 488‐conjugated anti‐rabbit secondary antibodies. Scale bars, 20 μm.
- Cells in which ATP1A1 localized to the plasma membrane (black) or to the plasma membrane and intracellular puncta (white) were counted: Counts were normalized against the total number of counted cells (562–644 cells). Graphs display means of two independent experiments, and error bars show minimum and maximum values.
Then, we asked whether depletion of endogenous ATP10A affects the β1‐integrin endocytosis. To this end, we depleted ATP10A by CRISPR/Cas9 system in MDA‐MB‐231 cells which express endogenous ATP10A (Figs EV4A and EV6A and B) and examined the β1‐integrin internalization in the knockout cells. As shown in Fig EV6, although knockout of endogenous ATP10A tended to decrease the endocytosis of β1‐integrin, the decrease was not statistically significant (Fig EV6C). One possibility would be a functional redundancy of other PC‐flippases because MDA‐MB‐231 cells express PC‐flippases such as ATP8B1 and ATP8B2 (Takatsu et al, 2014; Fig EV6D).
Figure EV6. Internalization of β1‐integrin in ATP10A‐knockout (KO) cells.
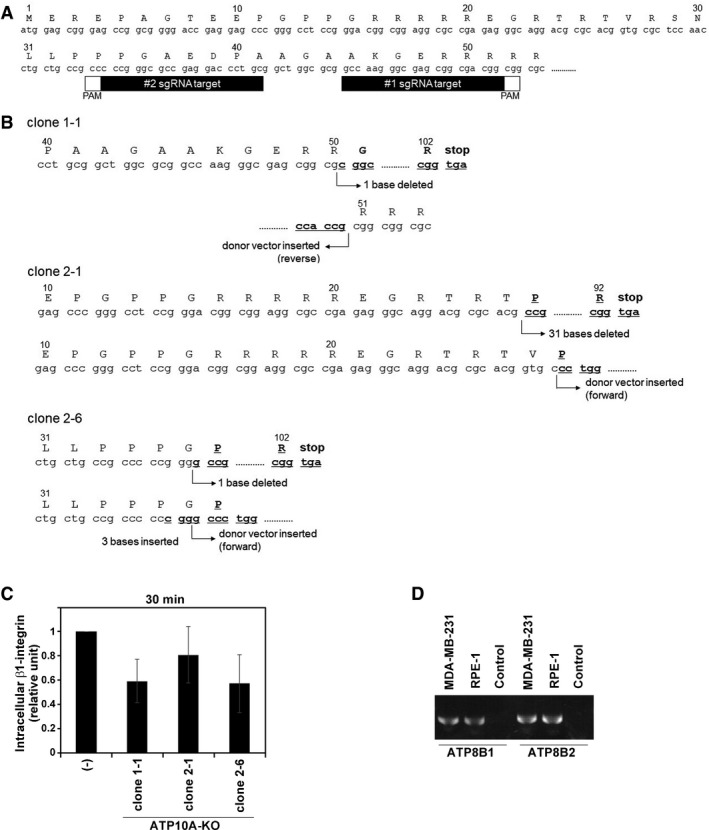
- Target sequences of ATP10A gene are shown.
- In clone 1–1, clone 2–1, and clone 2–6, ATP10A carries biallelic modifications: insertion of a base and donor vector (reverse integration), deletion of 31 bases and insertion of donor vector (forward integration), and deletion of a base and insertion of donor vector (forward integration), respectively.
- Parental MDA‐MB‐231 cells (−) and ATP10A‐KO cell lines were incubated with an anti‐β1‐integrin antibody at 4°C for 30 min, washed with ice‐cold PBS to remove unbound antibodies, and incubated at 37°C for 30 min to allow internalization of β1‐integrin. Cells were washed with acidic solution to remove residual antibodies on the PM prior to fixation. Fixed cells were permeabilized and incubated with a Cy3‐conjugated anti‐rat secondary antibody. Fluorescence intensities of internalized β1‐integrin were quantitated using MetaMorph software. A total of 70–174 cells were analyzed per sample. Graphs display means ± SD of three independent experiments. A one‐way ANOVA was performed to assess variance.
- RT–PCR was performed using total RNA isolated from the indicated cell lines. RNA was omitted in control reactions.
Taken together, these results strongly suggest that enhancement of PC flipping in ATP10A‐expressing cells induces an imbalance in the level of lipids between the leaflets of the bilayer and increases inward PM bending, driving membrane curvature and allowing membrane tubulation by BAR domains, even those that lack the N‐terminal amphipathic helix. Given that an increase in PM tension following hypotonic treatment suppressed membrane tubulation driven by the N‐BAR domain in parental HeLa cells, as well as by the ΔN‐BAR and F‐BAR domains in ATP10A‐expressing cells, membrane curvature induced by the N‐terminal amphipathic helix of N‐BAR or enhanced PC‐flippase activity (Fig 8A and B) is a prerequisite for membrane tubulation. PC is abundant in the outer leaflet of the PM, therefore, enhanced PC flipping by ATP10A most likely causes a lipid imbalance. On the other hand, PS/PE is confined to the inner leaflet of the PM, meaning that expression of ATP11A may not generate a lipid imbalance to allow membrane deformation. Notably, phospholipid flipping at the PM was generally suppressed in hypotonic conditions but not in hypertonic conditions (Fig EV2D). This suggests that an acute increase in membrane tension inhibits not only membrane bending but also transbilayer lipid translocation.
In yeast, inactivation of Drs2p, a Golgi‐localized PS‐flippase, inhibits recruitment of Arf‐GTPase‐activating protein (Gcs1p) to Golgi and endosomal membranes. Gcs1p contains an amphipathic, α‐helical ArfGAP lipid packing sensor (ALPS) motif, which plays a critical role in recruitment of Gcs1p to membranes by sensing membrane curvature. Therefore, the PS‐flippase activity of Drs2p may be required to generate membrane curvature, which allows the recruitment of Gcs1p to membranes (Xu et al, 2013). Indeed, yeast cells depleted of Drs2p accumulated aberrant membrane structures (Chen et al, 1999). There are other explanations for these observations, such as an electrostatic interaction between Gcs1p and PS besides curvature sensing of Gcs1p. While our study provides evidence for an effect of transbilayer lipid mass changes on membrane deformation and electrostatic effects can be excluded because PC is a neutral phospholipid. In addition, phospholipid flipping itself, regardless of which phospholipid is flipped, seems to be required for vesicle formation in yeast (Takeda et al, 2014). Together with our findings, phospholipid‐flipping activities of P4‐ATPases are able to induce membrane curvature by generating an imbalance in the level of lipids between the two leaflets of the PM and other cellular compartments, regardless of the flipped phospholipid species. The data presented herein provide the important experimental evidence that phospholipid‐flippase activity can deform biological membranes. This raises questions when, where, and how flippases can act. We recently have revealed the signal‐dependent regulation mechanism of ATP11C, a PS‐flippase (Takatsu et al, 2017). Elucidation of regulation mechanisms of P4‐ATPases including PC‐flippases enables understanding of how P4‐ATPases play roles in many cellular processes involving membrane deformation, including membrane trafficking and cell migration.
Materials and Methods
Plasmids
Constructs for C‐terminally HA‐tagged P4‐ATPases were generated as described previously (Takatsu et al, 2011, 2014). Constructs for FKBP‐conjugated fluorescent N‐BAR (human amphiphysin 1, AA 1–248), ΔN‐BAR (AA 26–248), F‐BAR (human FBP17, AA 1–300), and FRB‐conjugated Lyn (AA 1–11) were obtained as described previously (Komatsu et al, 2010; Suarez et al, 2014). DNA fragments of Lyn‐mCherry‐FRB were amplified by PCR and inserted into pcDNA3 using the EcoRI and XhoI sites. Thereafter, DNA fragments encoding TagBFP2 (Evrogen) and TagRFP (a kind gift from Hideki Shibata, Nagoya University; Shibata et al, 2010) were amplified and inserted in place of mCherry cDNA at the AgeI and BsrGI sites using an In‐Fusion HD cloning kit (Clontech). To construct Lifeact‐EGFP and Lifeact‐mCherry, sense and antisense oligonucleotides corresponding to the first 17 AA of Abp140 (Riedl et al, 2008) were synthesized, annealed, and inserted into pEGFP‐N1 (Invitrogen) and pcDNA3‐mCherry‐N (a kind gift from Roger Tsien, University of California).
Cell culture, siRNA‐mediated knockdown, and transfection
HeLa cells were cultured in minimal essential medium (MEM) supplemented with 10% heat‐inactivated fetal bovine serum (FBS) at 37°C in 5% CO2. Cells stably expressing HA‐tagged P4‐ATPases were generated as described previously (Takatsu et al, 2014; Naito et al, 2015). HeLa cells were transfected with plasmids carrying each FKBP‐fused fluorescent BAR domain and FRB‐fused fluorescent Lyn using X‐tremeGENE9 (Roche Applied Science).
siRNAs were prepared as described previously (Naito et al, 2015). In brief, pools of siRNAs targeting the coding region of human ATP10A (nucleotides 655–1,399 of ATP10A mRNA; the A nucleotide of the ATG initiation codon was defined as nucleotide 1) were prepared using the T7 RiboMAX Express RNAi System (Promega) and PowerCut Dicer (Fynnzymes). Cells were transfected with siRNAs using Lipofectamine 2000 (Invitrogen) and incubated for 24 h. Transfected cells were seeded onto culture dishes. After 24 h, cells were transfected with the siRNAs again and incubated for an additional 24 h. Finally, transfected cells were transferred to new culture dishes containing coverslips, incubated for an additional 48 h, and processed for immunoblot and immunofluorescence analyses.
Antibodies and reagents
Antibodies were obtained from the following sources: monoclonal mouse anti‐β‐tubulin (KMX‐1; Millipore); monoclonal mouse anti‐EEA1 (clone 14), anti‐Lamp‐1 (H4A3), anti‐SNX1 (clone 51), and anti‐GM130 (clone 35; BD Biosciences); monoclonal rat anti‐HA (3F10; Roche Applied Science) and anti‐β1‐integrin (Mab13; BD Biosciences); monoclonal rabbit anti‐ATP1A1 (EP1845Y; Abcam); Alexa Fluor‐conjugated secondary antibodies (Molecular Probes); and Cy3‐ and horseradish peroxidase‐conjugated secondary antibodies (Jackson ImmunoResearch Laboratories). Alexa Fluor 488‐ and 555‐conjugated phalloidin was purchased from Molecular Probes. The NBD‐labeled phospholipids (Avanti Polar Lipids) used in this study were NBD‐PS (1‐oleyl‐2‐[6‐[(7‐nitro‐2‐1,3‐benzoxadiazol‐4‐yl)amino]hexanoyl]‐sn‐glycero‐3‐phosphoserine), NBD‐PE (1‐oleyl‐2‐[6‐[(7‐nitro‐2‐1,3‐benzoxadiazol‐4‐yl)amino]hexanoyl]‐sn‐glycero‐3‐phosphoethanolamine), and NBD‐PC (1‐oleyl‐2‐[6‐[(7‐nitro‐2‐1,3‐benzoxadiazol‐4‐yl)amino]hexanoyl]‐sn‐glycero‐3‐phosphocholine. Nocodazole, rapamycin, and fibronectin were obtained from Sigma‐Aldrich and LC Laboratories, respectively.
Immunofluorescence and live‐cell imaging
Cells grown on coverslips were treated with 200 nM rapamycin for 15 min, 16.7 μM of nocodazole for 60 min, hypotonic medium (10% MEM and 90% H2O) for 15 min, or hypertonic medium (MEM containing 200 mM sucrose) for 20 min. Time schedule for the treatment(s) is shown in Table EV1. Treated cells were fixed with 3% paraformaldehyde in PBS at 37°C for 15 min, permeabilized with 0.1% Triton X‐100 at room temperature for 5 min, and incubated in PBS containing 10% FBS at room temperature for 30 min. Cells exposed to hypotonic or hypertonic medium were fixed with 3.7% formaldehyde prepared in 0.1× PBS or 3.7% formaldehyde prepared in 1× PBS containing 200 mM sucrose, respectively. Fixed cells were incubated with primary antibodies at room temperature for 1 h, washed three times with PBS, and incubated with secondary antibodies at room temperature for 1 h. Coverslips were placed onto Mowiol, and cells were observed using an Axiovert 200M microscope (Carl Zeiss). To obtain semi‐quantitative data regarding membrane tubulation, cells containing more than two tubular membrane structures longer than 20 μm, as shown by the epifluorescent signal of each FKBP‐BAR domain, were counted. Statistical significance was determined by Welch's t‐test.
For time‐lapse recording, cells were placed on a microscope stage prewarmed to 37°C, and merged differential interference and fluorescence images were obtained using an A1R‐MP confocal laser‐scanning microscope (Nikon). Images were acquired every 16.0 sec, and movies play at a rate of 12.5 frames per second.
Immunoblotting
Cells were lysed in lysis buffer (20 mM HEPES‐KOH [pH 7.4], 150 mM NaCl, 1 mM EDTA, and 1% NP‐40) containing a protease inhibitor cocktail (Nacalai Tesque) for 20 min on ice. Cell lysates were centrifuged at 16,100 g for 15 min at 4°C in a microcentrifuge. Proteins (30 μg) were separated by SDS–PAGE and electroblotted onto an Immobilon‐P transfer membrane (Millipore EMD). The membrane was blocked with 5% skimmed milk and sequentially incubated with the indicated primary and horseradish peroxidase‐conjugated secondary antibodies. Signals were detected using a Chemi‐Lumi One L or Chemi‐Lumi One Super kit (Nacalai Tesque).
Flippase assay
Incorporation of NBD‐labeled phospholipids was analyzed by flow cytometry as described previously (Takatsu et al, 2014). In brief, HeLa cells were detached from dishes in PBS containing 5 mM EDTA and harvested by centrifugation. Thereafter, cells (1 × 10⁶ cells per sample) were washed and equilibrated at 15°C for 15 min in 500 μl Hank's balanced salt solution (pH 7.4) containing 1 g/l glucose (HBSS‐glucose). An equal volume of 2 μM NBD‐labeled phospholipid prepared in HBSS‐glucose was added to the cell suspension and incubated at 15°C. At each time point, 200 μl of the cell suspension was collected and mixed with 200 μl of ice‐cold HBSS‐glucose containing 5% fatty acid‐free bovine serum albumin (BSA, Wako Pure Chemical) to extract NBD‐labeled lipids incorporated into the exoplasmic leaflet of the PM as well as unincorporated NBD‐labeled lipids. Next, 10,000 cells were analyzed on a FACSCalibur instrument (BD Biosciences) to measure the fluorescence of NBD‐labeled lipids that had translocated into the cytoplasmic leaflet of the PM. Mean fluorescence intensities per cell were calculated. Propidium iodide‐positive cells (i.e., dead cells) were excluded from the analysis.
HeLa cells in 12‐well plates (5 × 10⁵ cells/well) were treated with rapamycin or nocodazole, or were exposed to hypotonic or hypertonic conditions in 500 μl of 0.1× HBSS‐glucose or 500 μl HBSS‐glucose containing 200 mM sucrose, respectively, at 37°C for the indicated durations. Cells were equilibrated at 15°C for 15 min in the same buffer and then treated with 500 μl HBSS‐glucose containing 2 μM NBD‐labeled phospholipid at 15°C for 15 min. Thereafter, cells were detached from the plate and suspended in ice‐cold PBS containing 2.5% fatty acid‐free BSA, 5 mM EDTA, and 0.04% propidium iodide. Next, 10,000 cells were analyzed on a FACSCalibur instrument. Mean fluorescence intensities per cell were calculated. Propidium iodide‐positive cells (i.e., dead cells) were excluded from the analysis.
Uptake of anti‐β1‐integrin antibody
Cellular uptake of an anti‐β1‐integrin antibody was assayed using a previously described method with some modifications (Shin et al, 2004; Nakai et al, 2013; Tanaka et al, 2016). HeLa cells stably expressing ATP10A or ATP10A(E203Q) or ATP10A‐knockout MDA‐MB‐231 cells were incubated with an anti‐β1‐integrin antibody (Mab13) at 4°C for 1 h (HeLa cells) or 30 min (MDA‐MB‐231 cells), washed with ice‐cold PBS, and incubated in medium lacking the antibody at 37°C for the indicated durations. Cells were washed with acidic solution (0.5% acetic acid and 0.5 M NaCl, pH 3.0) to remove residual antibodies from the PM prior to fixation. In case of MDA‐MB‐231 cells, fibronectin‐coated cover glass was used to prevent detachment of cells from the cover glass upon temperature shift. Fixed cells were processed for immunofluorescence analysis as described above and imaged using an Axiovert 200 MAT microscope (Carl Zeiss). The fluorescence intensity of intracellular β1‐integrin was quantitated using MetaMorph software (Molecular Devices). Variance was assessed by a one‐way ANOVA, and comparisons were made by Tukey's post hoc analysis.
RT–PCR
Total RNA was isolated from HeLa, MDA‐MB‐231, RPE‐1, and HEK293T cells using an RNeasy Mini Kit (Qiagen). RT–PCR analysis was performed using a SuperScript III One‐Step RT–PCR system (Invitrogen) and the following primer pairs: human CDC50A: sense, GAAAAAGAAAGGTATTGCTTGGTG, antisense, GTAATGTCAGCTG TATTACTACTG; human ATP10A: sense, CACAATGTTCGTGGGCCTCC, antisense, AAGGACACTGAAGCCACACG; human ATP8B1: sense, GTGGCCTCCACCAACCGGG, antisense, CACCTCTATTCCTCTGGTTTTCC; human ATP8B2: sense, GGGAGAGAGGCCTGAACCTG, antisense, GGAGTCCAGGATGGCCAGCAG.
Establishment of KO cell lines by the CRISPR/Cas9 system
To edit the ATP10A gene, we used the CRISPR/Cas9 system described previously (Tanaka et al, 2016; Katoh et al, 2017). Two single guide RNA (sgRNA) sequences (#1 and #2, Fig EV6A) targeting the human ATP10A gene were designed using the CRISPR Design Tool from the Zhang Lab (http://crispr.mit.edu/). We used a donor plasmid of pDonor‐tBFP‐NLS‐Neo (Addgene #80766; Tanaka et al, 2016) and PX459 (Addgene #48139). Two plasmids (plasmid containing ATP10A target sequences and the Cas9 gene, and a donor plasmid) were introduced into MDA‐MB‐231 cells by transfection using the X‐tremeGENE9 DNA Transfection Reagent (Roche). Transfected cells were selected in medium containing G418 (1–4 mg/ml), and clones were isolated on the basis of expression of the reporter gene Tag‐BFP. To confirm editing of ATP10A, genomic DNA was extracted from individual clones and subjected to PCR using KOD FX Neo DNA polymerase (TOYOBO). Three primer sets used to amplify ATP10A lacking the donor vector integration (S1, 5′‐CGAGTGATGATAACCTAAGAGG‐3′, and AS1, 5′‐GTTGATCTTGT GGTCGGAGC‐3′), ATP10A with donor vector integrated in the forward orientation (donor vector‐primer, 5′‐GTTGTCCACGGTGCCCTCCATGTAC‐3′ and S1), and ATP10A with donor vector integrated in the reverse orientation (donor vector‐primer and AS1). Among clones with donor vector integration in either orientation, the knockout was confirmed by direct sequencing of the amplified PCR product, ATP10A without donor vector integration, using a specific sequencing primer (S1 and/or donor vector‐primer). Three clones (1–1, 2–1, and 2–6) carrying biallelic changes that resulted in donor vector integration in forward or reverse and frame‐shifting indels were used in this study.
Author contributions
H‐WS conceived the study and prepared the manuscript. NT, TN, and HT performed experiments. NT, HT, TN, KN, and H‐WS analyzed the data. All authors discussed the results and commented on the manuscript.
Conflict of interest
The authors declare that they have no conflict of interest.
Supporting information
Expanded View Figures PDF
Table EV1
Movie EV1
Movie EV2
Movie EV3
Movie EV4
Movie EV5
Movie EV6
Movie EV7
Movie EV8
Movie EV9
Movie EV10
Review Process File
Acknowledgements
We thank Hideki Shibata (Nagoya University) and Roger Tsien (University of California) for kindly providing plasmids as well as Zhiqiu Man and Yohei Katoh (Kyoto University) for technical support. This work was supported by JSPS KAKENHI (Grant Numbers JP15H01320, JP16H00764, and JP17H03655 to H.‐W.S.), the Takeda Science Foundation (to H.‐W.S.). T.N. was supported by a JSPS Research Fellowship for Young Scientists.
The EMBO Journal (2018) 37: e97705
References
- Andersen JP, Vestergaard AL, Mikkelsen SA, Mogensen LS, Chalat M, Molday RS (2016) P4‐ATPases as phospholipid flippases‐structure, function, and enigmas. Front Physiol 7: 275 [DOI] [PMC free article] [PubMed] [Google Scholar]
- Bhatia VK, Madsen KL, Bolinger PY, Kunding A, Hedegard P, Gether U, Stamou D (2009) Amphipathic motifs in BAR domains are essential for membrane curvature sensing. EMBO J 28: 3303–3314 [DOI] [PMC free article] [PubMed] [Google Scholar]
- Campelo F, McMahon HT, Kozlov MM (2008) The hydrophobic insertion mechanism of membrane curvature generation by proteins. Biophys J 95: 2325–2339 [DOI] [PMC free article] [PubMed] [Google Scholar]
- Chen CY, Ingram MF, Rosal PH, Graham TR (1999) Role for Drs2p, a P‐type ATPase and potential aminophospholipid translocase, in yeast late Golgi function. J Cell Biol 147: 1223–1236 [DOI] [PMC free article] [PubMed] [Google Scholar]
- Daleke DL, Huestis WH (1989) Erythrocyte morphology reflects the transbilayer distribution of incorporated phospholipids. J Cell Biol 108: 1375–1385 [DOI] [PMC free article] [PubMed] [Google Scholar]
- Devaux PF (1991) Static and dynamic lipid asymmetry in cell membranes. Biochemistry 30: 1163–1173 [DOI] [PubMed] [Google Scholar]
- Devaux PF, Herrmann A, Ohlwein N, Kozlov MM (2008) How lipid flippases can modulate membrane structure. Biochim Biophys Acta 1778: 1591–1600 [DOI] [PubMed] [Google Scholar]
- Farge E, Ojcius DM, Subtil A, Dautry‐Varsat A (1999) Enhancement of endocytosis due to aminophospholipid transport across the plasma membrane of living cells. Am J Physiol Cell Physiol 276: C725–C733 [DOI] [PubMed] [Google Scholar]
- Frost A, Perera R, Roux A, Spasov K, Destaing O, Egelman EH, De Camilli P, Unger VM (2008) Structural basis of membrane invagination by F‐BAR domains. Cell 132: 807–817 [DOI] [PMC free article] [PubMed] [Google Scholar]
- Frost A, Unger VM, De Camilli P (2009) The BAR domain superfamily: membrane‐molding macromolecules. Cell 137: 191–196 [DOI] [PMC free article] [PubMed] [Google Scholar]
- Gallop JL, Jao CC, Kent HM, Butler PJ, Evans PR, Langen R, McMahon HT (2006) Mechanism of endophilin N‐BAR domain‐mediated membrane curvature. EMBO J 25: 2898–2910 [DOI] [PMC free article] [PubMed] [Google Scholar]
- Gauthier NC, Masters TA, Sheetz MP (2012) Mechanical feedback between membrane tension and dynamics. Trends Cell Biol 22: 527–535 [DOI] [PubMed] [Google Scholar]
- Graham TR (2004) Flippases and vesicle‐mediated protein transport. Trends Cell Biol 14: 670–677 [DOI] [PubMed] [Google Scholar]
- Graham TR, Burd CG (2011) Coordination of Golgi functions by phosphatidylinositol 4‐kinases. Trends Cell Biol 21: 113–121 [DOI] [PMC free article] [PubMed] [Google Scholar]
- Hankins HM, Sere YY, Diab NS, Menon AK, Graham TR (2015) Phosphatidylserine translocation at the yeast trans‐Golgi network regulates protein sorting into exocytic vesicles. Mol Biol Cell 26: 4674–4685 [DOI] [PMC free article] [PubMed] [Google Scholar]
- Henne WM, Kent HM, Ford MG, Hegde BG, Daumke O, Butler PJ, Mittal R, Langen R, Evans PR, McMahon HT (2007) Structure and analysis of FCHo2F‐BAR domain: a dimerizing and membrane recruitment module that effects membrane curvature. Structure 15: 839–852 [DOI] [PubMed] [Google Scholar]
- Itoh T, De Camilli P (2006) BAR, F‐BAR (EFC) and ENTH/ANTH domains in the regulation of membrane‐cytosol interfaces and membrane curvature. Biochim Biophys Acta 1761: 897–912 [DOI] [PubMed] [Google Scholar]
- Kato U, Inadome H, Yamamoto M, Emoto K, Kobayashi T, Umeda M (2013) Role for phospholipid flippase complex of ATP8A1 and CDC50A proteins in cell migration. J Biol Chem 288: 4922–4934 [DOI] [PMC free article] [PubMed] [Google Scholar]
- Katoh Y, Michisaka S, Nozaki S, Funabashi T, Hirano T, Takei R, Nakayama K (2017) Practical method for targeted disruption of cilia‐related genes by using CRISPR/Cas9‐mediated, homology‐independent knock‐in system. Mol Biol Cell 28: 898–906 [DOI] [PMC free article] [PubMed] [Google Scholar]
- Komatsu T, Kukelyansky I, McCaffery JM, Ueno T, Varela LC, Inoue T (2010) Organelle‐specific, rapid induction of molecular activities and membrane tethering. Nat Meth 7: 206–208 [DOI] [PMC free article] [PubMed] [Google Scholar]
- Lee S, Uchida Y, Wang J, Matsudaira T, Nakagawa T, Kishimoto T, Mukai K, Inaba T, Kobayashi T, Molday RS, Taguchi T, Arai H (2015) Transport through recycling endosomes requires EHD1 recruitment by a phosphatidylserine translocase. EMBO J 34: 669–688 [DOI] [PMC free article] [PubMed] [Google Scholar]
- Masters TA, Pontes B, Viasnoff V, Li Y, Gauthier NC (2013) Plasma membrane tension orchestrates membrane trafficking, cytoskeletal remodeling, and biochemical signaling during phagocytosis. Proc Natl Acad Sci USA 110: 11875–11880 [DOI] [PMC free article] [PubMed] [Google Scholar]
- Masuda M, Takeda S, Sone M, Ohki T, Mori H, Kamioka Y, Mochizuki N (2006) Endophilin BAR domain drives membrane curvature by two newly identified structure‐based mechanisms. EMBO J 25: 2889–2897 [DOI] [PMC free article] [PubMed] [Google Scholar]
- McMahon HT, Boucrot E (2015) Membrane curvature at a glance. J Cell Sci 128: 1065–1070 [DOI] [PMC free article] [PubMed] [Google Scholar]
- Miyano R, Matsumoto T, Takatsu H, Nakayama K, Shin H‐W (2016) Alteration of transbilayer phospholipid compositions is involved in cell adhesion, cell spreading, and focal adhesion formation. FEBS Lett 590: 2138–2145 [DOI] [PubMed] [Google Scholar]
- Murate M, Abe M, Kasahara K, Iwabuchi K, Umeda M, Kobayashi T (2015) Transbilayer distribution of lipids at nano scale. J Cell Sci 128: 1627–1638 [DOI] [PubMed] [Google Scholar]
- Muthusamy B‐P, Natarajan P, Zhou X, Graham TR (2009) Linking phospholipid flippases to vesicle‐mediated protein transport. Biochim Biophys Acta 1791: 612–619 [DOI] [PMC free article] [PubMed] [Google Scholar]
- Naito T, Takatsu H, Miyano R, Takada N, Nakayama K, Shin H‐W (2015) Phospholipid flippase ATP10A translocates phosphatidylcholine and is involved in plasma membrane dynamics. J Biol Chem 290: 15004–15017 [DOI] [PMC free article] [PubMed] [Google Scholar]
- Nakai W, Kondo Y, Saitoh A, Naito T, Nakayama K, Shin H‐W (2013) ARF1 and ARF4 regulate recycling endosomal morphology and retrograde transport from endosomes to the Golgi apparatus. Mol Biol Cell 24: 2570–2581 [DOI] [PMC free article] [PubMed] [Google Scholar]
- Op den Kamp JA (1979) Lipid asymmetry in membranes. Annu Rev Biochem 48: 47–71 [DOI] [PubMed] [Google Scholar]
- Panatala R, Hennrich H, Holthuis JC (2015) Inner workings and biological impact of phospholipid flippases. J Cell Sci 128: 2021–2032 [DOI] [PubMed] [Google Scholar]
- Peter BJ, Kent HM, Mills IG, Vallis Y, Butler PJG, Evans PR, McMahon HT (2004) BAR domains as sensors of membrane curvature: the amphiphysin BAR structure. Science 303: 495–499 [DOI] [PubMed] [Google Scholar]
- Poudel KR, Dong Y, Yu H, Su A, Ho T, Liu Y, Schulten K, Bai J (2016) A time course of orchestrated endophilin action in sensing, bending, and stabilizing curved membranes. Mol Biol Cell 27: 2119–2132 [DOI] [PMC free article] [PubMed] [Google Scholar]
- Riedl J, Crevenna AH, Kessenbrock K, Yu JH, Neukirchen D, Bista M, Bradke F, Jenne D, Holak TA, Werb Z, Sixt M, Wedlich‐Soldner R (2008) Lifeact: a versatile marker to visualize F‐actin. Nat Meth 5: 605–607 [DOI] [PMC free article] [PubMed] [Google Scholar]
- Segawa K, Kurata S, Nagata S (2016) Human type IV P‐type ATPases that work as plasma membrane phospholipid flippases and their regulation by caspase and calcium. J Biol Chem 291: 762–772 [DOI] [PMC free article] [PubMed] [Google Scholar]
- Seigneuret M, Devaux PF (1984) ATP‐dependent asymmetric distribution of spin‐labeled phospholipids in the erythrocyte membrane: relation to shape changes. Proc Natl Acad Sci USA 81: 3751–3755 [DOI] [PMC free article] [PubMed] [Google Scholar]
- Sheetz MP, Singer SJ (1974) Biological membranes as bilayer couples. A molecular mechanism of drug‐erythrocyte interactions. Proc Natl Acad Sci USA 71: 4457–4461 [DOI] [PMC free article] [PubMed] [Google Scholar]
- Shi Z, Baumgart T (2015) Membrane tension and peripheral protein density mediate membrane shape transitions. Nat Commun 6: 5974 [DOI] [PMC free article] [PubMed] [Google Scholar]
- Shibata Y, Shemesh T, Prinz WA, Palazzo AF, Kozlov MM, Rapoport TA (2010) Mechanisms determining the morphology of the peripheral ER. Cell 143: 774–788 [DOI] [PMC free article] [PubMed] [Google Scholar]
- Shin H‐W, Morinaga N, Masatoshi N, Nakayama K (2004) BIG2, a guanine nucleotide exchange factor for ADP‐ribosylation factors: its localization to recycling endosomes and implication in the endosome integrity. Mol Biol Cell 15: 5283–5294 [DOI] [PMC free article] [PubMed] [Google Scholar]
- Suarez A, Ueno T, Huebner R, McCaffery JM, Inoue T (2014) Bin/Amphiphysin/Rvs (BAR) family members bend membranes in cells. Sci Rep 4: 4693 [DOI] [PMC free article] [PubMed] [Google Scholar]
- Takatsu H, Baba K, Shima T, Umino H, Kato U, Umeda M, Nakayama K, Shin H‐W (2011) ATP9B, a P4‐ATPase (a putative aminophospholipid translocase), localizes to the trans‐Golgi network in a CDC50 protein‐independent manner. J Biol Chem 286: 38159–38167 [DOI] [PMC free article] [PubMed] [Google Scholar]
- Takatsu H, Tanaka G, Segawa K, Suzuki J, Nagata S, Nakayama K, Shin H‐W (2014) Phospholipid flippase activities and substrate specificities of human type IV P‐type ATPases localized to the plasma membrane. J Biol Chem 289: 33543–33556 [DOI] [PMC free article] [PubMed] [Google Scholar]
- Takatsu H, Takayama M, Naito T, Takada N, Tsumagari K, Ishihama Y, Nakayama K, Shin H‐W (2017) Phospholipid flippase ATP11C is endocytosed and downregulated following Ca2+‐mediated protein kinase C activation. Nat Commun 8: 1423 [DOI] [PMC free article] [PubMed] [Google Scholar]
- Takeda M, Yamagami K, Tanaka K (2014) Role of phosphatidylserine in phospholipid flippase‐mediated vesicle transport in Saccharomyces cerevisiae . Eukaryot Cell 13: 363–375 [DOI] [PMC free article] [PubMed] [Google Scholar]
- Tanaka Y, Ono N, Shima T, Tanaka G, Katoh Y, Nakayama K, Takatsu H, Shin H‐W (2016) The phospholipid flippase ATP9A is required for recycling pathway from endosomes to the plasma membrane. Mol Biol Cell 27: 3883–3893 [DOI] [PMC free article] [PubMed] [Google Scholar]
- Xu P, Baldridge RD, Chi RJ, Burd CG, Graham TR (2013) Phosphatidylserine flipping enhances membrane curvature and negative charge required for vesicular transport. J Cell Biol 202: 875–886 [DOI] [PMC free article] [PubMed] [Google Scholar]
- Yabas M, Coupland LA, Cromer D, Winterberg M, Teoh NC, D'Rozario J, Kirk K, Broer S, Parish CR, Enders A (2014) Mice deficient in the putative phospholipid flippase ATP11C exhibit altered erythrocyte shape, anemia and reduced erythrocyte lifespan. J Biol Chem 289: 19531–19537 [DOI] [PMC free article] [PubMed] [Google Scholar]
- Yin Y, Arkhipov A, Schulten K (2009) Simulations of membrane tubulation by lattices of amphiphysin N‐BAR domains. Structure 17: 882–892 [DOI] [PMC free article] [PubMed] [Google Scholar]
- Zachowski A (1993) Phospholipids in animal eukaryotic membranes: transverse asymmetry and movement. Biochem J 294(Pt 1): 1–14 [DOI] [PMC free article] [PubMed] [Google Scholar]
- Zhu X, Libby RT, de Vries WN, Smith RS, Wright DL, Bronson RT, Seburn KL, John SW (2012) Mutations in a P‐type ATPase gene cause axonal degeneration. PLoS Genet 8: e1002853 [DOI] [PMC free article] [PubMed] [Google Scholar]
Associated Data
This section collects any data citations, data availability statements, or supplementary materials included in this article.
Supplementary Materials
Expanded View Figures PDF
Table EV1
Movie EV1
Movie EV2
Movie EV3
Movie EV4
Movie EV5
Movie EV6
Movie EV7
Movie EV8
Movie EV9
Movie EV10
Review Process File