

Abstract
ATP citrate lyase (ACLY) is a key enzyme of lipogenesis in cells. However, ACLY expression in renal cell carcinoma (RCC) and its association with clinicopathological parameters remain unclear. The present study aimed to evaluate ACLY expression levels in RCC and adjacent normal tissues. This study included 33 patients with clear cell RCC (ccRCC). ACLY protein was assayed using immunohistochemistry and western blotting methods. ACLY mRNA expression was determined by reverse transcription-quantitative polymerase chain reaction. Serum ACLY concentrations were measured using the ELISA. Compared with adjacent normal tissues, significantly higher levels of ACLY protein expression were observed in all of the ccRCC tissues (P<0.05). ACLY protein levels were positively associated with the T stage and nuclear grade of RCC. ACLY immunostaining was located in the cytoplasm and nucleus. ACLY protein levels and ACC1 mRNA expression in RCC tissues were significantly higher compared with that in adjacent normal tissues (P<0.05). There were no significant differences in serum ACLY concentrations between patients with RCC and health controls (P>0.05). Preliminary evaluation of ACLY function showed that ACLY small interfering RNA downregulation inhibited RCC cell proliferation and migration, but promoted RCC cell apoptosis. ACLY may be a novel biomarker for the evaluation of biological aggressiveness and may be a potential target for RCC treatment.
Keywords: renal cell carcinoma, ATP citrate lyase, lipogenesis, metabolic
Introduction
Renal cell carcinoma (RCC) accounts for approximately 3% of adult malignancies (1). The incidence of RCC has increased over the last two decades worldwide and affects all ethnic groups. Although RCC develops slowly, over 200,000 new cases of kidney cancer are diagnosed each year (2). Improved RCC detection has resulted in increased diagnoses and is attributed to medical evaluation for unrelated conditions, routine health checkups and improved methods of detection, such as computed tomography or MRI. Despite increased detection, the prognosis varies widely; about 30% of patients have metastatic disease when diagnosed, and 20–30% of patients have local or distant recurrence five years after radical or partial nephrectomy (3,4). Apart from RCC being highly resistant to chemotherapy, radiation, and immunotherapy, few predictive or prognostic markers have been identified. Identification of an RCC prognostic marker would hasten the development of new therapeutic strategies, and improve patient survival.
Increased rates of glycolysis and lipogenesis occur in most cancers as described by the Warburg effect (5). Some enzymes involved in this increased metabolic rate have changes in both molecular and protein expression levels. Among these enzymes, ATP citrate lyase (ACLY) serves as a physiological shunt between glucose metabolism and fatty acid synthesis (6). ACLY can produce acetyl-CoA, which is a building block for cholesterol, fatty acid synthesis, because ACLY is closely related to energy metabolism, so it is imperative to support cells growth. However, ACLY expression patterns and its association with clinicopathological features of RCC remain unclear. In this study, we investigated the expression levels of ACLY at both RNA and protein level in RCC tissues, and tested the circulating ACLY level, and then determined whether the expression level of ACLY was correlated to clinicopathological parameters of patients with RCC.
Materials and methods
Tissue and serum samples
This study was approved by the ethics board of the Harbin Medical University Cancer Hospital. Informed consent was obtained from all patients before inclusion in this study. Fresh RCC tissue was collected after radical nephrectomy. Adjacent normal kidney tissues 0.5–2 cm from the tumor margin were also collected. All of these tissue samples were stored in liquid nitrogen or were fixed with 1% (v/v) paraformaldehyde. Patient serum samples were collected during admission to the hospital and were stored at −20°C. All patients were classified according to the current WHO classification for RCC and tumors were staged according to the Union for Internationale Cancer Control (UICC) classification. Demographic and clinicopathological data were also obtained.
Cell lines
Human RCC, 786-0 and GRC-1 (7), and normal human kidney cells, HK-2 were purchased from the Cell Bank of the Chinese Academy of Sciences (Shanghai, China). All of the cells were maintained in DMEM (Gibco; Thermo Fisher Scientific, Inc., Waltham, MA, USA) supplemented with 10% FBS (Gibco; Thermo Fisher Scientific, Inc.) and incubated at 37°C in humidified air with 5% CO2.
Immunohistochemistry and tissue section scoring
Fixed specimens were embedded in paraffin and cut making 4 µm thick serial sections for hematoxylin & eosin (H&E) and IHC staining according to standard methods. As for IHC staining, briefly, each section was deparaffinized and rehydrated, and then the sections were autoclaved in 10 mM citrate buffer at 120°C for 2 min for antigen retrieval. Next, the sections were washed three times with phosphate-buffered saline (PBS, pH 7.3), and then soaked in 3% H2O2 for 15 min and subsequently washed three times. After non-specific sites were blocked with 10% normal calf serum, sections were incubated with primary antibody (anti-ACLY antibody at 1:300 dilution, D221957; Sangon Biotech Co. Ltd., Shanghai, China) overnight at 4°C overnight. After antibody incubation, sections were then washed with PBS three times. Two-step incubations with a secondary antibody were performed using biotin-labeled goat anti-rabbit IgG and horseradish peroxidase-labeled avidin (A0277 and A0303; Beyotime Institute of Biotechnology, Haimen, China). DAB counter staining then followed, and the sections were re-stained with hematin (H8070; Beijing Solarbio Science & Technology Co., Ltd., Beijing, China). Finally, the sections were independently evaluated by pathologists. Sections were scored according to the percentage of cytoplasm-positive cells and intensity as follows: 0, no immunostaining; 1, weak; 2, moderate; and 3, strong; 0, negative; 1, <25% positive cells; 2, 26–50% positive cells; 3, >50% positive cells, respectively (8). The score was the sum of the extension and the staining intensity. The samples with scores 0–2 were considered negative, and those with scores 3–6 were considered positive.
Reverse transcription-quantitaive polymerase chain reaction (RT-qPCR)
Total RNA was extracted from tissue samples using the TRIzol reagent (Invitrogen, Beijing, China). RT-qPCR was performed using an SYBR Premix Ex Taq™ Reverse Transcription-PCR kit (Takara Bio, Inc., Otsu, Japan). The primers for human ACLY were, while the primers for β-actin were. The method of Livak and Schmittgen (9) and reference ΔCq values were used for calculations of ΔΔCq and all relative quantity values for assessing expression of ACLY mRNA in RCC and adjacent tissue. β-actin was used as internal controls.
Western blot analysis
Total protein was obtained from frozen tissues as previously described (10). Briefly, 40 µg of total protein was separated on an SDS-PAGE gel, the proteins then were transferred to a nitrocellulose membrane and probed with primary antibodies (anti-human ACLY antibody at 1:1,000 dilution, D221957; Sangon Biotech Co. Ltd.) overnight at 4°C. The following day, the membranes were washed with Tris-buffered saline and Tween-20 and incubated with a secondary anti-rabbit IgG antibody conjugated with horseradish peroxidase (WLA023; Wanleibio Co., Ltd., Shenyang, China). Next, membranes were incubated with enhanced chemiluminescence, and protein expression was visualized after exposure to X-ray film. Densitometry analysis was performed. β-actin (1:1,000, WL01845; Wanleibio Co., Ltd.) was used as an internal control.
Determination of serum ACLY concentrations
According to a previous study (11), ACLY serum concentrations were measured using a commercial ELISA kit (Glory Science Co., Ltd., Shanghai China).
Transfection with siRNA
siRNA targeting ACLY and negative controls were synthesized by GenePharma. According to the manufacturer's recommendations, all cell transfections were carried out with the Lipofectamine® 2000 Transfection Reagent (Invitrogen; Thermo Fisher Scientific, Inc., Waltham, MA, USA).
Cell proliferation assay
Cell proliferation was determined using a Cell Counting Kit (CCK-8; Dojindo Molecular Technologies, Inc., Kumamoto, Japan). The 786-0, GRC-1, HK-2, 786-0 transfected with siRNA and 786-0 transfected with negative controls were plated in 96-well plates at a density of 5×10³ cells/well in 100 µl of media. Cells were then cultured for 72 h. The absorbance of cells was measured at 450 nm. The OD values measured represented cellular proliferation. All experiments were performed in triplicate.
Transwell migration assay
The assay was performed using 24 well Corning chamber plates with an 8 µm pore polycarbonate membrane filters (Corning Incorporated, Corning, NY, USA). 1×10⁵ cells/well were placed in the upper chamber containing DMEM with 10% FBS; the lower chamber also contained DMEM with 10% FBS. The plates with cells were incubated at 37°C in a 5% CO2 incubator for 48 h. After incubation, cells on the membrane filter were fixed with 4% (v/v) formaldehyde for 10 min at room temperature. The cells were then stained with 0.5% crystal violet for 30 min. The migratory cells on the lower membrane surface were counted using bright field microscopy at 200 × magnification. Five random fields were counted for each filter, and each sample was assayed in triplicate.
Cell apoptosis assessment
Cellular apoptosis was measured using flow cytometry (BD Accuri Cytometers, Ann Arbor, MI USA), Annexin V, and propidium iodide (PI) (Apoptosis Detection kit, Annexin V-FITC; BD, Biosciences Pharmingen, San Diego, CA, USA), according to the manufacturer's guidelines.
Statistical analysis
All statistical analyses were performed using the SSPS (vesrion 19.0; SPSS, Inc., Chicago, IL, USA) software suite. Differences in RCC ACLY expression compared with adjacent kidney tissue ACLY expression were evaluated by one-way ANOVA followed with Newman-Keuls post hoc test. P<0.05 was considered to indicate a statistically significant difference.
Results
Clinicopathological findings in RCC patients
The clinicopathologic characteristics of study patients with RCC are shown in Table I. Patients ranged in age from 31 to 77 years and included 21 males and 12 females. All patients in the study were diagnosed with clear cell RCC (ccRCC) by pathologists. The tumor Fuhrman grades ranged from I to IV (12), and the TNM stages ranged from T1N0M0 to T3bN0M0.
Table I.
Association of ACLY expression with TNM stage and Fuhrman grade in ccRCC.
| ACLY expression (score for percentage of positive cells) | ||||||
|---|---|---|---|---|---|---|
| Characteristics | No. | 0 | 1 | 2 | 3 | P-value |
| TNM stage | <0.05 | |||||
| T1N0M0 | 23 | 3 (13.0) | 2 (8.8) | 3 (13.0) | 15 (65.2) | |
| T2N0M0 | 6 | 0 | 1 (16.7) | 0 | 5 (83.3) | |
| T2N1M0 or T2N0M1 | 2 | 0 | 0 | 1 (50.0) | 1 (50.0) | |
| T3N0M0 | 2 | 0 | 0 | 0 | 2 (100) | |
| Nuclear grade | <0.01 | |||||
| I | 11 | 2 (18.2) | 0 | 1 (9.1) | 8 (72.7) | |
| II | 14 | 1 (7.1) | 1 (7.1) | 2 (14.3) | 10 (71.5) | |
| III–IV | 8 | 0 | 0 | 1 (12.5) | 7 (87.5) | |
ACLY, ATP citrate lyase; ccRCC, clear cell Renal cell carcinoma; TNM, tumor node metastasis.
ACLY is highly expressed in primary RCC tissues
We evaluated the ACLY expression levels at the molecular level using RT-PCR. Mean ACLY mRNA expression in ccRCC was significantly higher when compared with surrounding normal kidney tissue in paired analyses (Fig. 1A).
Figure 1.

ACLY is higher expression in primary RCC tissues than that in adjacent normal tissues. (A) ACLY mRNA expression is increased when compare to adjacent normal tissue by RT-PCR (**P<0.01). (B) Representative bands (N, adjacent normal tissue; T, tumor) show increasing ACLY expression in frozen primary ccRCC, compare with adjacent normal tissues by immunoblotting. (C) Immunoblotting analysis showed higher ACLY expression in tumor (**P<0.01). (D) H&E staining of RCC tissues and adjacent normal kidney tissues, and increased expressions of ACLY in ccRCC with different stage and grade were showed by immunohistochemical staining. Representive images show an increasing tendency for staining intensity of ACLY in primary RCC tissues with increasing TNM stage and Fuhrman grade. Subcellular location of ACLY mainly was in both the cytoplasm (magnification, ×400). ACLY, ATP citrate lyase; RCC, renal cell carcinoma; ccRCC, clear cell RCC; H&E, hematoxylin and eosin.
To further investigate the ACLY protein expression levels in ccRCC and adjacent normal tissues, we performed immunoblotting assays. Of the 33 tumor and adjacent tissues, 30 cases showed significantly higher expression of ACLY levels in ccRCC tissues than in adjacent tissues, the other 3 presented weak expression. The remaining two ccRCC cases only showed weak ACLY expression. These results were in line with previous IHC findings for ACLY expression (Fig. 1B and C).
According to the IHC, we found that ACLY was detected in both cytoplasm and nucleus. Moreover, compared to the adjacent normal tissues, primary ccRCC tissues showed significantly higher expression of ACLY. More importantly, with an increasing Fuhrman grade and clinical stage, ACLY expression increased progressively. A representative illustration was shown in Fig. 1D.
Determination of serum ACLY concentrations
We assessed serum ACLY by ELISA in 10 healthy men and 37 patients with ccRCC. We found that ACLY serum concentrations were significantly higher in patients with ccRCC, compared with healthy controls (Fig. 2). Moreover, serum ACLY concentrations correlated with the TNM stage and Fuhrman grade of ccRCC and could be related to the higher metabolic rate in cancer cells.
Figure 2.
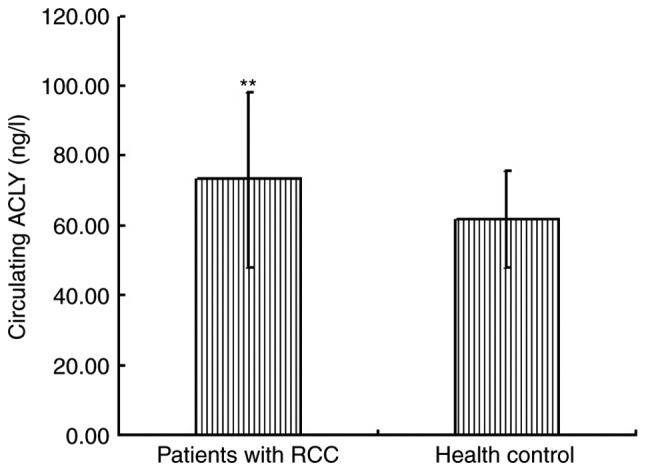
ELISA assay showing increased ACLY level in peripheral blood of patients with RCC than health control. (**P<0.01). ACLY, ATP citrate lyase; RCC, renal cell carcinoma.
The relationship ACLY expression in ccRCC with clinicopathologic parameters. Next, we analyzed the relationship between the intensity of ACLY expression ccRCC and clinicopathologic parameters, such as age and sex of the patients, TNM stage and Fuhrman nuclear grade. The ACLY expression intensity was classified as negative, weak, moderate, and strong expression. We found no significant relationship between the intensity of ACLY expression and the age or sex of the patients. Of the patients with ccRCC, the high percentage of ACLY positive cells was significantly associated with both higher Fuhrman nuclear grade and higher TNM stage (Table II).
Table II.
Expression of ACLY protein in RCC tissues by immunohistochemistry.
| ACLY expression | ||||||
|---|---|---|---|---|---|---|
| Characteristics | No. | 0 | 1 | 2 | 3 | P-value |
| Tumor diameter, cm | <0.05 | |||||
| <7 | 23 | 3 | 2 | 3 | 15 | |
| 7–10 | 6 | 0 | 1 | 0 | 5 | |
| >10 | 4 | 0 | 0 | 1 | 3 | |
| Nuclear grade | <0.01 | |||||
| I | 11 | 2 | 0 | 1 | 8 | |
| II | 14 | 1 | 1 | 2 | 10 | |
| III–IV | 8 | 0 | 0 | 1 | 7 | |
ACLY, ATP citrate lyase; RCC, renal cell carcinoma.
siRNA downregulated ACLY expression at both the molecular and protein levels
We knocked down ACLY expression using ACLY-specific siRNA to evaluate the effects of ACLY downregulation on RCC cells. We confirmed the knockdown effect using RT-qPCR and western blotting methods and found that the level of ACLY mRNA (Fig. 3A) and protein expression (Fig. 3B and C) were significantly decreased in HK-2 cells, and 786-0 cells transfected siRNA. The results indicated that ACLY expression was successfully downregulated in RCC cells.
Figure 3.
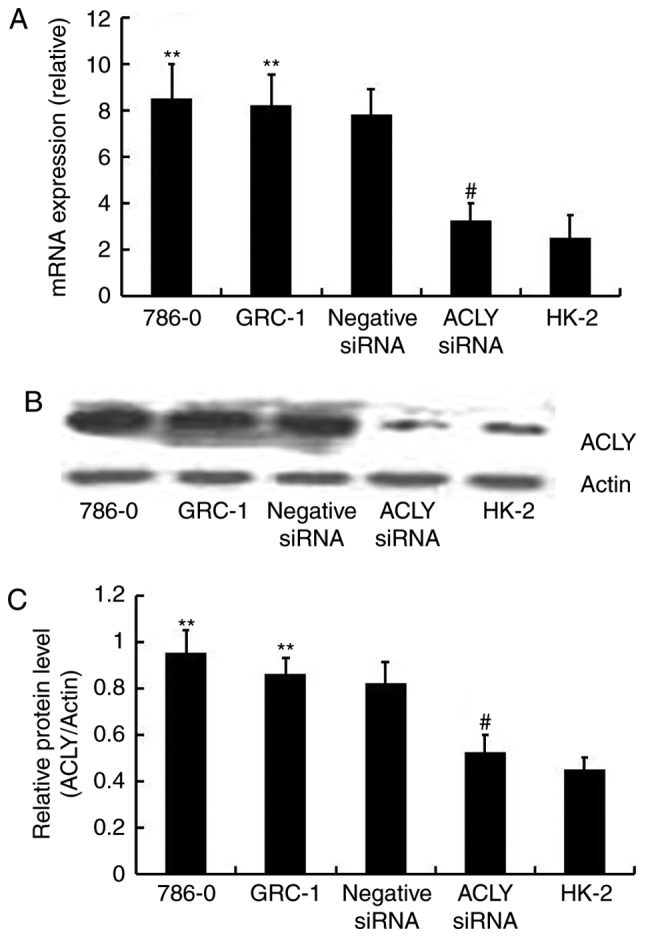
Transfected siRNA into 786-0 and GRC-1 renal cancer cells targets the expression of ACLY at both mRNA and protein level. (A) Relative expression of ACLY mRNA in quantified by real-time PCR in 786-0, GRC-1, 786-0 cells transfected with negative control, 786-0 cells transfected with siRNA and HK-2 cells (**P<0.01 compared with the HK-2. #P<0.05 compared with 786-0 and GRC-1). (B) Differential expression ACLY protein levels illustrated by western blotting in above five cell lines. (C) Analysis of ACLY protein expression shows lower expression in transfected with siRNA than non-treated cells or treated cells with negative control (**P<0.01 compared with the HK-2. #P<0.05 compared with 786-0 and GRC-1). ACLY, ATP citrate lyase; RCC, renal cell carcinoma; siRNA, small interferring RNA.
siRNA downregulated ACLY inhibited proliferation and migration of RCC cells, but promoted apoptosis of the cells
Compared with 786-0, GRC-1, and HK-2 cells, transfected 786-0 cells demonstrated significantly suppressed proliferation (P<0.01; Fig. 4A), and fewer transfected 786-0 cells migrated through the transwell compared with negative controls, (P<0.05 Fig. 4B). And, flow cytometry showed in Fig. 5, that RCC knocked down with ACLY promotes apoptosis as compared with transfected HK-2 or non-transfected RCC.
Figure 4.

ACLY siRNA inhibits RCC cells proliferation and migration. (A) Cell proliferation analysis shows a decreased OD in RCC cells after transfection of ACLY siRNA by CCK-8 assay (**P<0.01 compared with the HK-2. #P<0.05 compared with 786-0 and GRC-1). (B) Inhibition of ACLY by transfected siRNA reduced the migration of 786-0 and HK-2 cells Migration of RCC cells transfected with siRNA was suppressed by transwell assay. The upper panel is the representive microscopic images of crystal violate staining; the lower panel is the statistical results (**P<0.01 compared with the HK-2. #P<0.05 compared with 786-0 and GRC-1). Magnification, ×200. ACLY, ATP citrate lyase; RCC, renal cell carcinoma; siRNA, small interferring RNA; OD, optical density.
Figure 5.

ACLY siRNA promotes apoptosis of RCC cells. Inhibition of ACLY by transfected siRNA promoted apoptosis of 786-0 cells and HK-2 cells. The upper panel is the typical flow cytometric images, and lower panel is the result of analysis (**P<0.01 compared with the HK-2. #P<0.05 compared with 786-0 and GRC-1). Typical images of apoptosis in 786-0, GRC-1, 786-0 cells transfected with negative control, 786-0 cells transfected with siRNA and HK-2 cells are displayed by flow cytometry analysis. The percentage of apoptotic RCC cells shows a significantly increase after transfection of siRNA (**P<0.01 compared with the HK-2. #P<0.05 compared with 786-0 and GRC-1). ACLY, ATP citrate lyase; RCC, renal cell carcinoma; siRNA, small interferring RNA.
Discussion
Several studies demonstrated that cancer cell metabolism could be changed if sufficient ATP and the building blocks needed to sustain molecular synthesis are provided (13–15). Reprogramming cancer metabolism is also one of the hallmarks of cancer (16). In RCC, glucose uptake and glycolytic activity were significantly increased (17). ACLY is a key enzyme that participates in de novo glycolysis and lipogenesis. Our study found that ACLY expression was significantly increased in RCC compared with adjacent normal tissue. Moreover, IHC showed that high ACLY expression was primarily located in the cytoplasm of renal cancer cells. Also, our results suggested that ACLY expression was closely related to the stages and grades of RCC. Compared to healthy control subjects, serum ACLY concentrations were higher in RCC thant in negative controls. These findings suggest that ACLY could contribute to glycolysis and lipogenesis in RCC and that ACLY might be a useful marker for predicting, prognosing, and providing early diagnosis of RCC.
High ACLY expression in RCC might be involved in the metabolic shift of this cancer, suggesting that RCC progress relies on aerobic glycolysis, which is also observed in fumarate hydratase (FH)-deficient RCC and succinate dehydrogenase-deficient RCC (18,19). Although aerobic glycolysis has not been shown to produce sufficient ATP for RCC, but it has does facilitate cancer cell metabolism of nutrients within the biomass (nucleotides, amino acids, and lipids) that is required for cancer cell proliferation (20). Glycolytic intermediates, such as acetyl-CoA, are also the most important precursors of fatty acid. Acetyl-CoA originates from glucose and is used to synthesize citrate in the tricarboxylic acid cycle, which is needed to maintain high ATP/ADP and NADH/NAD+ in proliferating cells (21). Aerobic glycolysis may at least, partly account for the higher ACLY expression at the higher stages and grades of RCC in our study.
RCC, especially ccRCC, is histologically characterized by high tumor cell lipid content and a richly vascularized tumor stroma (22). Moreover, enhanced fatty acid synthesis is also required for proliferation and differentiation of malignant cells. Because ACLY is a key enzyme in the de novo lipogenesis, by catalyzing the conversion of cytosolic citrate into acetyl CoA and oxaloacetate, high molecular and protein ACLY expression in RCC might be closely linked with high tumor cell lipid content. A recent study also demonstrated that de novo glucose-dependent ACLY mediated lipogenesis inhibited ACLY activity, which could result in inhibition of proliferation and defective endomembrane expansion (23). Upregulated ACLY activity can increase lipid droplet formation forming building blocks to support growth in breast cancer cells (24). Additionally, the possible mechanism for anti-apoptosis effect of ACLY in RCC may be related with promotion of lipogenesis in mitochondria, because inhibition of ACLY would impair lipogenesis, involving activation of AMPK and blocking of its downstream protein ACC1 (25), further mitochondrial function would be impaired (26). Moreover, intrinsic apoptotic pathway is the mitochondria-dependent in some extent (27). Therefore, a deep understanding of the role of high ACLY expression may provide opportunities to find novel and more effective therapeutic approaches.
Based on ACLY expression levels in this study, ACLY might become a novel marker for prognostic evaluation in RCC. Our data showed that high ACLY expression was observed in high RCC grades and stages. We also showed that ACLY overexpression correlated with poor RCC differentiation. A previous report on non-small cell lung cancer demonstrated that ACLY is a useful marker for non-small cell lung cancer identification and higher levels correlated with a poor prognosis (28). This finding was consistent with our present observations. Generally speaking, ACLY localized in the cytoplasm, however, we also observed that the ACLY protein localized in both the cytoplasm and nucleus in clinical ccRCC samples, which showed that ACLY overexpression may not only be involved in energy metabolism, but may take part in the regulation of gene expression, such as DNA regulation, and methyltransferase-1 and histone acetylation, in RCC (20,29,30). Taken together, we show that these factors contribute to cancer development. Further studies are required to to gain a deeper understanding of the molecular basis of different ACLY subcellular localizations in RCC.
Finally, since ACLY downregulation by siRNA in RCC cells negatively affect biological behavior, in vitro, we think that ACLY could play an important role in maintaining the overall metabolism, progression, and invasion of tumor cells. However, precise cancer metabolism is complex, but at least we can say that the adverse effects of lower ACLY levels on the tumor cells could be at least partially responsible for decreased lipogenesis and impaired biological energy. Recently, the study of Xin et al (31) stated that decreased ACLY could reduce tumor growth and invasion and promote apoptosis in Saos-2, PC-3, Hela, and A549 cells, in vitro, which could have been due to decreased expression of common intermediates in the mevalonate pathway. Although the precise mechanisms for the anti-apoptosis effect of ACLY remain unclear, ACLY inhibition impairs lipogenesis, which involves AMPK activation and blockage of its downstream protein ACC1 (32), and impairs mitochondrial function (26). Moreover, the intrinsic apoptotic pathway is mitochondria-dependent to some extent (27). We, therefore, suggest that the anti-apoptosis effect of ACLY in RCC may be related to the advancement of lipogenesis in mitochondria. However, another recent study indicated that the interaction between cytoplasmic low molecular weight cyclin-E and ACLY upregulates ACLY enzymatic activity, promoting migration and invasion of breast cancer cells growth (33).
The small number of cases and lack of long-term follow-up are major limitation of our study. To investigate the precise effect of ACLY expression on overall survival or progress free survival in ccRCC, further studies with a large number of participants and long-term follow-up are warranted.
In conclusion, our results show much higher ACLY expression in RCC compared with adjacent normal kidney tissue. And, ACLY protein expression was located in the cytoplasm and nucleus and was associated with RCC stage and nuclear grade. Therefore, ACLY is should be considered to be a new marker to evaluate the biological aggressiveness of RCC, and be a potential target for RCC treatment.
Acknowledgements
The authors would like to thank Dr Hongshuang Dai and Ms Haibo Li for their assistance in collecting samples and technical assistance.
Funding
The study was supported by Heilongjiang postdoctoral scientific research developmental fund (grant no. LBH-Q15104).
Availability of data and materials
The datasets used or analyzed during the current study are available from the corresponding author on reasonable request.
Authors' contributions
LT and CL conceived and designed the experiments. LT and YS performed the experiments and drafted the manuscript. CL collected the samples. YCa and YCe performed the cell biological studies and the statistical analysis. WW performed the ELISA assay. YW and JL performed the statistical analysis. YX collected and analyzed the data, and revised the manuscript. All authors read and approved the final manuscript.
Ethics approval and consent to participate
This study was approved by the Ethics Board of Harbin Medical University Cancer Hospital. Written consent was obtained by all patients who participated in the study.
Consent for publication
All patients participated in the present study provided written informed consent for the publication.
Competing interests
The authors declare that they have no competing interests.
References
- 1.Patel C, Ahmed A, Ellsworth P. Renal cell carcinoma: A reappraisal. Urol Nurs. 2012;32:182–190. [PubMed] [Google Scholar]
- 2.Saito K, Kihara K. Role of C-reactive protein as a biomarker for renal cell carcinoma. Exp Rev Anticancer Ther. 2010;10:1979–1989. doi: 10.1586/era.10.192. [DOI] [PubMed] [Google Scholar]
- 3.Crispen PL, Boorjian SA, Lohse CM, Leibovich BC, Kwon ED. Predicting disease progression after nephrectomy for localized renal cell carcinoma: The utility of prognostic models and molecular biomarkers. Cancer. 2008;113:450–460. doi: 10.1002/cncr.23566. [DOI] [PMC free article] [PubMed] [Google Scholar]
- 4.Zisman A, Pantuck AJ, Wieder J, Chao DH, Dorey F, Said JW, deKernion JB, Figlin RA, Belldegrun AS. Risk group assessment and clinical outcome algorithm to predict the natural history of patients with surgically resected renal cell carcinoma. J Clin Oncol. 2002;20:4559–4566. doi: 10.1200/JCO.2002.05.111. [DOI] [PubMed] [Google Scholar]
- 5.Tran Q, Lee H, Park J, Kim SH, Park J. Targeting cancer metabolism-revisiting the Warburg effects. Toxicol Res. 2016;32:177–193. doi: 10.5487/TR.2016.32.3.177. [DOI] [PMC free article] [PubMed] [Google Scholar]
- 6.Deberardinis RJ, Sayed N, Ditsworth D, Thompson CB. Brick by brick: Metabolism and tumor cell growth. Curr Opin Genet Dev. 2008;18:54–61. doi: 10.1016/j.gde.2008.02.003. [DOI] [PMC free article] [PubMed] [Google Scholar]
- 7.Jiang Z, Liu X, Chang K, Liu X, Xiong J. Allyl isothiocyanate inhibits the proliferation of renal carcinoma cell line GRC-1 by inducing an imbalance between Bcl2 and bax. Med Sci Monit. 2016;22:4283–4288. doi: 10.12659/MSM.897315. [DOI] [PMC free article] [PubMed] [Google Scholar]
- 8.Pinto F, Campanella NC, Abrahão-Machado LF, Scapulatempo-Neto C, de Oliveira AT, Brito MJ, Andrade RP, Guimarães DP, Reis RM. The embryonic Brachyury transcription factor is a novel biomarker of GIST aggressiveness and poor survival. Gastric Cancer. 2016;19:651–659. doi: 10.1007/s10120-015-0505-0. [DOI] [PubMed] [Google Scholar]
- 9.Livak KJ, Schmittgen TD. Analysis of relative gene expression data using real-time quantitative PCR and the 2(-Delta Delta C(T) method. Methods. 2001;25:402–408. doi: 10.1006/meth.2001.1262. [DOI] [PubMed] [Google Scholar]
- 10.Wang H, Liu C, Han J, Zhen L, Zhang T, He X, Xu E, Li M. HER2 expression in renal cell carcinoma is rare and negatively correlated with that in normal renal tissue. Oncol Lett. 2012;4:194–198. doi: 10.3892/ol.2012.727. [DOI] [PMC free article] [PubMed] [Google Scholar]
- 11.Yi X, Pashaj A, Xia M, Moreau R. Reversal of obesity-induced hypertriglyceridemia by (R)-α-lipoic acid in ZDF (fa/fa) rats. Biochem Biophys Res Commun. 2013;439:390–395. doi: 10.1016/j.bbrc.2013.08.063. [DOI] [PubMed] [Google Scholar]
- 12.Fuhrman SA, Lasky LC, Limas C. Prognostic significance of morphologic parameters in renal cell carcinoma. Am J Surg Pathol. 1982;6:655–663. doi: 10.1097/00000478-198210000-00007. [DOI] [PubMed] [Google Scholar]
- 13.Cantor JR, Sabatini DM. Cancer cell metabolism: One hallmark, many faces. Cancer Discov. 2012;2:881–898. doi: 10.1158/2159-8290.CD-12-0345. [DOI] [PMC free article] [PubMed] [Google Scholar]
- 14.Ward PS, Thompson CB. Metabolic reprogramming: A cancer hallmark even Warburg did not anticipate. Cancer Cell. 2012;21:297–308. doi: 10.1016/j.ccr.2012.02.014. [DOI] [PMC free article] [PubMed] [Google Scholar]
- 15.Wittig R, Coy JF. The role of glucose metabolism and glucose-associated signalling in cancer. Perspect Medicin Chem. 2008;1:64–82. [PMC free article] [PubMed] [Google Scholar]
- 16.Hanahan D, Weinberg RA. Hallmarks of cancer: The next generation. Cell. 2011;144:646–674. doi: 10.1016/j.cell.2011.02.013. [DOI] [PubMed] [Google Scholar]
- 17.Lucarelli G, Galleggiante V, Rutigliano M, Sanguedolce F, Cagiano S, Bufo P, Lastilla G, Maiorano E, Ribatti D, Giglio A, et al. Metabolomic profile of glycolysis and the pentose phosphate pathway identifies the central role of glucose-6-phosphate dehydrogenase in clear cell-renal cell carcinoma. Oncotarget. 2015;6:13371–13386. doi: 10.18632/oncotarget.3823. [DOI] [PMC free article] [PubMed] [Google Scholar]
- 18.Tomlinson IP, Alam NA, Rowan AJ, Barclay E, Jaeger EE, Kelsell D, Leigh I, Gorman P, Lamlum H, Rahman S, et al. Germline mutations in FH predispose to dominantly inherited uterine fibroids, skin leiomyomata and papillary renal cell cancer. Nat Genet. 2002;30:406–410. doi: 10.1038/ng849. [DOI] [PubMed] [Google Scholar]
- 19.Ricketts CJ, Shuch B, Vocke CD, Metwalli AR, Bratslavsky G, Middelton L, Yang Y, Wei MH, Pautler SE, Peterson J, et al. Succinate dehydrogenase kidney cancer: An aggressive example of the Warburg effect in cancer. J Urol. 2012;188:2063–2071. doi: 10.1016/j.juro.2012.08.030. [DOI] [PMC free article] [PubMed] [Google Scholar]
- 20.Vander Heiden MG, Cantley LC, Thompson CB. Understanding the Warburg effect: The metabolic requirements of cell proliferation. Science. 2009;324:1029–1033. doi: 10.1126/science.1160809. [DOI] [PMC free article] [PubMed] [Google Scholar]
- 21.Hatzivassiliou G, Zhao F, Bauer DE, Andreadis C, Shaw AN, Dhanak D, Hingorani SR, Tuveson DA, Thompson CB. ATP citrate lyase inhibition can suppress tumor cell growth. Cancer Cell. 2005;8:311–321. doi: 10.1016/j.ccr.2005.09.008. [DOI] [PubMed] [Google Scholar]
- 22.Massari F, Ciccarese C, Santoni M, Brunelli M, Piva F, Modena A, Bimbatti D, Fantinel E, Santini D, Cheng L, et al. Metabolic alterations in renal cell carcinoma. Cancer Treat Rev. 2015;41:767–776. doi: 10.1016/j.ctrv.2015.07.002. [DOI] [PubMed] [Google Scholar]
- 23.Dufort FJ, Gumina MR, Ta NL, Tao Y, Heyse SA, Scott DA, Richardson AD, Seyfried TN, Chiles TC. Glucose-dependent de novo lipogenesis in B lymphocytes: A requirement for atp-citrate lyase in lipopolysaccharide-induced differentiation. J Biol Chem. 2014;289:7011–7024. doi: 10.1074/jbc.M114.551051. [DOI] [PMC free article] [PubMed] [Google Scholar]
- 24.Lucenay KS, Doostan I, Karakas C, Bui T, Ding Z, Mills GB, Hunt KK, Keyomarsi K. Cyclin E associates with the lipogenic enzyme ATP-citrate lyase to enable malignant growth of breast cancer cells. Cancer Res. 2016;76:2406–2418. doi: 10.1158/0008-5472.CAN-15-1646. [DOI] [PMC free article] [PubMed] [Google Scholar]
- 25.Tyszka-Czochara M, Konieczny P, Majka M. Caffeic acid expands anti-tumor effect of metformin in human metastaticcervical carcinoma HTB-34 cells: Implications of AMPK activation andimpairment of fatty acids de novo biosynthesis. Int J Mol Sci. 2017;18:E462. doi: 10.3390/ijms18020462. [DOI] [PMC free article] [PubMed] [Google Scholar]
- 26.Jones JE, Esler WP, Patel R, Lanba A, Vera NB, Pfefferkorn JA, Vernochet C. Inhibition of acetyl-coa carboxylase 1 (ACC1) and 2 (ACC2) reduces proliferation and de novo lipogenesis of EGFRvIII human glioblastoma cells. PLoS One. 2017;12:e0169566. doi: 10.1371/journal.pone.0169566. [DOI] [PMC free article] [PubMed] [Google Scholar]
- 27.Neely AM, Zhao G, Schwarzer C, Stivers NS, Whitt AG, Meng S, Burlison JA, Machen TE, Li C. N-(3-oxo-acyl)-homoserine lactone induces apoptosis primarily through amitochondrial pathway in fibroblasts. Cell Microbiol. 2018;20 doi: 10.1111/cmi.12787. [DOI] [PMC free article] [PubMed] [Google Scholar]
- 28.Migita T, Narita T, Nomura K, Miyagi E, Inazuka F, Matsuura M, Ushijima M, Mashima T, Seimiya H, Satoh Y, et al. ATP citrate lyase: Activation and therapeutic implications in non-small cell lung cancer. Cancer Res. 2008;68:8547–8554. doi: 10.1158/0008-5472.CAN-08-1235. [DOI] [PubMed] [Google Scholar]
- 29.Gentile Londono T, Lu C, Lodato PM, Tse S, Olejniczak SH, Witze ES, Thompson CB, Wellen KE. DNMT1 is regulated by ATP-citrate lyase and maintains methylation patterns during adipocyte differentiation. Mol Cell Bio. 2013;33:3864–3878. doi: 10.1128/MCB.01495-12. [DOI] [PMC free article] [PubMed] [Google Scholar]
- 30.Migita T, Okabe S, Ikeda K, Igarashi S, Sugawara S, Tomida A, Soga T, Taguchi R, Seimiya H. Inhibition of ATP citrate lyase induces triglyceride accumulation with altered fatty acid composition in cancer cells. Int J Cancer. 2014;135:37–47. doi: 10.1002/ijc.28652. [DOI] [PubMed] [Google Scholar]
- 31.Xin M, Qiao Z, Li J, Liu J, Song S, Zhao X, Miao P, Tang T, Wang L, Liu W, et al. miR-22 inhibits tumor growth and metastasis by targeting ATP citrate lyase: Evidence in osteosarcoma, prostate cancer, cervical cancer and lung cancer. Oncotarget. 2016;7:44252–44265. doi: 10.18632/oncotarget.10020. [DOI] [PMC free article] [PubMed] [Google Scholar]
- 32.Tyszka-Czochara M, Konieczny P, Majka M. Caffeic acid expands anti-tumor effect of metformin in human metastaticcervical carcinoma HTB-34 cells: Implications of AMPK activation andimpairment of fatty acids de novo biosynthesis. Int J Mol Sci. 2017;18 doi: 10.3390/ijms18020462. pii: E462. [DOI] [PMC free article] [PubMed] [Google Scholar]
- 33.Lucenay KS, Doostan I, Karakas C, Bui T, Ding Z, Mills GB, Hunt KK, Keyomarsi K. Cyclin E associates with the lipogenic enzyme ATP-citrate lyase to enable malignant growth of breast cancer cells. Cancer Res. 2015;76:2406–2418. doi: 10.1158/0008-5472.CAN-15-1646. [DOI] [PMC free article] [PubMed] [Google Scholar]
Associated Data
This section collects any data citations, data availability statements, or supplementary materials included in this article.
Data Availability Statement
The datasets used or analyzed during the current study are available from the corresponding author on reasonable request.