

Abstract
Studies on structural brain abnormalities in individuals with autism spectrum disorders (ASD) have been of limited size and many findings have not been replicated. In the largest ASD brain morphology study to date, we compared subcortical, total brain (TBV), and intracranial (ICV) volumes between 472 subjects with DSM-IV ASD diagnoses and 538 healthy volunteers (age range: 6 to 64 years), obtained from high-resolution structural brain scans provided by the Autism Brain Imaging Data Exchange (ABIDE). Compared to healthy volunteers, we found significantly larger pallidum (Cohen’s d = 0.15) and lateral ventricle volumes (Cohen’s d = 0.18) in ASD. These enlargements were independent of total brain volume and IQ, passed FDR correction for multiple comparisons, and were observed in overall, male-only, and medication-free subjects. In addition, intracranial, hippocampal, and caudate volumes were enlarged in ASD at a nominal statistical threshold of p<0.05. This study provides the first robust evidence for pallidum enlargement in ASD independent from TBV and encourages further study of the functional role of the pallidum in individuals with autism spectrum disorder.
Keywords: brain, volume, MRI, imaging, globus pallidus, pallidum, lateral ventricle, autism, ABIDE, ASD
1. Introduction
Autism Spectrum Disorders (ASD) –as defined by the DSM-IV– comprise a range of developmental disorders, including Autistic Disorder, Asperger’s Syndrome and Pervasive Developmental Disorder Not Otherwise Specified (Levy et al., 2009), characterized by social, communication, and stereotypical behaviors and/or interests. However, the recently published DSM-5 no longer includes these three sub diagnoses and characterizes ASD by two criteria: 1) social communication/interaction and 2) restricted and repetitive behavior symptoms (Hyman, 2013).
Brain morphological abnormalities have been observed in autism spectrum disorders but studies are mostly small and their findings inconsistent (Amaral et al., 2008). A meta-analyses of region of interest (ROI) brain volumes showed larger total brain (TBV), intracranial (ICV), cerebral hemispheres, cerebellum, and caudate volumes as well as smaller corpus callosum volumes in ASD subjects compared to healthy controls; with the number of patients and controls in the individual studies ranging from between 6 to 67 patients and 8 to 83 controls, respectively (Stanfield et al., 2008). In addition, one recent study showed larger putamen volume in 29 adults (ages 18–46) with ASD compared with 29 healthy controls (Sato et al., 2014) and another showed smaller pallidum volumes in 72 children (ages 4–18) with ASD compared with 138 healthy children (Sussman et al., 2015).
To address the issue of small sample sizes in ASD brain imaging studies, the Autism Brain Imaging Data Exchange (ABIDE, http://fcon_1000.projects.nitrc.org/indi/abide) made available a collection of 20 international data sets including high-resolution structural imaging and resting state functional magnetic resonance imaging (rsfMRI) of ASD patients and healthy volunteers. Initial findings comparing brain connectivity (Di Martino et al., 2013), cortical thickness (Valk et al., 2015), corpus callosum size (Lefebvre et al., 2015), and region of interest volumes (Haar et al., 2014) between ASD subjects and controls using ABIDE data have been published. With regard to subcortical volumes, the ABIDE studies found evidence for enlarged ventricular volumes and a smaller central segment of the corpus callosum (Haar et al., 2014); though the latter was not replicated in a second study (Lefebvre et al., 2015).
Given limited comprehensive examination of subcortical volumes in the ASD literature and in the ABIDE sample, as well as meta-analytic evidence for subcortical volume (caudate) enlargement in ASD (Stanfield et al., 2008), here we examined total brain, intracranial, and subcortical volumes in 472 ASD patients and 538 healthy volunteers (ages 6 to 64 years old) with brain imaging data obtained from the ABIDE. Based on a meta-analysis (Stanfield et al., 2008), we hypothesized larger TBV, ICV, lateral ventricle, and caudate volumes in individuals with ASD compared with healthy volunteers.
2. Methods
2.1. Subjects
This study includes 472 (mean age±SD=17.7±8.6, 418 males) subjects with a DSM-IV-TR ASD diagnosis and 538 healthy volunteers (HV; mean age±SD 17.3±7.7, 443 males) with high-resolution T1-weighted imaging data. The patient and control groups were similar in mean age and handedness distribution but the ASD group included a higher proportion of males, had lower IQ, lower social skills, and higher proportion of medication use (see Table 1). Analysis of the anonymous ABIDE data was approved as non-human subjects research by the University of California, Irvine Institutional Review Board.
Table 1.
Sample Demographics
| Autism Spectrum Disorder (n=472) |
Healthy Volunteers (n=538) |
Statistics | |
|---|---|---|---|
| DSM-IV-TR Diagnosis | |||
| Autism | 304 | ||
| Aspergers Syndrome (AS) | 86 | ||
| PDD-NOS | 35 | ||
| AS or PDD-NOS | 5 | ||
| Sex (M/F) | 418/54 | 443/95 | χ1=7.73, p=0.005 |
| Age at Scan in Years (SD) | 17.7 (8.6) | 17.3 (7.7) | t1008=0.83, p=0.41 |
| Handedness (L/R/M/A) | 32/277/3/8 | 29/334/3/5 | χ3=2.41, p=0.49 |
| FSIQ (SD) | 106.02 (16.9) | 111.37 (12.3) | t938=−5.61, p<0.0001 |
| VIQ (SD) | 104.83 (18.1) | 111.56 (13.0) | t829=−6.21, p<0.0001 |
| PIQ (SD) | 105.62 (16.9) | 108.20 (13.2) | t841=−2.49, p=0.01 |
| FSIQ (SD) Autism | 103.78 (15.6) | 111.37 (12.3) | t776=−7.29, p<0.0001 |
| FSIQ (SD) AS | 112.86 (16.1) | 111.37 (12.3) | t568=−1.04, p=0.30 |
| FSIQ (SD) PDD-NOS | 100.97 (21.2) | 111.37 (12.3) | t520=−4.22, p<0.0001 |
| ADIa-R Social (SD) | 19.77 (5.6) | … | |
| ADIa-R Verbal (SD) | 15.93 (4.66) | … | |
| ADIa-R RRB | 6.03 (2.6) | ||
| Vinelandb Social | 75.10 (1.8) | 111.72 (2.3) | t108=12.84, p<0.0001 |
| Vinelandb Communication (SD) | 78.60 (15.5) | ||
| Vinelandb ABC | 77.09 (1.6) | 108.53 (2.0) | t108=12.64, p<0.0001 |
| Medication Status (taking/not taking) | 108/232 | 2/391 | χ1=139.62, p<0.0001 |
PDD-NOS: Pervasive Developmental Disorder – Not Otherwise Specified
Handedness: L=Left; R=Right, M=Mixed; A=Ambidextrous
FSIQ=Full Scale Intelligence Quotient; VIQ=Verbal Intelligence Quotient; PIQ=Performance Intelligence Quotient
ADI=Autism Diagnostic Interview-Revised (Rutter et al., 2008)
Vineland=Vineland Adaptive Behavioral Scale (Cabrera et al., 1999)
2.2. Image acquisition
One-thousand-one-hundred-and-two, anonymous, high-resolution, whole brain, structural imaging scans were downloaded from the ABIDE website (http://fcon_1000.projects.nitrc.org/indi/abide). The ABIDE structural imaging scans were acquired at 20 sites using a variety of scanners and acquisition protocols (for summary of scan parameters, see Table 1S available online).
2.3. Quality assurance and image processing
Based on visual inspection of the T1-weighted images, blind to diagnosis (only subject identifiers were known at time of visual inspection), we excluded 84 out of the 1,102 scans due to significant motion artifacts (see Table 10S). FreeSurfer failed to complete recon-all and extract subcortical volumes on an additional 8 scans resulting in a total of 92 excluded scans (see Table 10S). Left and right lateral ventricle, thalamus, caudate, putamen, pallidum, hippocampus, amygdala, and accumbens volumes as well as total brain and intracranial volumes (Table 2) were obtained using Freesurfer (http://surfer.nmr.mgh.harvard.edu, Version 5.1.0). Methods used to obtain subcortical volumes have been described in previous publications (Fischl et al., 2002; Fischl, 2012). After FreeSurfer analysis, all regions of interest with a volume larger or smaller than 1.5 times the inter quartile range (IQR) were identified and visually inspected by overlaying them on the subject’s anatomical images. Based on these inspections, between 0 to 5 data points for each of the regions were removed from the final analyses due to poor segmentation (see Table 11S). All data exclusions were based on consensus of visual inspections performed by authors AHT and TGMvE.
Table 2.
Absolute Volumes
| Region | Autism Spectrum Disorder (n=472) |
Healthy Volunteer (n=538) |
|---|---|---|
| Hippocampus | ||
| Left | 4234(561) | 4167 (494) |
| Right | 4302(536) | 4221 (512) |
| Amygdala | ||
| Left | 1759 (316) | 1717 (285) |
| Right | 1823 (304) | 1795 (306) |
| Caudate | ||
| Left | 4140 (595) | 4074 (560) |
| Right | 4240 (625) | 4186 (570) |
| Putamen | ||
| Left | 6821 (878) | 6748 (832) |
| Right | 6541 (882) | 6441 (805) |
| Pallidum | ||
| Left | 2020 (277) | 1974 (254) |
| Right | 1808 (258) | 1776 (241) |
| Thalamus | ||
| Left | 7501 (895) | 7485 (813) |
| Right | 7651 (876) | 7611 (832) |
| Lateral Ventricle | ||
| Left | 6143 (3614) | 5428 (3110) |
| Right | 5696 (3468) | 5011 (2844) |
| Nucleus Accumbens | ||
| Left | 797 (171) | 779 (170) |
| Right | 818 (174) | 800 (169) |
| Total Brain Volume | 1224 (132) | 1213 (120) |
| Intracranial Volume | 1383 (239) | 1365 (220) |
The absolute volumes are presented as mean mm3 (SD) except for the Total Brain Volume which is presented as mean cm3 (SD).
2.4. Statistical analyses
Group differences in TBV and ICV were examined using univariate mixed model regression analyses (Proc Mixed, SAS v9.2, SAS Institute Inc.) predicting volumes with group, site, sex, age, and the group × site interactions. Group differences for each subcortical region were examined using univariate mixed model regression analyses (Proc Mixed, SAS v9.2, SAS Institute Inc.) predicting subcortical volumes with group, hemisphere, site, sex, age, group × site, group × hemisphere, site × hemisphere, and group × site × hemisphere interactions. Hemisphere entered the model as a repeated measures variable. TBV was included in the model to control for individual differences in brain size. Because of the large age range in the ABIDE sample (6 to 64 years, for age distributions see Supplement 1, Figure 2S) and non-linear effects of age on brain volumes, we added quadratic (age2) and cubic (age3) age predictors to all statistical models (for results including linear and quadratic terms, see supplemental tables 3S and 4S). Based on prior evidence of accelerated brain growth during development and normalization of brain volumes during adolescence in ASD (Courchesne et al., 2001; Courchesne et al., 2003; Redcay, 2005), models including group × age, group × age and group × age2, or group × age, group × age2 and group × age3) interactions were run first to examine possible differential age effects between groups. These interaction terms were not significant for any of the regions and were therefore dropped from the final analysis (Engqvist, 2005). To further examine whether any group differences may be related to accelerated brain growth trajectories in ASD compared to controls, though perhaps not observed as a group by age interaction due to lack of power, we performed additional post-hoc analyses splitting the sample into childhood / adolescent and adult samples (≤ 18 and > 18 years of age, respectively) for brain structures observed to be enlarged in the main analyses. In addition, given that Asperger’s Syndrome is associated with higher IQ than other forms of ASD, we performed a post-hoc comparison comparing volumes between DSM-IV-TR ASD categories for structures observed to differentiate ASD from controls.
Because there were significantly more men than women in the ASD group, all analyses were repeated using a male-only sample (ASD=418, HV=443). Given potential medication effects, all analyses were also rerun in mediation-free subjects only (ASD=364; HV=536). False Discovery Rate (FDR) was used to correct for multiple comparisons (Benjamini and Hochberg, 1995) and results that pass FDR are reported with (FDR-corrected p-value < 0.05, followed by the uncorrected p-value). For regions with significant group effects, Cohen’s d effect sizes are reported.
3. Results
3.1. Group Effects
There were significant effects of group on intracranial [ASD vs. HV LSM (cm3) ± SD = 1340 ± 239 vs. 1312 ± 232], lateral ventricle [LSM (mm3) ± SD = 5893 ± 4258 vs. 5181 ± 4152], pallidum [LSM (mm3) ± SD = 1877 ± 261 vs. 1839 ± 232], caudate [LSM (mm3) ± SD = 4194 ± 630 vs. 4122 ± 626], and hippocampus [LSM (mm3) ± SD = 4286 ± 500 vs. 4220 ± 487] volumes. For each of these regions, ASD patients’ volumes were significantly larger than those of controls regardless of whether age was included as a cubic, quadratic, or linear effect in the statistical model (Table 3, and Tables 3S and 4S available online). Only the effects for lateral ventricle (FDR-corrected p-value < 0.05, uncorrected p=0.001) and pallidum volumes (FDR-corrected p-value < 0.05, uncorrected p=0.005) were significant when corrected for multiple comparisons (Figure 1) and those for ICV, caudate, and hippocampus were significant at a nominal (uncorrected) p-value < 0.05. Moreover, these findings remained similar when analyses were limited to the male-only and medication-free samples (see Tables 2S, 5S, 6S, and 7S available online).
Table 3.
Regression Results
| Variable (nDF, dDF) |
Intracranial Volume |
Total Brain Volume |
Hippocampus | Amygdala | Caudate | Putamen | Pallidum | Thalamus | Lateral Ventricle |
Accumbens |
||||||||||
|---|---|---|---|---|---|---|---|---|---|---|---|---|---|---|---|---|---|---|---|---|
|
| ||||||||||||||||||||
| F | P | F | P | F | P | F | P | F | P | F | P | F | P | F | P | F | P | F | P | |
| Diagnosis (1, 951) | 5.45 | 0.02 | 1.66 | 0.20 | 6.54 | 0.01 | 1.85 | 0.17 | 4.74 | 0.03 | 1.36 | 0.24 | 8.09 | 0.005 | 0.11 | 0.74 | 10.32 | 0.001 | 2.37 | 0.12 |
| Hemisphere (1,953) | 12.80 | 0.0004 | 72.25 | $ | 91.67 | $ | 633.29 | $ | 1301.54 | $ | 45.67 | $ | 32.93 | $ | 56.79 | $ | ||||
| Diagnosis × Hemisphere (1,953) | 0.09 | 0.76 | 0.01 | 0.91 | 2.90 | 0.09 | 3.97 | 0.05 | 0.52 | 0.47 | 0.07 | 0.79 | 1.85 | 0.17 | 0.84 | 0.36 | ||||
| Site (19, 951) | 44.98 | $ | 7.66 | $ | 13.02 | $ | 30.30 | $ | 3.32 | $ | 22.66 | $ | 11.51 | $ | 8.29 | $ | 1.18 | 0.26 | 46.50 | $ |
| Diagnosis × Site (19,951) | 1.73 | 0.03 | 1.32 | 0.16 | 1.27 | 0.20 | 0.53 | 0.95 | 0.55 | 0.93 | 1.57 | 0.06 | 1.04 | 0.41 | 1.02 | 0.43 | 1.17 | 0.28 | 0.70 | 0.82 |
| Hemisphere × Site (19,953) | 1.76 | 0.02 | 4.36 | $ | 9.09 | $ | 2.90 | $ | 20.10 | $ | 8.85 | $ | 1.25 | 0.21 | 11.67 | $ | ||||
| Diagnosis × Site × Hemisphere (19,953) | 0.95 | 0.5222 | 1.34 | 0.15 | 0.91 | 0.57 | 2.08 | 0.004 | 1.78 | 0.02 | 1.76 | 0.02 | 2.00 | 0.007 | 1.45 | 0.10 | ||||
| Sex (1,951) | 73.11 | $ | 102.24 | $ | 0.66 | 0.42 | 1.74 | 0.19 | 0.20 | 0.66 | 2.58 | 0.11 | 11.94 | 0.0006 | 3.04 | 0.08 | 0.01 | 0.92 | 8.07 | 0.005 |
| Age (1,951) | 12.57 | 0.0004 | 5.90 | 0.02 | 14.16 | 0.0002 | 15.44 | $ | 2.59 | 0.11 | 8.73 | 0.003 | 1.21 | 0.27 | 22.16 | $ | 1.14 | 0.29 | 13.83 | 0.0002 |
| Age2(1,951) | 8.74 | 0.003 | 4.98 | 0.03 | 7.31 | 0.007 | 7.20 | 0.01 | 0.71 | 0.40 | 5.69 | 0.02 | 1.77 | 0.18 | 17.72 | 0.0002 | 0.24 | 0.63 | 8.43 | 0.004 |
| Age3(1,951) | 6.41 | 0.01 | 2.90 | 0.09 | 3.32 | 0.07 | 3.60 | 0.06 | 0.30 | 0.59 | 6.46 | 0.01 | 0.94 | 0.33 | 14.09 | 0.0002 | 0.35 | 0.56 | 7.02 | 0.008 |
| TBV (1,951) | 468.28 | $ | 463.25 | $ | 497.65 | $ | 475.58 | $ | 387.74 | $ | 885.77 | $ | 57.06 | $ | 303.09 | $ | ||||
nDF=nominator degrees of freedom; dDF=denominator degrees of freedom; ICV = Intracranial volume; TBV = Total Brain Volume
= p<0.0001
The group contrast p-values for lateral ventricle and pallidum were significant at the FDR-corrected p-value < 0.05 and are underlined, bold, and italic. Significant group effects at a nominal p<0.05 are underlined.
Figure 1.
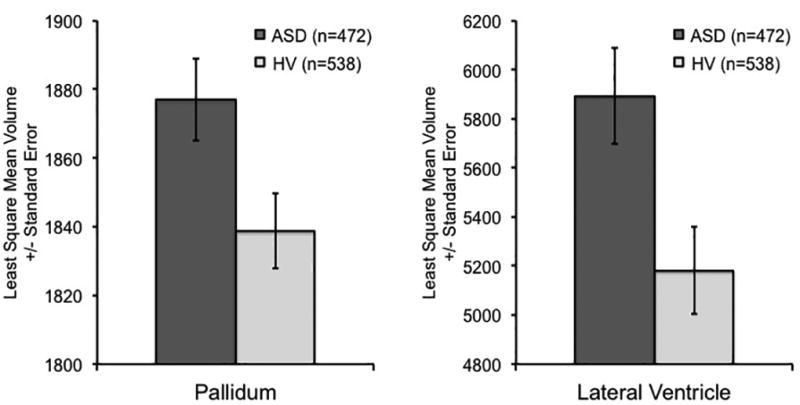
Pallidum and Lateral Ventricle Volume Enlargement in ASD
Volumes are in mm3.
3.2 Site and Group by Site Interaction Effects
There were significant effects of site for each of the regions, and there was only a significant diagnosis by site interaction on ICV (p=0.03; see Tables 2S, 5S, and 6S available online). Within-site group comparisons showed that ICV in ASD was larger than in healthy controls in two (p<0.02 and p<0.002) and smaller in one (p<0.01) out of the 20 sites.
3.3 Post-Hoc Analyses
Our analyses did not reveal significant group by age interactions though it is quite possible that this study is not adequately powered to achieve such interactions given the amount of variability in cross sectional samples. Based on evidence for accelerated brain growth during development and normalization during childhood and adolescence (Courchesne et al., 2001; Courchesne et al., 2003; Redcay, 2005), we performed post-hoc analyses examining effect sizes for the pallidum in young (<=18 years) and old (> 18 years) ASD subjects. Adult ASD subjects had non-significantly larger pallidum volumes than adult controls (t299=0.76, p=0.45, Cohen’s d = 0.07; male only: t264=0.49, p=0.62, d = 0.06). In contrast, young ASD subjects had significantly larger pallidum volumes than young controls (t630=2.10, p=0.04, Cohen’s d = 0.15; male only: t518 = 2.43, p=0.02, d = 0.20). It is noteworthy that the effect sizes in the young ASD subjects are nearly triple the size of those in the adult ASD subjects regardless of sample selection criteria (full sample or males only). For completeness, statistical results for all regions in young (<=18 years) and old (> 18 years) samples are reported in Supplemental Tables 12S–17S. Moreover, to further assess possible normalization of volumes during adolescence, pallidum volumes are plotted across child (age<=10, p=0.05; d=0.30), adolescent (10<age<=18, p=0.05; d=015), and adult (age>18; d=0.05) subsamples (Supplement 1, Figure 3S). All data are available for further exploration upon request.
While DSM-V no longer makes the same categorical distinctions as DSM-IV-TR for ASD, there could be differences among ASD diagnostic categories with different levels of functioning. As expected, FIQ was significantly higher in subjects with Asperger’s Syndrome than in subjects with Autism (t392=4.26, p<0.001) and PDD-NOS (t392=3.30, p=0.001) diagnoses. However, a post-hoc comparison of pallidum and lateral ventricle volumes between the ASD subgroups showed no significant differences between groups.
4. Discussion
In one of the largest structural imaging analysis of ASD patients conducted to date, we found that subjects with a DSM-IV diagnosis of ASD (n=472) had significantly larger pallidum (Cohen’s d = 0.15; male only d = 0.22; FDR-corrected p-value < 0.05, uncorrected p=0.005) and lateral ventricle volumes (Cohen’s d = 0.18; male only d = 0.23; FDR-corrected p-value < 0.05, uncorrected p=0.001) compared to healthy volunteers (n=538) that passed FDR correction for multiple comparisons. In addition, ASD subjects had nominally (p<0.05) larger ICV (p=0.02), caudate (p=0.03), and hippocampus (p=0.01) compared to healthy volunteers.
Research findings on pallidum abnormalities in ASD are mixed. One study found that higher severity of repetitive and stereotyped behaviors –characteristic of ASD– was associated with lower pallidum volumes in 3 to 4-year old infants (Estes et al., 2011). A more recent study found lower pallidum volumes in children with ASD compared to healthy children (Sussman et al., 2015). A third study reported larger pallidum (globus pallidus) volumes in 7–11 year old ASD patients compared with controls; though this finding did not remain significant after correcting for total brain volume (Herbert et al., 2003). In this much larger study, pallidum volume remained significantly larger (FDR corrected for multiple comparisons) in ASD compared to controls even when statistically controlling for individual differences in TBV. The finding was not an artifact of differences in sex distributions between the groups because it was also present in the male-only sample. A recent analysis of subcortical volumes using a stricter ABIDE data sample did not report significant pallidum volume abnormalities when controlling for IQ (Haar et al., 2014). We reanalyzed the data using similar stricter inclusion criteria (age<35 years, males only, and available IQ data) with IQ included in the model as a covariate, and found that both pallidum (p<0.0001) and lateral ventricle enlargement (p=0.001) remained significant (see Table 8S).
There are numerous possible explanations for the discrepant pallidum findings between Haar et al. (2014) and this study. We highlight two of them. The first is that the discrepant findings may be due to between-study differences in sample selection methods, which resulted in markedly different sample sizes. Our stricter inclusion criteria included a male only sample with age<35. However, instead of Haar et al.’s method of matching subjects for IQ at an individual subject level which resulted in the loss of a large number of data points, we co-varied for individual differences in IQ to maximize sample size. Our method resulted in sample sizes of 370 ASD subjects and 402 healthy volunteers, while those of Haar et al. (2014) resulted in 295 subjects in each group. Such a significant difference in sample size may contribute to the different results. A second, and possibly more likely explanation may be related to between-study differences in multiple comparison correction. Our study examined 10 regions of interest (ROIs), so our FDR corrections, and therefore results, are not comparable to those reported by Haar et al. (2014) who examined 180 ROIs (148 gray matter and 32 subcortical ROIs). Moreover, Haar et al. (2014) did not report the effect size for the pallidum, which makes it difficult to compare the results between studies.
Whether larger pallidum volumes in ASD patients are associated with disease-related factors, a consequence of treatment, or due to group differences in other unmeasured confounding factors (Weinberger and Radulescu, 2016) remains to be determined. Though, given that the effects are present in the overall sample as well as in subjects younger than 35 years of age, they are not likely due to confounds of cardiovascular issues or poor sampling across the age range. Moreover, we also observed pallidum enlargement in the medication free ABIDE sample (see Table 7S), suggesting that the pallidum enlargement is not likely due to treatment. More general confounding factors, such as differences in motion during the scan would not likely uniquely affect the pallidum but would likely affect multiple other brain regions. While we cannot exclude the possibility of confounding factors, our findings suggest that the observed pallidum enlargement may be related to the disease-related factors. If so, then what role does the pallidum play in ASD?
The basal ganglia include direct (striatum to substantia nigra; selection of relevant motor programs) and indirect (striatum to globus pallidus, to subthalamic nucleus, to substantia nigra; suppression of competing motor programs) motor pathways (Bechard et al. 2016). A recent study in the deer mouse model found that environmental enrichment associated increases in neural activation and dendritic spine densities in the indirect basal ganglia pathway were associated with decreased repetitive motor behavior (Bechard et al. 2016). These findings suggest a role for the pallidum in the repetitive and stereotypic symptoms observed in ASD. Interestingly, similar to the pallidum volume abnormalities observed in this study, stereotyped repetitive movement abnormalities in ASD decrease with age (Esbensen et al. 2009). We did, however, not observe a significant correlation between the ADI-R RRB RB (restricted, repetitive, and stereotyped behaviors) score and pallidum volumes though the underlying mechanisms of these symptoms is likely more complex than a one-to-one linear relationship. Of note, in addition to a possible role of the pallidum in stereotypic behavior (Estes et al., 2011), the ventral pallidum has been implicated in disordered social bonding (Napier and Mickiewicz, 2010) though more research is needed to explore the possible link between the pallidum and social functioning in ASD.
Larger lateral ventricles replicate earlier findings in ASD patients compared with controls (Stanfield et al., 2008) and are not unique to ASD but also present in many other neuropsychiatric disorders (Hendren et al., 2000). In contrast to the Stanfield et al. (2008) meta-analysis, we did not find enlarged TBV in ASD individuals compared with controls. Together with the analysis of covariance controlling for TBV, this rules out the likelihood that the larger regional volumes observed in our analyses are due to a global increase in TBV.
The strong effects of site indicate the need for multi-center studies to control for site in their statistical models. These effects can even be present in prospective multi-center studies, and balancing the recruitment of patients and controls across sites when possible is therefore highly recommended in multi-center studies; see (Glover et al., 2012) for additional multi-center imaging recommendations. There was only a significant group by site effect on ICV. Consistent with the study by Haar et al. (2014), ICV was only found to be significantly larger in ASD compared to healthy volunteers in 2 out of the 20 sites. The lack of group by site interactions suggest that the effects observed, though some weak, were largely consistent across samples.
Study strengths include the statistical power provided by the large ABIDE sample, the use of automated analysis methods, and FDR correction for multiple comparisons. Additionally, the enlarged lateral ventricle, pallidum, hippocampus, and caudate volumes found in ASD were independent from total brain volumes.
Weaknesses of the study include the use of different clinical assessments across samples, the cross sectional study design which does not allow for the study of developmental trajectories, and the lack of imaging data on subjects younger than 6 years of age. Additionally, the lack of detailed medication data (e.g., name and dose) available through ABIDE limited the analysis of specific medication effects on brain morphology. Though, analysis of a medication-free sample showed similar findings, which suggests that our findings are more likely disease related rather than treatment related (see Table 7S). Future studies should collect detailed medication information such that possible effects of medication can be studied in greater detail.
In conclusion, in the largest study on subcortical brain volumes in ASD to date, we observed that individuals with ASD had significantly larger pallidum and lateral ventricle volumes compared to healthy volunteers while controlling for total brain volume. Though the findings for hippocampus and caudate volumes were only nominally significant despite the large cross sectional sample, they are consistent with the possible involvement of the caudate and hippocampus in ASD (Stanfield et al., 2008; Calderoni et al., 2014). Our finding of pallidum enlargement was not hypothesized based on studies published to date and warrants replication. Our investigation of the cross sectional ABIDE data did not find significant group by age interactions on subcortical brain volumes that would be suggestive of abnormal developmental trajectories in Autism Spectrum disorder. Though, modeling non-linear relationships with age across the lifespan in cross sectional samples is challenging. We did, however, find that the effect size for the pallidum enlargement was larger in the young (<=18 years; Cohen’s d = 0.15, and d = 0.20 male only) compared with the old (>18 years, Cohen’s d = 0.07, and d = 0.06 in male only) cohort. Moreover, pallidum effect sizes also showed a step-wise decrease across child (d=0.30), adolescent (d=0.15), and adult samples (d=0.05; see Supplement 1 Figure 3S). These findings are, at least in part, suggestive of dynamic developmental brain changes in ASD. Though, large-scale, prospective, standardized, longitudinal brain imaging studies are needed to confirm possible abnormal brain developmental trajectories associated with Autism Spectrum Disorder.
Supplementary Material
Acknowledgments
The project described was supported by the National Center for Research Resources and the National Center for Advancing Translational Sciences, National Institutes of Health, through Grant UL1 TR000153. Dr. Van Erp is supported in part by NIMH grant number MH97196 and the NIH BD2K award, U54EB020403. Dr. Van Erp has consulted for Roche Pharmaceuticals and has a contract with Otsuka Pharmaceuticals. Mrs. Andia H. Turner was supported by a University of California, Irvine, School of Medicine, Dean’s 2013 Summer Research Stipend. The content is solely the responsibility of the authors and does not necessarily represent the official views of the NIH.
We are thankful to the Autism Brain Imaging Data Exchange (http://fcon_1000.projects.nitrc.org/indi/abide) study sites for providing the collected imaging data to the research community, to Joseph A. Farran, Harry Mangalam, and Adam Brenner for system administration support at the University of California, Irvine High Performance Computing (HPC) cluster used for the image analyses, and to the research subjects for their participation. This study was supported by a University of California, Irvine, School of Medicine, 2013 Dean’s Summer Research Stipend to Mrs. Andia H. Turner.
Footnotes
Author Contributions
TGMVE and AHT planned the study. AHT performed the quality assurance. TGMVE performed the image and statistical analyses. KSG helped compile the results. All authors contributed to the writing of the manuscript.
References
- Amaral DG, Schumann CM, Nordahl CW. Neuroanatomy of autism. Trends Neurosci. 2008;31(3):137–145. doi: 10.1016/j.tins.2007.12.005. [DOI] [PubMed] [Google Scholar]
- Benjamini Y, Hochberg Y. Controlling for False Discovery Rate: a Practical and Powerful Approach to Multiple Testing. J.R. statist. Soc. 1995;57(1):289–300. [Google Scholar]
- Bechard AR, Cacodcar N, King MA, Lewis MH. How does environmental enrichment reduce repetitive motor behaviors? Neuronal activation and dendritic morphology in the indirect basal ganglia pathway of a mouse model. Behav Brain Res. 2016;299:122–131. doi: 10.1016/j.bbr.2015.11.029. [DOI] [PMC free article] [PubMed] [Google Scholar]
- Cabrera PM, Gaa LG, Thyer BA. Social Work Assessment of Adaptive Functioning Using the Vineland Adaptive Behavioral Scales. Journal of Human Behavior in the Social Environment. 1999;2(4):33–50. [Google Scholar]
- Calderoni S, Bellani M, Hardan AY, Muratori F, Brambilla P. Basal ganglia and restricted and repetitive behaviours in Autism Spectrum Disorders: current status and future perspectives. Epidemiol Psychiatr Sci. 2014:1–4. doi: 10.1017/S2045796014000171. [DOI] [PMC free article] [PubMed] [Google Scholar]
- Courchesne E, Carper R, Akshoomoff N. Evidence of brain overgrowth in the first year of life in autism. JAMA. 2003;290(3):337–344. doi: 10.1001/jama.290.3.337. [DOI] [PubMed] [Google Scholar]
- Courchesne E, Karns CM, Davis HR, Ziccardi R, Carper RA, Tigue ZD, Chisum HJ, Moses P, Pierce K, Lord C, Lincoln AJ, Pizzo S, Schreibman L, Haas RH, Akshoomoff NA, Courchesne RY. Unusual brain growth patterns in early life in patients with autistic disorder: an MRI study. Neurology. 2001;57(2):245–254. doi: 10.1212/wnl.57.2.245. [DOI] [PubMed] [Google Scholar]
- Di Martino A, Yan CG, Li Q, Denio E, Castellanos FX, Alaerts K, Anderson JS, Assaf M, Bookheimer SY, Dapretto M, Deen B, Delmonte S, Dinstein I, Ertl-Wagner B, Fair DA, Gallagher L, Kennedy DP, Keown CL, Keysers C, Lainhart JE, Lord C, Luna B, Menon V, Minshew NJ, Monk CS, Mueller S, Muller RA, Nebel MB, Nigg JT, O'Hearn K, Pelphrey KA, Peltier SJ, Rudie JD, Sunaert S, Thioux M, Tyszka JM, Uddin LQ, Verhoeven JS, Wenderoth N, Wiggins JL, Mostofsky SH, Milham MP. The autism brain imaging data exchange: towards a large-scale evaluation of the intrinsic brain architecture in autism. Mol Psychiatry. 2013 doi: 10.1038/mp.2013.78. [DOI] [PMC free article] [PubMed] [Google Scholar]
- Esbensen AJ, Seltzer MM, Lam KS, Bodfish JW. Age-related differences in restricted repetitive behaviors in autism spectrum disorders. J Autism Dev Disord. 2009;39:57–66. doi: 10.1007/s10803-008-0599-x. [DOI] [PMC free article] [PubMed] [Google Scholar]
- Engqvist L. The mistreatment of covariate interaction terms in linear model analyses of behavioural and evolutionary ecology studies. Animal Behavior. 2005;70:967–971. [Google Scholar]
- Estes A, Shaw DW, Sparks BF, Friedman S, Giedd JN, Dawson G, Bryan M, Dager SR. Basal ganglia morphometry and repetitive behavior in young children with autism spectrum disorder. Autism Res. 2011;4(3):212–220. doi: 10.1002/aur.193. [DOI] [PMC free article] [PubMed] [Google Scholar]
- Fischl B. FreeSurfer. Neuroimage. 2012;62(2):774–781. doi: 10.1016/j.neuroimage.2012.01.021. [DOI] [PMC free article] [PubMed] [Google Scholar]
- Fischl B, Salat DH, Busa E, Albert M, Dieterich M, Haselgrove C, van der Kouwe A, Killiany R, Kennedy D, Klaveness S, Montillo A, Makris N, Rosen B, Dale AM. Whole brain segmentation: automated labeling of neuroanatomical structures in the human brain. Neuron. 2002;33(3):341–355. doi: 10.1016/s0896-6273(02)00569-x. [DOI] [PubMed] [Google Scholar]
- Glover GH, Mueller BA, Turner JA, van Erp TG, Liu TT, Greve DN, Voyvodic JT, Rasmussen J, Brown GG, Keator DB, Calhoun VD, Lee HJ, Ford JM, Mathalon DH, Diaz M, O'Leary DS, Gadde S, Preda A, Lim KO, Wible CG, Stern HS, Belger A, McCarthy G, Ozyurt B, Potkin SG. Function biomedical informatics research network recommendations for prospective multicenter functional MRI studies. J Magn Reson Imaging. 2012;36(1):39–54. doi: 10.1002/jmri.23572. [DOI] [PMC free article] [PubMed] [Google Scholar]
- Haar S, Berman S, Behrmann M, Dinstein I. Anatomical Abnormalities in Autism? Cereb Cortex. 2014 doi: 10.1093/cercor/bhu242. [DOI] [PubMed] [Google Scholar]
- Hallahan B, Daly EM, McAlonan G, Loth E, Toal F, O'Brien F, Robertson D, Hales S, Murphy C, Murphy KC, Murphy DG. Brain morphometry volume in autistic spectrum disorder: a magnetic resonance imaging study of adults. Psychol Med. 2009;39(2):337–346. doi: 10.1017/S0033291708003383. [DOI] [PubMed] [Google Scholar]
- Hazlett HC, Poe M, Gerig G, Smith RG, Provenzale J, Ross A, Gilmore J, Piven J. Magnetic resonance imaging and head circumference study of brain size in autism: birth through age 2 years. Arch Gen Psychiatry. 2005;62(12):1366–1376. doi: 10.1001/archpsyc.62.12.1366. [DOI] [PubMed] [Google Scholar]
- Hazlett HC, Poe MD, Gerig G, Styner M, Chappell C, Smith RG, Vachet C, Piven J. Early brain overgrowth in autism associated with an increase in cortical surface area before age 2 years. Arch Gen Psychiatry. 2011;68(5):467–476. doi: 10.1001/archgenpsychiatry.2011.39. [DOI] [PMC free article] [PubMed] [Google Scholar]
- Hendren RL, De Backer I, Pandina GJ. Review of neuroimaging studies of child and adolescent psychiatric disorders from the past 10 years. J Am Acad Child Adolesc Psychiatry. 2000;39(7):815–828. doi: 10.1097/00004583-200007000-00010. [DOI] [PubMed] [Google Scholar]
- Herbert MR, Ziegler DA, Deutsch CK, O'Brien LM, Lange N, Bakardjiev A, Hodgson J, Adrien KT, Steele S, Makris N, Kennedy D, Harris GJ, Caviness VS., Jr Dissociations of cerebral cortex, subcortical and cerebral white matter volumes in autistic boys. Brain. 2003;126(Pt 5):1182–1192. doi: 10.1093/brain/awg110. [DOI] [PubMed] [Google Scholar]
- Hyman SL. New DSM-5 includes changes to autism criteria, AAP News. American Academy of Pediatrics; Elk Grove Village, Illinois: 2013. [Google Scholar]
- Lefebvre A, Beggiato A, Bourgeron T, Toro R. Neuroanatomical Diversity of Corpus Callosum and Brain Volume in Autism: Meta-analysis, Analysis of the Autism Brain Imaging Data Exchange Project, and Simulation. Biol Psychiatry. 2015 doi: 10.1016/j.biopsych.2015.02.010. [DOI] [PubMed] [Google Scholar]
- Levy SE, Mandell DS, Schultz RT. Autism. Lancet. 2009;374(9701):1627–1638. doi: 10.1016/S0140-6736(09)61376-3. [DOI] [PMC free article] [PubMed] [Google Scholar]
- Napier TC, Mickiewicz AL. The role of the ventral pallidum in psychiatric disorders. Neuropsychopharmacology. 2010;35(1):337. doi: 10.1038/npp.2009.113. [DOI] [PMC free article] [PubMed] [Google Scholar]
- Raznahan A, Wallace GL, Antezana L, Greenstein D, Lenroot R, Thurm A, Gozzi M, Spence S, Martin A, Swedo SE, Giedd JN. Compared to what? Early brain overgrowth in autism and the perils of population norms. Biol Psychiatry. 2013;74(8):563–575. doi: 10.1016/j.biopsych.2013.03.022. [DOI] [PMC free article] [PubMed] [Google Scholar]
- Redcay E, Courchesne E. When is the brain enlarged in autism? A meta-analysis of all brain size reports. Biol Psychiatry. 2005;58(1):1–9. doi: 10.1016/j.biopsych.2005.03.026. [DOI] [PubMed] [Google Scholar]
- Rutter M, LeCouteur A, Lord C. Autism diagnostic interview-revised (ADI-R) Western Psychological Services; Los Angeles: 2008. [Google Scholar]
- Sato W, Kubota Y, Kochiyama T, Uono S, Yoshimura S, Sawada R, Sakihama M, Toichi M. Increased putamen volume in adults with autism spectrum disorder. Front Hum Neurosci. 2014;8:957. doi: 10.3389/fnhum.2014.00957. [DOI] [PMC free article] [PubMed] [Google Scholar]
- Schumann CM, Bloss CS, Barnes CC, Wideman GM, Carper RA, Akshoomoff N, Pierce K, Hagler D, Schork N, Lord C, Courchesne E. Longitudinal magnetic resonance imaging study of cortical development through early childhood in autism. J Neurosci. 2010;30(12):4419–4427. doi: 10.1523/JNEUROSCI.5714-09.2010. [DOI] [PMC free article] [PubMed] [Google Scholar]
- Shen MD, Nordahl CW, Young GS, Wootton-Gorges SL, Lee A, Liston SE, Harrington KR, Ozonoff S, Amaral DG. Early brain enlargement and elevated extra-axial fluid in infants who develop autism spectrum disorder. Brain. 2013;136(Pt 9):2825–2835. doi: 10.1093/brain/awt166. [DOI] [PMC free article] [PubMed] [Google Scholar]
- Stanfield AC, McIntosh AM, Spencer MD, Philip R, Gaur S, Lawrie SM. Towards a neuroanatomy of autism: a systematic review and meta-analysis of structural magnetic resonance imaging studies. Eur Psychiatry. 2008;23(4):289–299. doi: 10.1016/j.eurpsy.2007.05.006. [DOI] [PubMed] [Google Scholar]
- Sussman D, Leung RC, Vogan VM, Lee W, Trelle S, Lin S, DBCassel DB, MMChakravarty MM, Lerch JP, Anagnostou E, Taylo MJ. The autism puzzle: Diffuse but not pervasive neuroanatomical abnormalities in children with ASD. NeuroImage: Clinical. 2015;(8):170–179. doi: 10.1016/j.nicl.2015.04.008. [DOI] [PMC free article] [PubMed] [Google Scholar]
- Valk SL, Di Martino A, Milham MP, Bernhardt BC. Multicenter mapping of structural network alterations in autism. Hum Brain Mapp. 2015 doi: 10.1002/hbm.22776. [DOI] [PMC free article] [PubMed] [Google Scholar]
- Weinberger DR, Radulescu E. Finding the Elusive Psychiatric "Lesion" With 21st-Century Neuroanatomy: A Note of Caution. Am J Psychiatry. 2016;173:27–33. doi: 10.1176/appi.ajp.2015.15060753. [DOI] [PubMed] [Google Scholar]
Associated Data
This section collects any data citations, data availability statements, or supplementary materials included in this article.