

Abstract
Rechargeable lithium-ion (Li-ion) and lithium-polymer (Li-poly) batteries have recently become dominant in consumer electronic products because of advantages associated with energy density and product longevity. However, the small size of these batteries, the high rate of disposal of consumer products in which they are used, and the lack of uniform regulatory policy on their disposal means that lithium batteries may contribute substantially to environmental pollution and adverse human health impacts due to potentially toxic materials. In this research, we used standardized leaching tests, life-cycle impact assessment (LCIA), and hazard assessment models to evaluate hazardous waste classification, resource depletion potential, and toxicity potentials of lithium batteries used in cellphones. Our results demonstrate that according to U.S. federal regulations, defunct Li-ion batteries are classified hazardous due to their lead (Pb) content (average 6.29 mg/L; σ = 11.1; limit 5). However, according to California regulations, all lithium batteries tested are classified hazardous due to excessive levels of cobalt (average 163 544 mg/kg; σ = 62 897; limit 8000), copper (average 98 694 mg/kg; σ = 28 734; limit 2500), and nickel (average 9525 mg/kg; σ = 11 438; limit 2000). In some of the Li-ion batteries, the leached concentrations of chromium, lead, and thallium exceeded the California regulation limits. The environmental impact associated with resource depletion and human toxicity is mainly associated with cobalt, copper, nickel, thallium, and silver, whereas the ecotoxicity potential is primarily associated with cobalt, copper, nickel, thallium, and silver. However, the relative contribution of aluminum and lithium to human toxicity and ecotoxicity could not be estimated due to insufficient toxicity data in the models. These findings support the need for stronger government policy at the local, national, and international levels to encourage recovery, recycling, and reuse of lithium battery materials.
INTRODUCTION
Rechargeable lithium-based batteries have displaced nickel-cadmium and nickel metal hydride batteries to become the dominant energy supply components in portable consumer electronic products due to Li-ion’s superior energy density and slow discharge in idle mode.1 These advantages have also led to the adoption of lithium batteries in electric vehicles, military, and aerospace applications. Consequently, the global market for lithium batteries is projected to increase from $7.9 billion in 2008 to $8.6 billion in 2014.1 With a relatively short life span of about 2 to 4 years, rechargeable lithium batteries in portable electronic devices will contribute substantially to the increasing problem of electronic waste (e-waste), the fastest growing segment of the U.S. solid waste stream.2,3
In this study, we focused on rechargeable (secondary) lithium batteries that rely on intercalated lithium compounds as electrode material, not the disposable (primary) button-type lithium batteries that rely on metallic lithium. We further differentiate between lithium-polymer (Li-Poly) batteries that evolved from the original lithium-ion (Li-ion) batteries based on the used of a solid polymer composite such as polyacrylonitrile instead of liquid organic solvent to hold the lithium salt electrolyte. Increased functional sophistication of “smartphones” has also driven the demand for small and high energy density lithium batteries. Therefore, we included smartphone batteries as a separate category for our analyses.
Lithium batteries contain potentially toxic materials including metals, such as copper, nickel, and lead, and organic chemicals, such as toxic and flammable electrolytes containing LiClO4, LiBF4, and LiPF6.4 Human and environmental exposures to these chemicals are typically regulated during the manufacture of lithium batteries through occupational health and safety laws, and potential fire hazards associated with their transportation are regulated through the U.S. Code of Federal Regulations (49 CFR 173.185),5 but there is inconsistent policy about the fate of discarded lithium batteries in e-waste that is distributed internationally.3,5,6 This study focused on metals in three types of batteries entering the waste stream, Li-ion and Li-poly batteries from older phones and lithium batteries from newer smartphones that are increasingly entering the waste stream.
Previous studies have established defunct cellphones as hazardous waste under federal law.7,8 However, those studies excluded batteries, relied on prelithium technology, or used data from inventory models without empirically assessing chemical concentrations in simulated environmental disposals.9–13 Thus, the objectives of this study are (i) to use standardized leaching tests to determine the metal content in discarded rechargeable lithium batteries that may render these products classified as hazardous waste under U.S. federal regulations, using the Toxicity Characteristics Leaching Procedure (TCLP14), and under California state regulations, using the Waste Extraction Test (WET) and the Total Threshold Limit Concentration (TTLC15), and (ii) to use material life-cycle impact assessment and hazard assessment models to evaluate resource depletion and toxicity potentials of lithium batteries due to their metallic content. Completion of these objectives will provide important information on the variability of hazardous waste classification for lithium batteries in cellphones at both state and federal levels while also supporting design-for-the-environment goals, optimizing resource recovery, and minimizing occupational hazards.
MATERIALS AND METHODS
Sample Collection and Preparation
Sixteen cellphone batteries were obtained from Recellular, Inc. (Ann Arbor, MI), the world’s largest facility for recycling cellphones. Recellular processes approximately 4 million used phones annually, and the battery samples that we selected for this study were proportional representatives of the size of the inventory. The batteries represented three types of current battery models found to be most abundant in e-waste: Li-ion and Li-poly for traditional phones and batteries from more sophisticated smartphones. A complete list of Li batteries, inventory quantities, and typical components and chemical constituents are reported in Tables A and B (Supporting Information).
Replicate batteries were shredded using the Retsch SM-2000 Cutting Mill (Retsch, Germany) to particle diameter of 9.5 mm, as required by TCLP.14 Then, each batch was homogenized and partitioned evenly by mass, followed by further particle size reduction to 2.0 and 1.0 mm for WET and TTLC analysis.15 During processing, the mill temperature did not exceed 40 °C.
Chemical Leaching Assessment Procedures
Three standard procedures, TCLP (Method 1311; 40 CFR §261.24; for metals only), WET, and TTLC (California Department of Toxic Substances Control, DTSC; Title 22) were used to evaluate the solid waste classification of lithium batteries and to determine the identity of specific chemicals present in amounts that exceed regulatory limits (See the Supporting Information, Table C). These procedures were selected because they were more rigorous (in terms of pH of leaching solution) than alternative procedures associated with environmental compliance in the European Union, Japan, and China.7,16 For the TCLP procedure, eight metals were analyzed: As, Ba, Cd, Cr, Pb, Hg, Se, Ag. For TTLC, 21 metals were analyzed: Ag, Al, As, Ba, Be, Cd, Cr, Co, Cu, Fe, Hg, Li, Mn, Mo, Ni, Pb, Sb, Se, Tl, V, Zn. For TTLC, if the total concentration in the waste extract of any regulated metal equaled or exceeded the Soluble Threshold Limit Concentration (STLC), then those metals were analyzed using WET.
For TCLP or WET, 10 g of shredded battery material was placed into an extraction vessel, which was then placed in a rotary extractor for the specified time period (18 h for TCLP and 48 h for WET). Then, the resulting suspension was filtered using a 0.45 µm glass fiber filter. For TTLC, 1 g of 2 mm particles was added to a 250 mL vessel, then digested by repeated additions of HNO3, followed by a 30% H2O2 solution in water, as specified by EPA Method 3050B. The leachate was then filtered using a 0.45 µm filter and diluted to 50 mL.
For quality control purposes, a Mid-range Calibration Curve Standard (MRCCS), Calibration Blank (CB), Laboratory Control Standard (LCS), Method Blank (MB), Sample and Duplicate, and Matrix Spike were analyzed for each batch, and a Mid-range Calibration Verification Standard (MRCVS) and Calibration Blank (CB) were analyzed each 10 injections. Additionally, a duplicate sample battery was processed and analyzed on the most widely used battery model from each battery type, Li-ion, Li-poly, and smartphone, to assess the variability of the procedures.
Resource Depletion, Human Toxicity, and Ecotoxicity
The resource depletion and toxicity potentials from cellphone batteries were evaluated based on the results from the TTLC procedures and weighting factors for metals derived from established Life Cycle Impact Assessment (LCIA)-based and hazard-based assessment methods. Numerous LCIA tools have been developed, each with certain strengths or weaknesses. In this study, we selected LCIA tools that are consistent with regulatory “mid-point effects” characterization approaches that disaggregate environmental impact categories. This approach minimizes extrapolation of data and uncertainties associated with interactions among different impacts to produce an “end-point effect”.17,18 The resource depletion and toxicity potential for each metal were calculated using the following formula:
Pi = Ci · W · Wfi
Pi is a potential for metal i in the battery, where the potential is either: a life-cycle (midpoint) impact-based resource potential, a hazard-based occupational toxicity potential, a hazard-based TPI-derived toxicity potential, or an impact-based Tools for the Reduction and Assessment of Chemical and other environmental Impacts (TRACI) or Centre of Environmental Science (CML) method-derived human toxicity potential or ecotoxicity potential (Table C, Supporting Information). Ci is the concentration of metal i in the battery (kg/kg). W is the total weight of the battery (kg). Wfi is the weighting factor for the corresponding potential for metal i. Weighting factors were calculated according to the potential’s corresponding method.
For the midpoint impact-based abiotic resource depletion potential, we relied on the weighting factors for abiotic resources depletion potential derived from the CML 2001 and EPS 2000 methods, as previously described.18–20 For the hazard-based occupational toxicity potential, the weighting factors were derived by taking the inverse of the exposure limits, either the threshold limit value (TLV)-time weighted average (TWA),21 the permissible exposure limit (PEL)-TWA,21 or the reference exposure limit (REL)-TWA.21 For the hazard-based TPI-derived toxicity potential,22,23 the weighting factors are calculated using R-phase (hazardous substance declarations such as flammability, reactivity, and toxicity), water hazard class, maximum admissible concentration (MAK), European Union carcinogenity, and the technical guidance concentration (TRC) data, derived from the TPI calculator.22 We have recently described the conditions and assumptions required to harmonize TPI with similar models.24 For the impact-based toxicity potentials, the weighting factors for human toxicity, and ecotoxicity potential were calculated using the CML method and the Tool for the Reduction and Assessment of Chemicals and other environmental Impacts (TRACI).18,25
The hazard potentials evaluated are based on metal concentrations in the batteries and do not take into account the materials used in the manufacturing processes or the transport pathways for the metals in the landfill and incinerator facilities due to the lack of data on distribution ratios for metals into the flue gas and ashes, as noted previously.26 The average cumulative total potential within each battery type, Li-ion, Lipoly, or smartphone, is calculated to assess and compare potential human health and environmental impacts between the battery types.
RESULTS AND DISCUSSION
Metallic Contents of Li-ion Batteries
The results of TTLC assessment reported as milligrams of specific metal per kilogram of total battery material (Table 1) indicated that the three categories of batteries contained high levels of aluminum (ranging from 51 800 to 341 000 mg/kg), cobalt (ranging from 58 000 to 278 000 mg/kg), copper (ranging from 54 100 to 152 000 mg/kg), and lithium (ranging from 9800 to 37 200 mg/kg). Copper and aluminum are used as current conductors in the Li-ion batteries, and LiCoO2 is used as the cathode material.4 On average, these four metals accounted for 97.32% of the total metals (Table D of the Supporting Information). In comparison, the levels for nickel (ranging from 120 to 30 500 mg/kg), manganese (ranging from 5.93 to 3060 mg/kg), and iron (ranging from 254 to 24 500 mg/kg) were much lower and varied substantially according to whether the cathode material was combined with LiNiO2, LiMn2O4, LiFePO4, or Li(NiCo)-O2 or not.4 The other metals that were detected at very low levels were barium, chromium, silver, thallium, vanadium, zinc, and lead. Antimony, arsenic, beryllium, cadmium, mercury, molybdenum, and selenium were not detected in any of the analyzed lithium batteries. The combined weight of these metals corresponds to approximately one-half of the total lithium battery weight, with the remaining weight being accounted for by the anode material, electrolytes, diaphragm and plastic housing.
Table 1.
| element | TTLC threshold |
Li-ion-1 | Li-ion-2 | Li-ion-3 | Li-ion-4 | Li-ion-5 | Li-ion-6 | Li-ion-7 | Li-ion-8 | Li-poly-1 | Li-poly-2 | Li-poly-3 | Li-poly-4 | smart-1 | smart-2 | smart-3 | smart-4 |
|---|---|---|---|---|---|---|---|---|---|---|---|---|---|---|---|---|---|
| aluminum | N/A | 341000 | 62300 | 199000 | 198000 | 178000 | 183000 | 149000 | 246000 | 53870 | 51800 | 111000 | 115000 | 83700 | 83210 | 64300 | 65760 |
| antimony | 500 | ND | ND | ND | 142 | ND | ND | 11.9 | ND | ND | ND | 78.9 | ND | ND | ND | ND | ND |
| arsenic | 500 | ND | ND | ND | ND | ND | ND | ND | ND | ND | ND | ND | ND | ND | ND | ND | ND |
| barium | 10000 | 8240 | 660.4 | 17.5 | 32.4 | 31.2 | 411 | 44.5 | 72.7 | 96.3 | 86.1 | 50 | 37.3 | 1602 | 66.3 | 1008 | 1603 |
| beryllium | 75 | ND | ND | ND | ND | ND | ND | ND | ND | ND | ND | ND | ND | ND | ND | ND | ND |
| cadmium | 100 | ND | ND | ND | ND | ND | ND | ND | ND | ND | ND | ND | ND | ND | ND | ND | ND |
| chromium | 2500 | 17.6 | 8.65 | 9.35 | 11.1 | 24.3 | 25.9 | 95.5 | 22.4 | 11.8 | 9.33 | 19.7 | 28.3 | 15.4 | 9.55 | 11.2 | 12.8 |
| cobalt | 8000 | 140000 | 58000 | 66700 | 113000 | 220000 | 166000 | 130000 | 100000 | 220000 | 203000 | 164000 | 136000 | 241000 | 278000 | 165000 | 216000 |
| copper | 2500 | 95600 | 58400 | 95500 | 109000 | 145000 | 127000 | 96200 | 105000 | 152000 | 123000 | 76600 | 64500 | 96300 | 54100 | 75900 | 105000 |
| iron | N/A | 1010 | 1045 | 949 | 1290 | 2320 | 5910 | 672 | 24500 | 676 | 715 | 1150 | 994 | 383 | 460 | 254 | 239 |
| lead | 1000 | 105 | 210 | 22.1 | 644 | ND | ND | 503 | 241 | ND | ND | ND | ND | ND | ND | 20.76 | 33.72 |
| lithium | N/A | 16900 | 13900 | 9800 | 15700 | 27700 | 20900 | 23700 | 15000 | 29900 | 31200 | 19300 | 20900 | 34200 | 37200 | 26400 | 26000 |
| manganese | N/A | 3030 | 502 | 2120 | 1490 | 1040 | 1270 | 1130 | 3060 | 927 | 5.93 | 1160 | 508 | 11.2 | 798 | 11.7 | 63.4 |
| mercury | 20 | ND | ND | ND | ND | ND | ND | ND | ND | ND | ND | ND | ND | ND | ND | ND | ND |
| molybdenum | 3500 | ND | ND | ND | ND | ND | ND | ND | ND | ND | ND | ND | ND | ND | 84.2 | ND | ND |
| nickel | 2000 | 3040 | 29600 | 151 | 14100 | 6370 | 21900 | 1776 | 30500 | 575 | 301 | 18100 | 120 | 121 | 176 | 2274 | 23300 |
| selenium | 100 | ND | ND | ND | ND | ND | ND | ND | ND | ND | ND | ND | ND | ND | ND | ND | ND |
| silver | 500 | 15.2 | 2.97 | 5.12 | 14.7 | 96.8 | 36.1 | 49.1 | 35.8 | 31.5 | 9.02 | 21.2 | 7.23 | 72.7 | 12.3 | 5.22 | 75.6 |
| thallium | 700 | 204 | 77.3 | 90.6 | 177 | 333 | 244 | 185 | 151 | 315 | 296 | 234 | 216 | 457 | 481 | 268 | 361 |
| vanadium | 2400 | 26.4 | 22.19 | 18.3 | 19.4 | 17 | 18.6 | 8.87 | 30.3 | 8.71 | 7.94 | 10.8 | 12.5 | 15.6 | 14.2 | 9.04 | 11.1 |
| zinc | 5000 | 99.1 | 150 | 46.7 | 195 | 94.6 | 149 | 372 | 174 | 49.3 | 38.3 | 105 | 44.6 | 43.5 | 29.6 | 38.3 | 152 |
Cellular Phone Battery ID (Li-ion = lithium-ion, Li-poly = lithium polymer, smart = smartphone battery).
Inductively coupled plasma mass spectrometry. Concentrations in bold are above the regulatory limit. The unit of measurement is mg/kg of battery material.
N/A = not applicable.
ND = not detected.
Hazardous Waste Potential
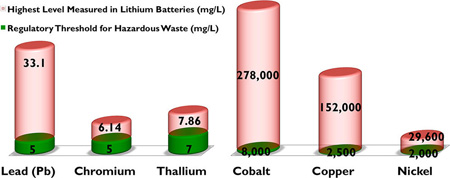
The results of the TTLC, TCLP, and WET metal leaching tests are presented in Tables 1, 2, and 3, respectively. The results show that all lithium batteries should be classified as hazardous waste under California regulations due primarily to excessive levels of cobalt and copper, and in some cases, nickel. These results provide new justification for lithium batteries to be included in California’s Universal Waste regulation consisting of seven categories of hazardous wastes that are widely produced by households and many different types of businesses, including electronic devices, nickel-cadmium batteries, electric lamps containing mercury, and nonempty aerosol cans.27 Moreover, according to U.S. regulations, some of the Li-ion batteries can be categorized as hazardous waste due to excessive levels of lead (Pb) (two of the eight Li-ion batteries exceeded the limit 5 mg/L: 6.71 mg/L and 33.10 mg/L), according to TCLP results. None of the Lipolymer and smartphone batteries exceeded the TCLP limit for Pb. Specifically, for the TTLC results, three metallic constituents, cobalt (limit 8000 mg/kg, ranging from 58 000 to 278 000 mg/kg), copper (limit 2500 mg/kg, ranging from 54 100 to 152000 mg/kg) and nickel (9 of all 16 batteries tested exceeded the limit 2000 mg/kg: range from 2274 to 30 500 mg/kg), exceeded the regulatory thresholds. In addition, for the WET procedure, some batteries exceeded the regulatory limits for chromium (1 of 16 exceeded the limit 5 mg/L: 6.14 mg/L), lead (1 of 16 exceeded the limit 5 mg/L: 5.57 mg/L), and thallium (2 of 16 exceeded the limit 7 mg/L: 7.86 and 7.61 mg/L).
Table 2.
Metallic Leachates from Lithium Batteries According to the Toxicity Characteristics Leaching Procedure (TCLP)a,b,c
| element | TCLP threshold | Li-ion-1 | Li-ion-2 | Li-ion-3 | Li-ion-4 | Li-ion-5 | Li-ion-6 | Li-ion-7 | Li-ion-8 | Li-poly-1 | Li-poly-2 | Li-poly-3 | Li-poly-4 | smart-1 | smart-2 | smart-3 | smart-4 |
|---|---|---|---|---|---|---|---|---|---|---|---|---|---|---|---|---|---|
| arsenic | 5.00 | ND | ND | ND | ND | ND | ND | ND | ND | ND | ND | ND | ND | ND | ND | ND | ND |
| barium | 100.00 | 0.13 | 0.21 | 0.25 | 0.11 | ND | 0.38 | 0.20 | 0.32 | 0.32 | 0.24 | 0.22 | 0.29 | 1.38 | 0.21 | 1.50 | 0.09 |
| cadmium | 1.00 | ND | ND | ND | ND | ND | ND | ND | ND | ND | ND | ND | ND | ND | ND | ND | ND |
| chromium | 5.00 | ND | ND | ND | ND | ND | ND | 0.24 | ND | ND | ND | 0.07 | 0.08 | 0.08 | ND | 0.12 | ND |
| lead | 5.00 | 3.41 | 1.57 | 4.22 | 6.71 | 0.06 | 0.11 | 33.10 | 1.13 | ND | ND | 0.07 | 0.10 | ND | ND | 0.05 | ND |
| mercury | 0.2 | ND | ND | ND | ND | ND | ND | ND | ND | ND | ND | ND | ND | ND | ND | ND | ND |
| selenium | 1 | ND | ND | ND | ND | ND | ND | ND | ND | ND | ND | ND | ND | ND | ND | ND | ND |
| silver | 5.00 | ND | ND | ND | ND | ND | ND | ND | ND | ND | ND | ND | ND | ND | ND | ND | ND |
Cellular phone battery ID (Li-ion = lithium-ion, Li-poly = lithium polymer, smart = smartphone battery).
Inductively coupled plasma mass spectrometry. Concentrations in bold are above the regulatory limit. The unit of measurement is mg/L.
ND = not detected.
Table 3.
| element | TCLP threshold | Li-ion-1 | Li-ion-2 | Li-ion-3 | Li-ion-4 | Li-ion-5 | Li-ion-6 | Li-ion-7 | Li-ion-8 | Li-poly-1 | Li-poly-2 | Li-poly-3 | Li-poly-4 | smart-1 | smart-2 | smart-3 | smart-4 |
|---|---|---|---|---|---|---|---|---|---|---|---|---|---|---|---|---|---|
| antimony | 15.00 | ND | ND | ND | ND | ND | ND | 0.36 | ND | ND | ND | 0.20 | ND | ND | ND | ND | ND |
| barium | 100.00 | 2.40 | 3.74 | ND | ND | ND | 3.07 | ND | 2.25 | 1.47 | 2.37 | ND | ND | 4.30 | ND | 5.71 | 5.08 |
| chromium | 5.00 | 0.52 | 0.62 | 0.24 | ND | 0.56 | 0.84 | 6.14 | 0.43 | 0.62 | 0.62 | 0.68 | 0.69 | 0.49 | 0.52 | 0.80 | 0.61 |
| lead | 5.00 | 1.10 | 1.07 | 0.66 | 0.82 | ND | ND | 5.57 | ND | ND | ND | ND | ND | ND | ND | ND | ND |
| nickel | 20.00 | ND | ND | ND | ND | ND | ND | 1.55 | ND | 3.16 | 6.19 | ND | 1.40 | 4.74 | 2.98 | ND | ND |
| silver | 5.00 | ND | ND | ND | ND | ND | ND | ND | ND | ND | ND | ND | ND | ND | ND | ND | ND |
| thallium | 7.00 | 5.17 | 5.29 | 7.86 | 7.61 | 5.78 | 6.62 | 5.61 | 2.05 | 3.09 | 3.02 | 1.88 | 1.00 | 1.86 | 1.97 | 2.02 | 1.36 |
| vanadium | 24.00 | ND | 0.16 | ND | 0.16 | 0.20 | 0.22 | ND | 0.33 | ND | ND | ND | ND | ND | 0.37 | ND | ND |
| zinc | 250.00 | ND | ND | ND | ND | ND | ND | 0.24 | ND | ND | ND | ND | ND | ND | ND | ND | ND |
Cellular phone battery ID (Li-ion = lithium-ion, Li-poly = lithium polymer, smart = smartphone battery).
Inductively coupled plasma mass spectrometry. Concentrations in bold are above the regulatory limit. The unit of measurement is mg/L.
ND = not detected.
Previous research on cellphones without batteries7 showed that Pb concentrations extracted by TCLP exceeded the regulation limit at an extremely high average concentration, 87.42 mg/L (range = 38.2–147.0 mg/L), more than 17 times of its regulation limit. However, in the current research, 12.5% cellphone batteries exceeded the regulation threshold, which supports results from other studies.8,9 The low levels of Pb leached from batteries could be due to the absence of Zn, Fe, and other metals that affect the mobility of Pb in the procedures.28
Table 2 shows that according to U.S. federal regulations, only Li-ion batteries qualify as hazardous waste, whereas Li-polymer and smartphone batteries do not. This finding is consistent with the WET results presented in Table 3. TTLC results reported in Table 1 show that all three categories of lithium batteries exceeded regulatory limits for Co and Cu, so all the lithium batteries tested could be classified as hazardous due to their Co and Cu content under CA regulation. However, only 75%, 50%, and 25% of the batteries exceeded the threshold for Ni content in Li-ion, Li-poly, and smartphone batteries, respectively. Specifically, the average concentrations of Co in Li-ion, Lipoly, and smartphone batteries were 124213 (σ = 52926), 180750 (σ = 37942), and 225000 (σ = 47420) mg/kg (limit 8000 mg/kg), respectively. The average concentrations of copper were 10 3963 (σ = 25408), 104 025 (σ = 40727), and 82 825 (σ = 22703) mg/kg (limit 2500 mg/kg), respectively, and for nickel, the average concentrations were 13430 (σ = 12507), 4774 (σ = 8886), and 6468 (σ = 11266) mg/kg (limit 2000 mg/kg), in Li-ion, Li-poly, and smartphone batteries, respectively. Correspondingly, the levels of Co, Cu, and Ni in Li-ion were at least an order of magnitude larger than those of Li-poly and smartphone batteries, and improvements in designfor-the-environment (DfE) strategies could focus on reducing the concentration of these three metals in lithium batteries.
Resource Depletion, Human Toxicity, and Ecotoxicity
The results of abiotic resource depletion potentials were based on the CML 2001 and EPS 2000 methods, and results of hazard-based human toxicity assessments were based on the TLV, PEL, REL, and TPI methods. Human toxicity potential from emission to air, water and soil, were based on the CML and TRACI methods. Freshwater ecotoxicity potentials from emission to air, water, and soil were based on the CML and TRACI methods. Terrestrial ecotoxicity potentials from emission to air, water, and soil were based on the CML method. The results of ecotoxicity potential from environmental emissions are presented in Figures S1–S12 (Supporting Information) respectively. For comparison, the average total potential within each battery type, Li-ion, Li-poly, and smartphone, for all resource depletion potential, human toxicity potential and ecotoxicity potential methods are shown in Table 4. Table 5 gives the average relative contribution, across all battery types, of each metal to the total resource depletion potential, total human toxicity potential, and total ecotoxicity potential for each method.
Table 4.
Average Total Potential, within each Battery Type, with One Standard Deviation (units vary by methodology), for All Resource Depletion Potential, Human Toxicity Potential, and Ecotoxicity Potential Methods with Life-Cycle Impact Assessment (LCIA)-Based Potentials Separated into Impact by Emission (Em.) to Air, Water, and Soil
| Li-ion |
Li-poly |
smart |
|||||
|---|---|---|---|---|---|---|---|
| impact category | method (units) | avg | std | avg | std | avg | std |
| abiotic resource depletion potential (LCIA-based) | EPS (ELU)a | 1.38 × 1000 | 3.72 × 10−01 | 1.58 × 1000 | 5.45 × 10−01 | 1.99 × 1000 | 3.04 × 10−01 |
| CML (kg Sb-eq)b | 6.79 × 10−06 | 2.18 × 10−06 | 5.77 × 10−06 | 2.37 × 10−06 | 6.20 × 10−06 | 2.96 × 10−06 | |
| human toxicity potential (hazard- based) | TPIc (TPI units) | 6.75 × 1004 | 8.86 × 1003 | 6.10 × 1004 | 2.29 × 1004 | 6.40 × 1004 | 1.80 × 1004 |
| PEL (m3)d | 1.55 × 1004 | 5.92 × 1003 | 9.96 × 1003 | 1.30 × 1003 | 1.21 × 1004 | 1.18 × 1003 | |
| REL (m3) | 1.88 × 1004 | 6.45 × 1003 | 1.40 × 1004 | 2.49 × 1003 | 1.77 × 1004 | 1.79 × 1003 | |
| TLV (m3) | 1.82 × 1004 | 5.56 × 1003 | 1.41 × 1004 | 2.48 × 1003 | 1.72 × 1004 | 1.73 × 1003 | |
| human toxicity potential (LCIA- based) | CML Em.Air (kg 1,4-DCB-eq) | 7.32 × 1001 | 1.79 × 1001 | 8.43 × 1001 | 2.46 × 1001 | 1.14 × 1002 | 2.04 × 1001 |
| CML Em.Water (kg 1,4-DCB-eq) | 1.40 × 1000 | 4.66 × 10−01 | 1.78 × 1000 | 4.73 × 10−01 | 2.85 × 1000 | 4.70 × 10−01 | |
| CML Em.Soil (kg 1,4-DCB-eq) | 1.68 × 1001 | 5.69 × 1000 | 2.19 × 1001 | 6.11 × 1000 | 3.35 × 1001 | 5.27 × 1000 | |
| TRACI Em.Air (CTUh)e | 1.84 × 10−07 | 9.69 × 10−08 | 7.03 × 10−08 | 2.58 × 10−08 | 1.04 × 10−07 | 7.40 × 10−08 | |
| TRACI Em.Water (CTUh) | 3.15 × 10−08 | 1.12 × 10−08 | 1.86 × 10−08 | 7.65 × 10−09 | 3.17 × 10−08 | 1.67 × 10−08 | |
| TRACI Em.Soil (CTUh) | 5.00 × 10−07 | 2.78 × 10−07 | 1.87 × 10−07 | 6.73 × 10−08 | 2.72 × 10−07 | 1.94 × 10−07 | |
| freshwater ecotoxicity (LCIA- based) | CML Em.Air (kg 1,4-DCB-eq)f | 2.63 × 1000 | 7.08 × 10−01 | 3.15 × 1000 | 9.90 × 10−01 | 4.17 × 1000 | 6.11 × 10−01 |
| CML Em.Water (kg 1,4-DCB-eq) | 1.40 × 1001 | 3.78 × 1000 | 1.68 × 1001 | 5.30 × 1000 | 2.22 × 1001 | 3.22 × 1000 | |
| CML Em.Soil (kg 1,4- DCB-eq) | 7.00 × 1000 | 1.88 × 1000 | 8.40 × 1000 | 2.64 × 1000 | 1.11 × 1001 | 1.63 × 1000 | |
| TRACI Em.Air (CTUe)g | 6.42 × 1001 | 1.14 × 1001 | 6.16 × 1001 | 2.74 × 1001 | 5.95 × 1001 | 1.70 × 1001 | |
| TRACI Em.Water (CTUe) | 1.54 × 1002 | 2.71 × 1001 | 1.48 × 1002 | 6.55 × 1001 | 1.42 × 1002 | 4.07 × 1001 | |
| TRACI Em.Soil (CTUe) | 8.11 × 1001 | 1.43 × 1001 | 7.78 × 1001 | 3.46 × 1001 | 7.51 × 1001 | 2.15 × 1001 | |
| terrestrial ecotoxicity (LCIA- based) | CML Em.Air (kg 1,4-DCB-eq) | 3.81 × 10−01 | 1.11 × 10−01 | 4.73 × 10−01 | 1.36 × 10−01 | 6.55 × 10−01 | 1.03 × 10−01 |
| CML Em.Water (kg 1,4-DCB-eq) | 8.40 × 10⁻²¹ | 2.88 × 10⁻²¹ | 1.11 × 10⁻²⁰ | 3.29 × 10⁻²¹ | 1.56 × 10⁻²⁰ | 2.28 × 10⁻²¹ | |
| CML Em.Soil (kg 1,4-DCB-eq) | 7.63 × 10−01 | 2.22 × 10−01 | 9.46 × 10−01 | 2.72 × 10−01 | 1.31 × 1000 | 2.06 × 10−01 | |
ELU = Environmental Load Units.
kg Sb-eq = kg Antimony equivalent.
TPI = Toxicological Potential Indicator Units.
m3 = inverse of the occupational exposure limit
CTUh = comparative toxicity units (human toxicity)
kg 1,4-DCB-eq = kg 1,4-dichlorobenzene equivalent
CTUe = comparative toxicity units (ecotoxicity).
Table 5.
Average Relative Contribution, Across All Battery Types, of Each Metal to the Total Potential for All Resource Depletion Potential, Human Toxicity Potential, and Ecotoxicity Potential Methodsa,b,c,d
| method |
|||||||||||||||
|---|---|---|---|---|---|---|---|---|---|---|---|---|---|---|---|
| ecotoxicity potential (LCIA based) |
|||||||||||||||
| human toxicity potential (LCIA based) |
Freshwater |
terrestrial |
|||||||||||||
| Abioticre source depletion potential (LCIA basec |
human toxicity potential (hazard based |
CML | TRACI | CML | TRACI | CML | |||||||||
| element | EPS | CML | TLV | PEL | REL | TPI | EmAir | Em.H20 | Em.Soil | EmAir | Em.H20 | Em.Soil | Em.AH | EmAll | EmAll |
| aluminum | 0.1% | − | 32.8% | 42.3% | 32.1% | 4.0% | N/A | N/A | N/A | N/A | N/A | N/A | N/A | N/A | N/A |
| antimony | 0.2% | 4.1% | − | − | − | − | − | 0.1% | − | − | 0.3% | − | − | − | − |
| arsenic | ND | ND | ND | ND | ND | ND | ND | ND | ND | ND | ND | ND | ND | ND | ND |
| barium | − | − | 0.2% | 2.5% | 1.9% | 0.1% | − | 0.6% | − | 0.8% | 5.7% | 0.3% | − | − | − |
| beryllium | ND | ND | ND | ND | ND | ND | ND | ND | ND | ND | ND | ND | ND | ND | ND |
| cadmium | ND | ND | ND | ND | ND | ND | ND | ND | ND | ND | ND | ND | ND | ND | ND |
| chromium | − | − | 0.1% | − | − | − | − | − | − | − | − | − | − | − | 0.2% |
| cobalt | 63.7% | 2.0% | 51.2% | 35.3% | 50.4% | 17.7% | 79.2% | 20.3% | 41.9% | N/A | N/A | N/A | 79.0% | 12.2% | 92.0% |
| copper | 30.0% | 74.6% | 14.2% | 19.1% | 13.9% | 65.6% | 16.1% | 0.2% | 1.0% | 33.5% | 8.9% | 35.5% | 16.4% | 85.4% | 2.3% |
| iron | − | − | 0.3% | − | 0.1% | 0.1% | N/A | N/A | N/A | N/A | N/A | N/A | N/A | N/A | N/A |
| lead | − | 0.4% | − | − | 0.8% | 0.1% | − | − | − | 8.1% | 0.7% | 8.5% | − | − | − |
| lithium | − | 0.1% | N/A | N/A | N/A | 5.4% | N/A | N/A | N/A | N/A | N/A | N/A | N/A | N/A | N/A |
| manganese | − | − | 0.6% | − | 0.1% | 0.1% | N/A | N/A | N/A | N/A | N/A | N/A | N/A | N/A | N/A |
| mercury | ND | ND | ND | ND | ND | ND | ND | ND | ND | ND | ND | ND | ND | ND | ND |
| molybdenum | − | 0.2% | − | − | − | − | − | − | − | 0.6% | 0.1% | 0.6% | − | − | − |
| nickel | 2.3% | 0.4% | 0.1% | 0.1% | 0.3% | 6.5% | 4.4% | 4.2% | 3.0% | 7.7% | 21.0% | 5.6% | 4.1% | 2.0% | 4.4% |
| selenium | ND | ND | ND | ND | ND | ND | ND | ND | ND | ND | ND | ND | ND | ND | ND |
| silver | 2.1% | 18.3% | − | − | − | − | N/A | N/A | N/A | 15.6% | 0.9% | 16.8% | N/A | 0.1% | N/A |
| thallium | 1.5% | 0.4% | 0.6% | 0.4% | 0.4% | 0.3% | 74.5% | 54.0% | 5.9% | 51.4% | 2.8% | 0.3% | 0.2% | 0.9% | |
| vanadium | − | − | − | − | − | − | − | 0.1% | − | − | 0.3% | − | 0.2% | − | − |
| zinc | − | − | − | − | − | 0.1% | − | − | − | 27.7% | 10.7% | 29.8% | 0.3% | 0.1% | − |
ND = not detected.
N/A = not applicable.
LCIA = life-cycle impact assessment; Em.Air = potential from emission to air; Em.H20 = Potential from emission to water; Em.Soil = potential from emission to soil; Em All = potential from average across emission to air, water, and soil.
Bold font = ≥ 30%, italic font = 5.0% to <30%, bold italic font = 1.0% to <5.0%, regular font = 0.1% to <1.0%, − = < 0.1%.
Total resource depletion potential, human toxicity potential, and ecotoxicity potential for each battery were calculated by summing the potentials for each individual metal in each battery. Then, the average total potential within each battery type, Li-ion, Li-poly, and smartphone, were calculated with one standard deviation for all resource depletion potential, human toxicity potential, and ecotoxicity potential methods (Table 4). All the total potentials were within one standard deviation of each other, except for in the CML method, where smartphone batteries show a slightly higher than one standard deviation total potential than the Li-ion batteries for the total human toxicity potential and total ecotoxicity potential. For freshwater ecotoxicity, the average of all relative contributions for all metals, across emission to air, water, and soil, has one standard deviation of less than 0.5%. For terrestrial ecotoxicity, the average of all relative contributions for all metals have one standard deviation of less than 0.1%, except for cobalt, with one standard deviation of 2.3%, copper, with one standard deviation of 0.7%, and nickel, with one standard deviation of 1.5%.
Cobalt, copper, and nickel are the main contributors to the total hazard potential for all assessment methods used (Table 5). Cobalt contributed to the total potential across all resource depletion potential, human toxicity potential, and ecotoxicity potential methods, except in the results collected through TRACI for human toxicity potential, which does not include toxicity data for cobalt. Cobalt has a large, and oftentimes majority relative contribution to the total hazard potential in all results generated by nearly all the methods, with only three methods producing results of moderate hazard potential contribution, namely, the TPI method, CML method for human toxicity potential from emission to water, and the TRACI method for freshwater ecotoxicity potential. The only method that produced results of a small relative hazard potential for Co (∼2%) is the CML method for abiotic resource depletion potential, which attributes the majority of the contribution of the total potential to copper (∼75%), and most of the remainder (∼18%), of the total resource depletion potential to silver. Similarly, copper has a mostly large to medium relative contribution to the total potential across all methods, only showing a minimal contribution for the human toxicity potential from emission to water based on the CML method. While nickel does not show large contributions for any method, nickel is present as a nontrivial contributor to the total potential for all methods, showing minimal, small, and medium contributions across all methods, notably exhibiting medium contributions to the total human toxicity potential for the TRACI method.
Thallium and silver were the metals, after cobalt, copper, and nickel, with the most prevalent relative contributions to the total potentials across the methods. Both thallium and silver had sizable relative contributions to abiotic resource depletion and human toxicity potential, with thallium notably having large relative contributions regarding human toxicity potentials, and silver notably having medium relative contributions to the human toxicity potential for TRACI. Zinc, lead, barium, and antimony, which all had sufficient toxicity data for all methods, were the only other metals that showed small or greater relative contributions to the total potential for any of the methods. Specifically, Zn, Pb, and Ba have medium relative contributions in the human toxicity potential for TRACI, barium has small relative contributions in the hazard based human toxicity potential for the PEL and REL method, and antimony has a small relative contribution to resource depletion potential for the CML method. Both aluminum and lithium show medium relative contributions to the hazard based human toxicity potential; however, their relative contribution to all the human toxicity potentials and ecotoxicity potentials could not be estimated due to insufficient aluminum and lithium toxicity data in CML and TRACI.
Results of this research indicate that rechargeable lithium based batteries associated with portable electronic products are potential sources of hazardous metal pollutants in the environment. These metal pollutants can adversely impact environmental quality and human health, particularly in regions of the world that lack infrastructure for solid waste collection, sorting, and recycling. This study has identified metals, Co, Cu, Ni, and Pb that, under simulated landfill conditions, would leach out concentrations that would exceed regulatory limits, thereby rendering their respective lithium batteries hazardous under U.S. federal and state laws. These results call for increased coordination of regulatory policies to support the recycling of portable rechargeable batteries, and for improved DfE strategies to reduce the levels of hazardous chemical components of consumer electronic products.
Supplementary Material
ACKNOWLEDGMENTS
This research was supported by a grant from the NSF’s Biocomplexity in the Environment, Materials Use: Science, Engineering, and Society (MUSES) Program (DMII 0223894), the UC Systemwide Research and Education in Green Materials (UC 44157), and the National Center for Advancing Translational Sciences, National Institutes of Health, through Grant No. UL1 TR000153.
Footnotes
ASSOCIATED CONTENT
Supporting Information
Four tables and twelve figures. This material is available free of charge via the Internet at http://pubs.acs.org.
The authors declare no competing financial interest.
REFERENCES
- 1.BCC Research. Lithium Batteries: Markets and Materials. Wellesley, MA: BCC Research, LLC; Oct, 2009. available online: http://www.bccresearch.com/report/lithium-batteries-markets-materials-fcb028e.html. [Google Scholar]
- 2.U.S. Environmental Protection Agency. Introduction to Hazardous Waste Identification (40 CFR Parts 261), EPA530-K-05-012. Washington, DC: US EPA; Sep, 2005. available online: http://www.epa.gov/osw/inforesources/pubs/training/hwid05.pdf. [Google Scholar]
- 3.Ogunseitan O, Schoenung J, Saphores J-D, Shapiro A. The Electronics Revolution: From E-Wonderland to E-Wasteland. Science. 2009;326:670–671. doi: 10.1126/science.1176929. [DOI] [PubMed] [Google Scholar]
- 4.Xu JQ, Thomas HR, Francis RW, Lum KR, Wang JR, Liang B. A review of processes and technologies for recycling of lithium-ion secondary batteries. J. Power Sour. 2008;177:512–527. [Google Scholar]
- 5. [(Accessed March 14, 2013)];U.S. Code of Federal Regulations (49 CFR 173.185, Lithium Cells and Batteries) http://www.gpo.gov/fdsys/pkg/CFR-2010-title49-vol2/pdf/CFR-2010-title49-vol2-sec173-185.pdf.
- 6.Schoenung J, Ogunseitan O, Saphores JD, Shapiro A. Adopting lead-free electronics: Policy differences and knowledge gaps. J. Ind. Ecol. 2005;8:59–85. [Google Scholar]
- 7.Lincoln J, Ogunseitan O, Shapiro A, Saphores J. Leaching assessments of hazardous materials in cellular telephones. Environ. Sci. Technol. 2007;41(7):2572–2578. doi: 10.1021/es0610479. [DOI] [PubMed] [Google Scholar]
- 8.Musson E, Vann K, Jang Y, Mutha S, Jordan A, Pearson B, Townsend T. RCRA toxicity characterization of discarded electronic devices. Environ. Sci. Technol. 2006;40:2721–2726. doi: 10.1021/es051557n. [DOI] [PubMed] [Google Scholar]
- 9.Nnorom I, Osibanjo O. Heavy metal characterization of waste portable rechargeable batteries used in mobile phones. Int. J. Environ. Sci. Technol. 2009;6(4):641–650. [Google Scholar]
- 10.Gaines L, Sullivan J, Burnham A, Belharouak L. Life-cycle analysis of production and recycling of lithium ion batteries. Transp. Res. Rec. 2011;2252:57–65. [Google Scholar]
- 11.Majeau-Bettez G, Hawkins T, Stromman A. Life-cycle environmental assessment of lithium-ion and nickel metal hydride batteries for plug-in hybrid and battery electric vehicles. Environ. Sci. Technol. 2011;45(10):4548–4554. doi: 10.1021/es103607c. [DOI] [PubMed] [Google Scholar]
- 12.Notter D, Gauch M, Widmer R, Wager P, Stamp A, Zah R, Althaus HJ. Contribution of Li-ion batteries to the environmental impact of electric vehicles. Environ. Sci. Technol. 2010;44(17):6550–6556. doi: 10.1021/es903729a. [DOI] [PubMed] [Google Scholar]
- 13.Van den Bossche P, Vergels F, Van Mierlo J, Matheys J, Van Autenboer W. SUBAT: An assessment of sustainable battery technology. J. Power Sources. 2006;162:913–919. [Google Scholar]
- 14.US EPA. Method 1311: Toxicity Characteristic Leaching Procedure. Washington, DC: US EPA; [(accessed Feb. 6, 2013)]. available online: www.epa.gov/sw-846/pdfs/1311.pdf. [Google Scholar]
- 15.California DTSC. Waste Extraction Test (WET) Procedures. Sacramento, CA: State of California; 2005. [(accessed Feb. 6, 2013)]. available online: http://www.dtsc.ca.gov/LawsRegsPolicies/Title22/upload/OEARA_REG_Title22_Ch11_AppII.pdf. [Google Scholar]
- 16.California DTSC. SB20 Report: Determination of Regulated Elements in Discarded Laptop Computers, LCDMonitors, Plasma TVs, and LCD TVs. Sacramento, CA: State of California; 2004. [(accessed Feb. 6, 2013)]. available online: http://www.dtsc.ca.gov/hazardouswaste/ewaste/upload/hwmp_rep_sb20_lcd.pdf. [Google Scholar]
- 17.US EPA. Life cycle impact assessment. Chapter 4. Washington, DC: US EPA; 2006. [(accessed March 17, 2013)]. http://www.epa.gov/nrmrl/std/lca/pdfs/chapter4lca101.pdf. [Google Scholar]
- 18.(a) European Commission. [(accessed March 18, 2013)];ILCD Handbook. 2010 http://lct.jrc.ec.europa.eu/pdf-directory/ILCD-Handbook-LCIA-Background-analysis-online-12March2010.pdf.; (b) Life Cycle Assessment: An Operational Guide to the ISO Standards. Ministry of Housing, Spatial Planning, and the Environment, Netherlands. The Netherlands: Center of Environmental Science, Leiden University; 2001. [Google Scholar]
- 19.Steen B. A Systematic Approach to Environmental Priority Strategies in Product Development (EPS). Version 2000, Models and Data of the Default Method, CPM Report 1999:5. Johanneberg, Sweden: Centre for Environmental Assessment of Products and Material Systems; 1999. [Google Scholar]
- 20.Lim S-R, Kang D, Ogunseitan OA, Schoenung JM. Potential environmental impacts from the metals in incandescent, compact fluorescent lamp (CFL), and light-emitting diode (LED) bulbs. Environ. Sci. Technol. 2012;47:1040–1047. doi: 10.1021/es302886m. [DOI] [PubMed] [Google Scholar]
- 21.American Conference of Industrial Hygienists (ACGIH) 2009 Guide to Occupational Exposure Values. Cincinnati, OH: ACGIH; 2009. [Google Scholar]
- 22.Fraunhofer IZM Toxic Potential Indicator (TPI) Calculator. [(Accessed Feb. 6, 2013)]; http://www.izm.fraunhofer.de/content/dam/izm/de/documents/Abteilungen/Environmental_Reliability_Engineering/Forschungsschwerpunkte/ToxicalPotentialIndicator_TPI/Description_TPI_Calculator.pdf.
- 23.Yen SB, Chen JL. Calculation of a toxic potential indicator via Chinese-language material safety data sheets. J. Ind. Ecol. 2009;13(3):455. [Google Scholar]
- 24.Lam CW, Aguirre MP, Schischke K, Nissen NF, Ogunseitan OA, Schoenung JM. International harmonization of models for selecting less toxic chemical alternatives: Effect of regulatory disparities in the U.S. and Europe. Integr. Environ. Assess. Manage. 2012;8(4):723–730. doi: 10.1002/ieam.1305. [DOI] [PubMed] [Google Scholar]
- 25.Bare JC, Norris GA, Pennington DW, McKone T. TRACI: The tool for the reduction and assessment of chemical and other environmental impacts. J. Ind. Ecol. 2002;6(3–4):49–78. [Google Scholar]
- 26.Lim S-R, Schoenung JM. Human health and ecological toxicity potentials due to heavy metal content in waste electronic devices with flat panel displays. J. Hazard. Mater. 2010;117:251–259. doi: 10.1016/j.jhazmat.2009.12.025. [DOI] [PubMed] [Google Scholar]
- 27.California DTSC. Universal Waste Fact Sheet. Sacramento, CA: State of California; [(accessed March 17, 2013)]. http://www.dtsc.ca.gov/HazardousWaste/UniversalWaste/upload/UW_Factsheet1.pdf. [Google Scholar]
- 28.Vann K, Musson S, Townsend T. Factors affecting TCLP lead leachability from computer CPUs. Waste Manage. 2006;26:293–298. doi: 10.1016/j.wasman.2005.06.016. [DOI] [PubMed] [Google Scholar]
Associated Data
This section collects any data citations, data availability statements, or supplementary materials included in this article.