The mammalian microbiome plays many important roles in health and disease1,2, and genetic engineering is enabling the development of microbial therapeutics and diagnostics 3–7. A key determinant of the activity of both natural and engineered microbes in vivo is their location within the host organism8,9. However, existing methods for imaging cellular location and function, primarily based on optical reporter genes, have limited deep tissue performance due to light scattering or require radioactive tracers10–12. Here we introduce acoustic reporter genes – genetic constructs that allow bacterial gene expression to be visualized in vivo using ultrasound, a widely available, inexpensive technique with deep tissue penetration and high spatial resolution 13–15. These constructs are based on gas vesicles, a unique class of gas-filled protein nanostructures expressed primarily in water-dwelling photosynthetic organisms as a means to regulate buoyancy16,17. Heterologous expression of engineered gene clusters encoding gas vesicles allows E. coli and S. typhimurium to be imaged noninvasively at volumetric densities below 0.01% with sub-100 µm resolution. We demonstrate the imaging of engineered cells in vivo in proof-of-concept models of gastrointestinal and tumor localization, and develop acoustically distinct reporters enabling multiplexed imaging of cellular populations. This technology equips microbial cells with a means to be seen deep inside mammalian hosts, facilitating the study of the mammalian microbiome and the development of diagnostic and therapeutic cellular agents.
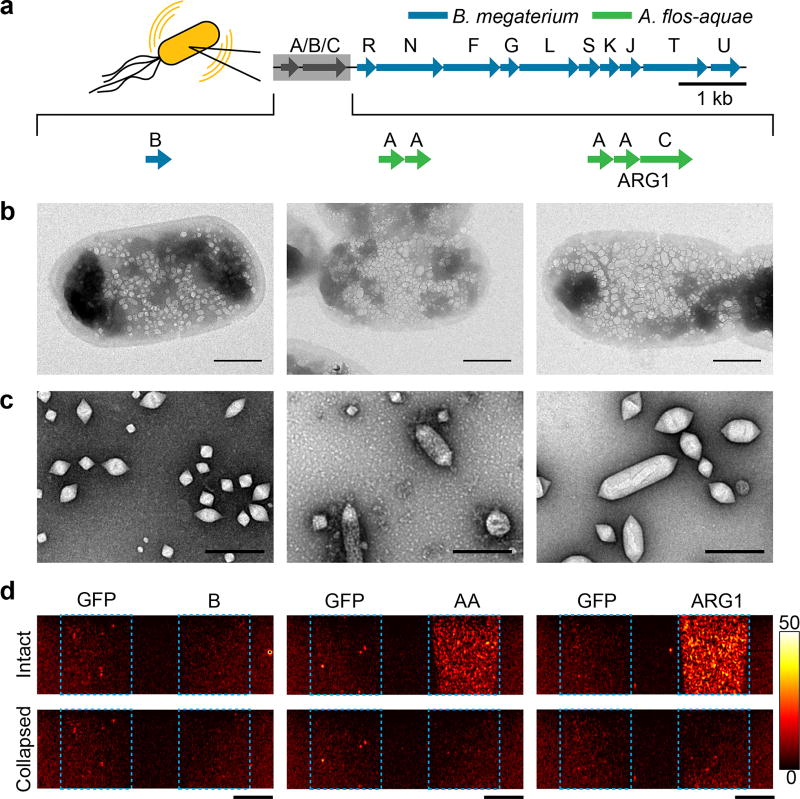
Gas vesicles comprise all-protein shells with sizes on the order of 200 nm that enclose hollow interiors, allowing dissolved gases to freely permeate in and out while excluding water16. We recently discovered the ability of these proteins to scatter sound waves and thereby produce ultrasound contrast18. However, the ability of the multi-gene clusters encoding gas vesicles to serve as reporter genes in heterologous species has not been demonstrated. Gas vesicles are encoded in their native bacterial or archaeal hosts by operons of 8–14 genes, which include the primary structural protein GvpA, the optional external scaffolding protein GvpC, and several secondary proteins that function as essential minor constituents or chaperones 17. As a starting point for developing ARGs, we chose a compact E. coli-compatible gas vesicle gene cluster from Bacillus megaterium 19 (Fig. 1a, top, left). While cells containing this construct were able to produce small, bicone-shaped gas vesicles (Fig. 1, b–c, left), its expression did not result in bacteria detectable by ultrasound (Fig. 1d, left), most likely because the small gas vesicles produced from this construct have weak acoustic scattering. At the same time, transforming E. coli with a gas vesicle gene cluster derived from the cyanobacterium Anabaena flos-aquae, whose gas vesicles are highly echogenic 18,20, did not result in gas vesicle expression. Given the high sequence homology of GvpA between organisms (Extended Data Fig. 1), we hypothesized that a combination of the structural GvpA genes from A. flos-aquae with the accessory genes GvpR-U from B. megaterium (Fig. 1a, middle) would result in the formation of gas vesicles with characteristics favorable for ultrasound imaging. Indeed, expression of this engineered gene cluster resulted in E. coli containing gas vesicles with significantly larger dimensions compared to the B. megaterium operon, and these nanostructures appeared to occupy a greater fraction of intracellular volume (Fig. 1, b–c, middle). Strikingly, these cells produced robust ultrasound contrast compared to green fluorescent protein (GFP) controls (Fig. 1d, middle). Further engineering comprising the addition of a gene encoding the A. flos-aquae scaffolding protein GvpC (Fig. 1a, right) resulted in wider and more elongated gas vesicles more closely resembling those native to A. flos-aquae 18 (Fig. 1, b–c, right), and generated stronger ultrasound contrast (Fig. 1d, right). We refer to this optimized genetically engineered construct as acoustic reporter gene 1 or ARG1.
Fig. 1. Genetic engineering of acoustic reporter genes.
(a) Architecture of acoustic reporter gene clusters. Panels (b)–(f) are organized in columns corresponding to each of these constructs. (b) TEM images of representative E. coli cells expressing each construct. (c) TEM images of gas vesicles isolated from E. coli expressing each construct. (d) Ultrasound images of agarose phantoms containing E. coli expressing each construct or GFP. The cell concentration is 109 cells/ml. Images in bottom panels were acquired after acoustic collapse. Blue outlines indicate the location of each specimen. Color bar represents linear signal intensity. Scale bars represent 500 nm in (b), 250 nm in (c) and 2 mm in (d). All imaging experiments were repeated 3 times with similar results.
To confirm that the ultrasound signal from ARG1-expressing cells is due to the presence of gas vesicles, we applied acoustic pulses with amplitudes above the gas vesicles’ critical collapse pressure20. In purified form, this results in the immediate collapse of these protein nanostructures and dissolution of their gas contents, eliminating ultrasound contrast 18,20. As expected, the application of high-pressure pulses made cells expressing ARG1 invisible to ultrasound (Fig. 1d). The ability of ARG-based contrast to be erased in situ is used throughout this study to confirm the source of acoustic signals and subtract background.
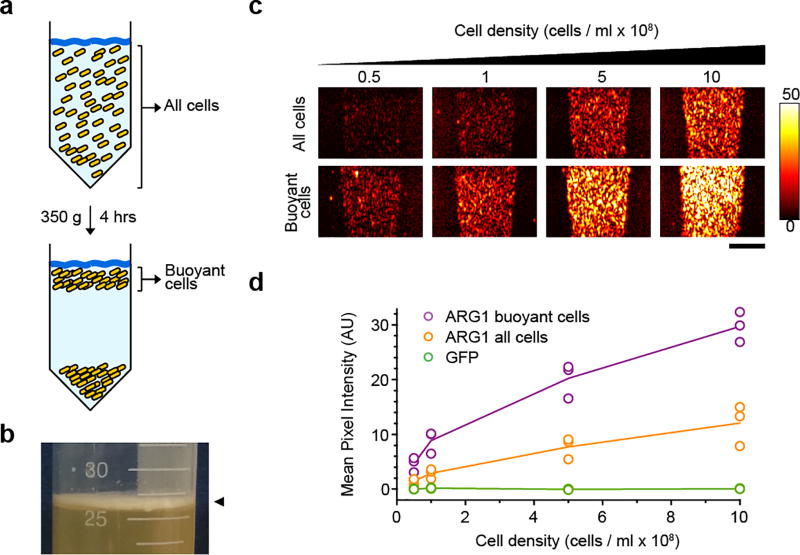
ARG1 expression resulted in average gas vesicle contents of 9.4 ± 0.4 mg/g E. coli (N=3, ±SEM), corresponding to approximately 100 gas vesicles per cell. These nanostructures occupy roughly 10 percent of the intracellular space. Acoustically silent cells expressing the B. megaterium gene cluster produced a similar quantity of gas vesicle proteins (9.7 ± 1.5 mg/g, N=3, ±SEM), underscoring the importance of genetic engineering in producing intracellular nanostructures with the appropriate size and shape to be detected with ultrasound. A fraction of ARG1-expressing cells was buoyant in aqueous media (Extended Data Fig. 2, a–b), suggesting that gas vesicles occupy more than 10% of their volume. However, the expected buoyant force on these cells, even at much higher expression levels, is weak compared to other forces such as flagellar thrust (Supplementary Table 1).
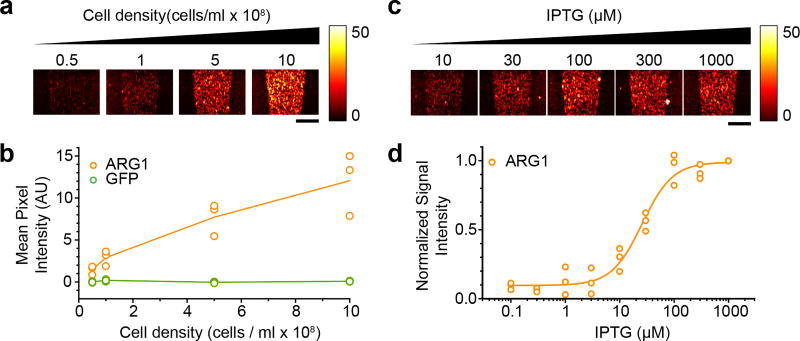
To determine the detection limit of ARG-expressing cells, we imaged a concentration series of E. coli transformed with ARG1 (Fig. 2a). Cells at concentrations as low as 5 × 10⁷ cells/ml produced detectable signal (Fig. 2, a–b). This equates to a roughly 0.005% volume fraction, or approximately 100 cells per voxel based on cubic voxel dimensions of 100 µm. This sensitivity should be sufficient for many in vivo scenarios 21. Furthermore, bacteria enriched for buoyancy prior to imaging provide 2.4-fold higher signal (Extended Data Fig. 2, c–d), suggesting that sensitivity could be improved further by optimizing ARG expression.
Fig. 2. Imaging dilute bacterial populations and dynamically regulated gene expression.
(a) Ultrasound images of ARG1-expressing E. coli at various cellular concentrations, before and after acoustic collapse. (b) Mean ultrasound contrast from E. coli expressing ARG1 and GFP at various cell densities. N=3 biological replicates per sample; lines show the mean. (c) Ultrasound images of E. coli expressing ARG1 after induction with various IPTG concentrations. Cell concentration was 5 × 10⁸ cells/ml. (d) Normalized ultrasound contrast as a function of IPTG concentration. N=3 biological replicates per sample. Line shows a fit of the data with the Hill equation to facilitate visualization. Scale bars represent 2 mm. Each imaging experiment was repeated 3 times with similar results.
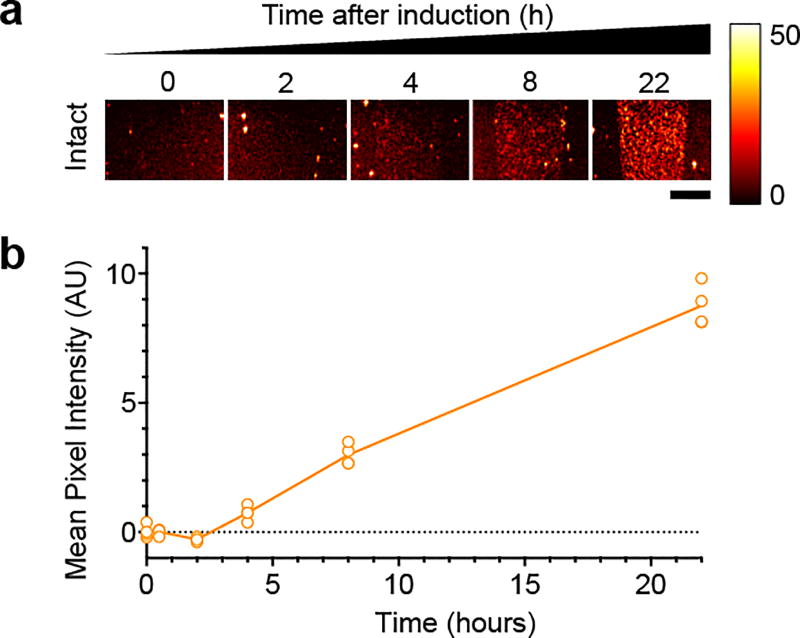
To test whether ARGs could provide a readout of state-dependent genetic pathways, we placed ARGs under the control of a promoter regulated by the chemical inducer isopropyl β-D-1-thiogalactopyranoside (IPTG). Ultrasound signals from E. coli expressing ARG1 in this configuration followed the expected dose-response curve of IPTG-controlled expression (Fig. 2, c–d), confirming their ability to serve as the output signal for engineered genetic circuits. Significant ultrasound contrast could be observed 4 hours after IPTG induction (p-value = 0.01, N=4), and continued to increase during the 22-hour culturing period (Extended Data Fig. 3).
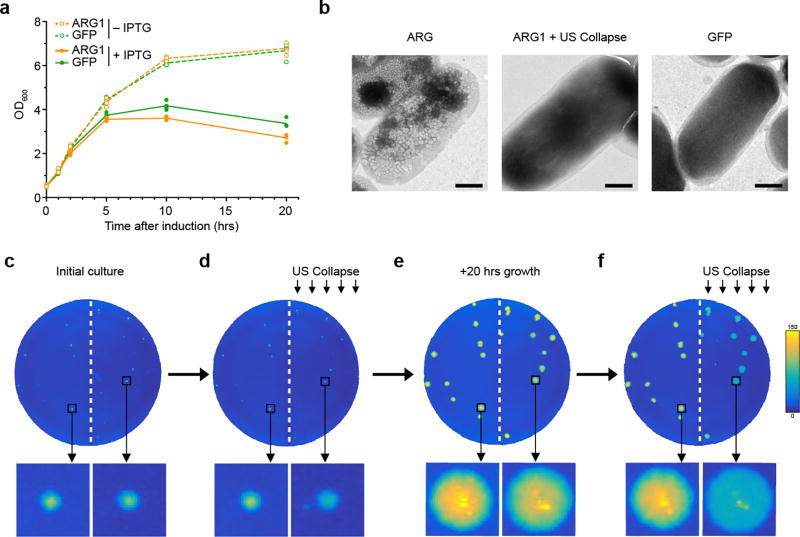
To determine whether the expression of ARGs has any deleterious effect on host cells, we measured the growth curves of E. coli expressing ARG1 or GFP. After induction, cells expressing both constructs continued to divide and reached similar saturation densities (Extended Data Fig. 4a). For both ARG1 and GFP the final density was somewhat lower than in uninduced controls, as expected from the metabolic demand of protein expression22. We also assessed the viability of ARG-expressing cells after ultrasound imaging and acoustic collapse. TEM images of cells acquired before and after exposure to collapsing acoustic pulses show that gas vesicles can be eliminated without obvious cellular damage (Extended Data Fig. 4b). To examine the impact of ultrasound exposure on cell growth, we cultured E. coli expressing ARG1 as colonies on solid media and applied acoustic collapse pulses to half the plate. Gas vesicle collapse in insonated cells was confirmed by a decrease in optical scattering (Extended Data Fig. 4, c–d). After incubation for an additional 20 hours, no significant difference was observed in the diameter of the insonated colonies compared to un-insonated controls, indicating that ultrasound exposure does not affect cell viability (Extended Data Fig. 4e). Strikingly, insonated colonies re-expressed gas vesicles during this period, as indicated by the restoration of pressure-sensitive light scattering (Extended Data Fig. 4, e–f).
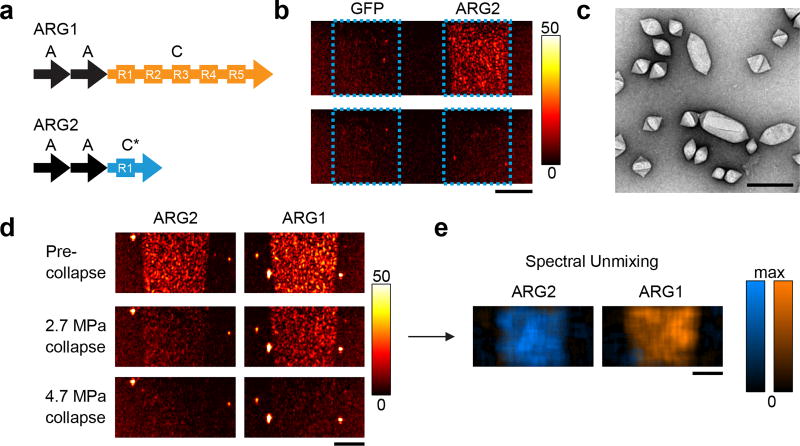
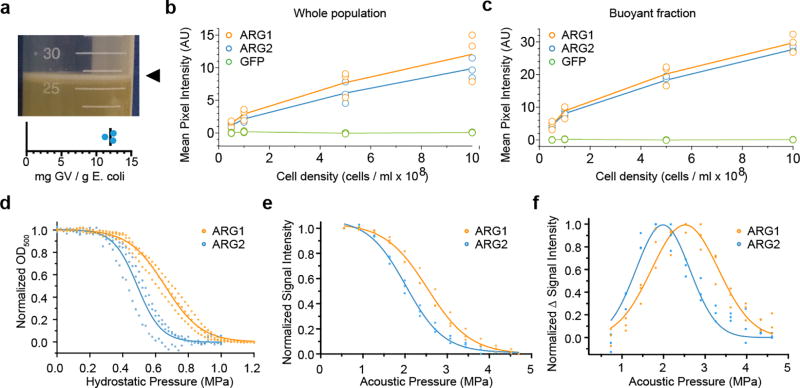
It is often informative to simultaneously image more than one population of cells, as done optically using spectrally distinct fluorescent proteins. Analogous acoustic multiplexing can be performed using genetic variants of gas vesicles that collapse at different pressures using multiple images acquired during sequential application of increasing pressure pulses (Supplementary Note 1) 20. To explore whether this could be done with ARGs, we constructed a new version of the ARG gene cluster containing a modified version of A. flos-aquae GvpC. Deletion or truncation of this outer scaffolding protein results in gas vesicles with lower collapse pressures 23, allowing the production of nanostructures distinguishable from each other under ultrasound 20. Following this approach, we modified our gene cluster by truncating GvpC to retain only one of its five repeating alpha-helical domains (Fig. 3a). E. coli expressing the resulting gene cluster, which we refer to as ARG2, showed robust gas vesicle production and ultrasound contrast, similar to ARG1 (Fig. 3, b–c, Extended Data Fig. 5, a–c). Consistent with our design, gas vesicles purified from ARG2-expressing E. coli had a lower critical hydrostatic collapse pressure than nanostructures formed by cells expressing ARG1 (Extended Data Fig. 5d), and cellular ARG2 contrast was erasable at lower acoustic pressures (Extended Data Fig. 5e). The two variants’ distinct collapse spectra (Extended Data Fig. 5f) allowed E. coli expressing ARG1 and ARG2 to be imaged in multiplex using pressure spectrum unmixing (Fig. 3, d–e).
Fig. 3. Multiplexed imaging of genetically engineered reporter variants.
(a) Diagram of the GvpA and GvpC sequences included in the ARG1 and ARG2 gene clusters. (b) Ultrasound images of a gel phantom containing E. coli expressing ARG2 or GFP (109 cells/ml). Blue outlines indicate the location of each specimen. (c) Transmission electron micrographs of isolated ARG2 gas vesicles. (d) Ultrasound images of gel phantoms containing ARG1 or ARG2 before collapse, after collapse at 2.7 MPa and after collapse at 4.7 MPa (109 cells / mL). (e) Overlay of the blue and orange-colored maps from spectral unmixing of ARG2 and ARG1, based on the series of images in (d). Scale bars represent 2 mm in (b), (d), (e) and 250 nm in (c). Each imaging experiment was repeated 3 times with similar results.
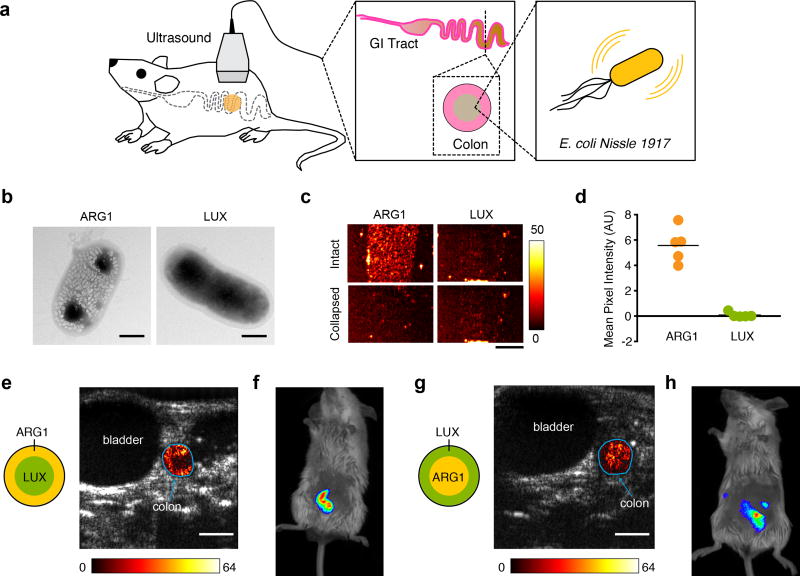
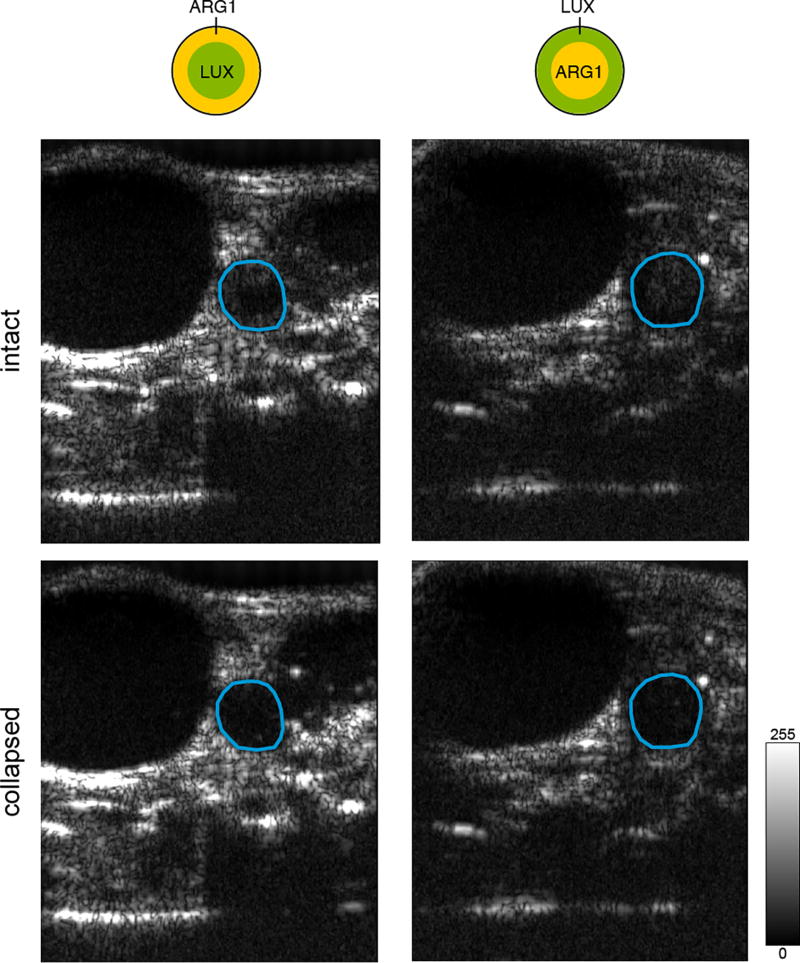
After establishing the core capabilities of ARGs in vitro, we set out to demonstrate their detectability in vivo by imaging ARG-expressing cells in biologically relevant anatomical contexts. One particularly important target for in vivo microbial imaging is the mammalian GI tract, given the impact of the gut microbiome on the host’s health1,8,9 and the development of GI-targeted microbial therapeutics4,24. Due to its location deep inside the body, the GI tract is difficult to image using optical techniques. To establish a proof of concept for ultrasonic imaging of microbes in this context, we expressed ARGs in a probiotic bacterial strain and assessed the ability of ultrasound to localize this bacterium inside the colon (Fig. 4a) in comparison with bioluminescent imaging. The E. coli strain Nissle 1917 (EcN) is a probiotic microbe capable of colonizing the mammalian GI tract25. EcN has been used clinically in humans for 100 years to treat enteric infection and inflammatory bowel conditions25, and is a common chassis for therapeutic synthetic biology 3,5,6,26. EcN cells transformed with a plasmid expressing ARG1 produced abundant gas vesicles (Fig. 4b) and ultrasound contrast (Fig. 4, c–d). For comparison, we transformed EcN cells with the luminescence operon LuxABCDE (LUX), which has previously been used to visualize gene expression in microbial populations in vivo using bioluminescent imaging3,6,27. LUX-expressing EcN cells produced no ultrasound contrast (Fig. 4, c–d).
Fig. 4. Ultrasound imaging of bacteria in the gastrointestinal tract.
(a) Diagram of GI imaging experiment. (b) Representative TEM images of whole EcN cells expressing ARG1 or the LUX operon. Images were acquired from 3 biologically independent samples for ARG1 and one for LUX (approximately 35 cells imaged in each sample) with similar results. (c) Ultrasound images of a gel phantom containing EcN expressing ARG1 or the LUX operon. Experiment repeated 5 times with similar results. (d) Mean collapse-sensitive ultrasound signal in phantoms containing EcN cells expressing ARG1 or LUX. Line represents mean. (P-value = 0.0007, N=5). Cell concentration in (c–d) was 109 cells/ml. (e) Transverse ultrasound image of a mouse whose colon contains EcN expressing ARG1 proximal to the colon wall, and EcN expressing LUX at the center of the lumen. (f) Luminescence image of mouse with the same arrangement of colonic bacteria. (g and h) Same as (e) and (f), but with EcN expressing ARG1 at the center of the lumen and EcN expressing LUX at the periphery. Cells are loaded at a final concentration of 109 cells/ml. In (e) and (g), a difference heat map of ultrasound contrast within the colon ROI before and after acoustic collapse is overlaid on a grayscale anatomical image. In (f) and (h), a thresholded luminescence map is overlaid on a bright field image of the mouse. Scale bars represent 500 nm in (b), 2 mm in (c), and 2.5 mm in (e and g). In vivo imaging experiments were repeated 3 times with similar results.
To establish a proof of concept for ultrasound imaging of ARG-expressing bacteria within the GI tract, and to compare the result to bioluminescent imaging, we introduced EcN cells expressing ARG1 or LUX into the colons of anesthetized mice. To assess the ability of each modality to resolve the spatial distribution of bacteria within the colon, we injected the ARG1 and LUX cells in the center or periphery of the colonic lumen (Fig. 4, e–h). Ultrasound images clearly revealed the localization of ARG-expressing EcN cells in the appropriate region of the colon (Fig. 4, e and g) at concentrations of 109 cells/ml – within the range of certain commensal and therapeutic scenarios, and below the density reached by EcN in gnotobiotic models21,25. In contrast, bioluminescent images showed only that the bacteria are present somewhere in the mouse abdomen (Fig. 4, f and h). To facilitate visualization of ARG-specific signals, our ultrasound image analysis used background subtraction following gas vesicle collapse, with the resulting contrast overlaid on grayscale anatomical images to show the location of the bacteria within the context of other internal organs. Alternatively, ARG-expressing cells can also be seen in the colon in raw ultrasound images (Extended Data Fig. 6). Contrast from colon-localized E. coli was consistent across mice (Extended Data Fig. 7). These results establish the ability of ARGs to make genetically labeled microbes visible noninvasively in deep tissue, and demonstrate the advantage of ultrasound relative to optical imaging in terms of spatial localization within deep organs.
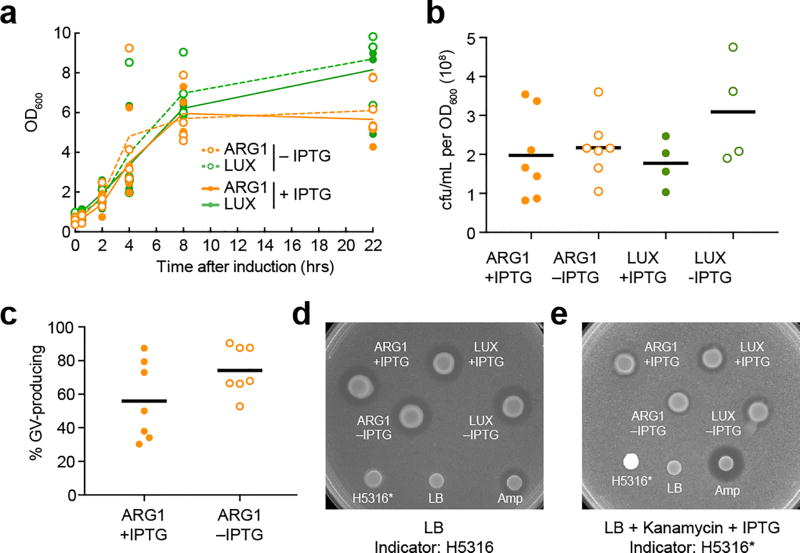
Some degree of burden is expected to accompany heterologous protein expression28,29. To assess the burden on EcN cells presented by ARG1, we characterized their growth, viability, reporter expression maintenance, and release of microcins. We observed that ARG1 expression is generally well tolerated, with some scope for optimization (Extended Data Fig. 8, Supplementary Note 2).
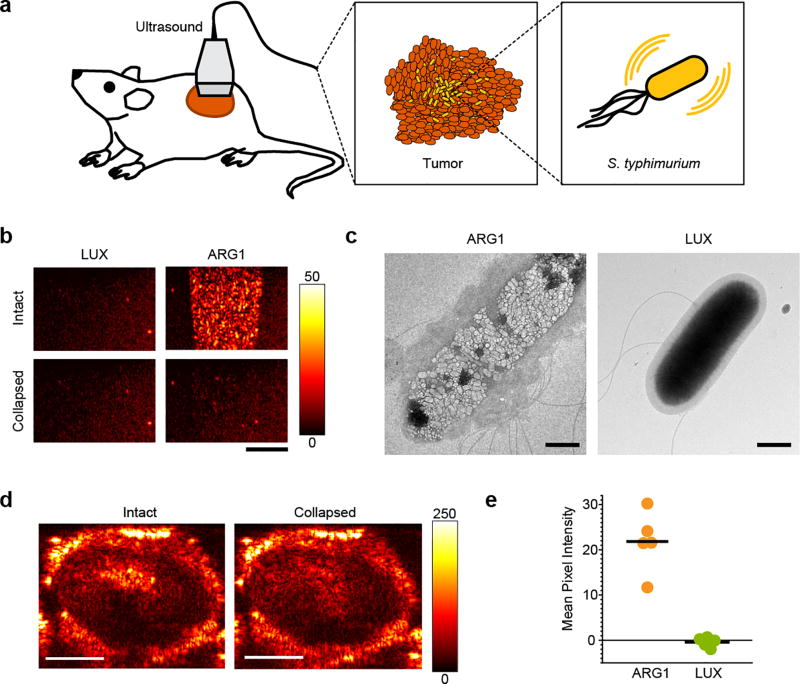
In addition to the GI tract, another emerging application of engineered microbes is as antitumor therapies and diagnostics6,30. To test whether such microbes could be imaged with ultrasound, and assess whether ARGs could be generalized to additional species besides E. coli, we adapted the genetic construct encoding ARG1 for expression in the attenuated, tumor-homing S. typhimurium strain ELH13016,30, and showed that we could image these cells following injection into tumors (Supplementary Note 3, Extended Data Fig. 9).
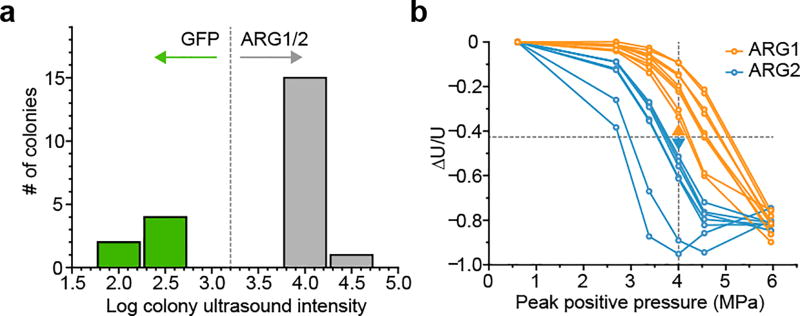
Finally, to facilitate future genetic engineering of ARGs, we assessed the amenability of these constructs to high throughput screening. In fluorescent protein engineering, directed evolution has served as an effective approach to identify variants with new spectral and biochemical properties 31,32, often using mutant bacterial colonies as a convenient platform for high-throughput screening32. To determine whether a similar approach could be used with ARGs, we developed a method to scan bacterial colonies with ultrasound (Fig. 5a). In this method, colonies are immobilized on agar plates with an over-layer of agarose, then scanned with an ultrasound transducer translated by a computer-controlled robot. This results in a series of transverse images that can be reconstructed to from an in-plane image of the plate (Fig. 5b). We used this technique to image a mixed plate of E. coli transformed with ARG1, ARG2 or GFP. Serial acoustic collapse imaging (Fig. 5b) revealed three distinct colony populations (Fig. 5c, Extended Data Fig. 10), allowing the genotypes to be distinguished from each other with 100% accuracy (Fig. 5d). This result suggests that colony screening can discriminate acoustic phenotypes with sufficient accuracy to serve as a high-throughput assay for acoustic protein engineering.
Fig. 5. High throughput screening of acoustic phenotypes.
(a) Illustration of acoustic colony screening. (b) Colony ultrasound images of a mixed population of ARG1, ARG2, and GFP expressing E. coli colonies. Images were acquired before collapse and after collapse at 4.0 and 6.0 MPa peak acoustic pressures. This imaging experiment was performed once; each colony was treated as a biological replicate. (c) Predicted genotypes of each colony based on the acoustic phenotype seen in the images in (b). Scale bar represents 10 mm. (d) Confirmation of predicted genotypes by colony picking and sequencing. N=the number of sequenced colonies of each type.
Our study establishes engineered gas vesicle gene clusters as the first reporter genes for ultrasound, giving this widely used noninvasive imaging modality the ability to visualize genetically modified bacteria inside living animals. Future work will build on the in vitro and in vivo proofs of concept presented in this study to answer scientific and translational questions. This research will benefit from the development of ultrasound techniques to optimally detect ARG signals and distinguish them from background (Supplementary Note 4), further genetic engineering to optimize the stability and host burden of ARG constructs, and expression of these reporters in a broader range of microbial species (Supplementary Note 5). In addition, it is ultimately desirable to express ARGs in mammalian cells, which will require a significant dedicated effort.
We anticipate that the ARGs presented in this work are only a starting point for future engineering of ultrasound reporter genes. Since their initial discovery as optical reporters, fluorescent proteins have been engineered, evolved and used in thousands of unforeseen optical imaging applications. Our findings that genetic engineering can be used to generate ARGs with distinct acoustic properties and that ARGs are amenable to colony-based high-throughput screening suggest that a similar trajectory may be available for this new technology.
METHODS
Chemicals
All chemicals were purchased from Sigma Aldrich (St. Louis, MO) unless otherwise noted.
Molecular cloning
To construct the plasmid for E. coli BL21(A1) expression of ARGs, the gene cluster encoding B. megaterium gas vesicle (GV) proteins BRNFGLSKJTU was amplified from pNL29 19 (gift of Maura Cannon) and cloned into pET28a using Gibson assembly. The amplicon included an additional 46 bp upstream of the GvpB start codon and 180 bp downstream of the GvpU stop codon. To generate hybrid gene clusters, the genes encoding GvpA and GvpC were amplified from A. flos-aquae and cloned into pET28-RNFGLSKJTU using Gibson assembly. A control gene encoding the green fluorescent protein (GFP) mNeonGreen 33 was similarly constructed in the pET28 vector. For expression of ARGs in E. coli Nissle 1917, the pET28 T7 promoter was replaced by the T5 promoter. For S. typhimurium expression, the ARG gene cluster was cloned into pTD103 (gift of Jeff Hasty). A plasmid encoding the luxCDABE gene cluster from Photorhabdus luminescens on the pTD103 backbone was also a gift of Jeff Hasty.
Bacterial expression
Plasmids expressing ARGs or GFP were transformed into chemically competent E. coli BL21(A1) cells (Thermo Fisher Scientific, Carlsbad, CA) and grown in 5 ml starter cultures in LB media with 50 µg/ml kanamycin, 1% glucose for 16 h at 37 °C. Large-scale cultures in LB media containing 50 µg/ml kanamycin and 0.2% glucose were inoculated 1:100 with the starter culture. Cells were grown at 37°C to OD600 = 0.5, then induced with 0.5% L-arabinose and 0.4 mM IPTG for 22h at 30 °C. For E. coli Nissle 1917 (Ardeypharm GmbH, Herdecke, Germany) the same protocol was followed except constructs were electroporated into the cells and induction was performed at OD600 = 0.3 with 3 µM IPTG (ARG1) and 3 nM N-(β-ketocaproyl)-L-homoserine lactone (AHL) (LUX). Strain identity of E. coli Nissle 1917 cells was confirmed by PCR34. For Salmonella typhimurium expression, the same protocol was followed except constructs were electroporated into S. typhimurium ELH1301 (gift of Jeff Hasty) and induction was with 3 nM AHL.
Gas vesicle purification and quantification
Harvested cells were centrifugated at 350 g in 50 ml conical tubes for 4 h with a liquid height < 10 cm to prevent collapse of GVs by hydrostatic pressure. For ARG variants that produce a buoyant band of cells, the midnatant was removed and discarded. For ARG variants that do not produce a buoyant band, the supernatant was discarded. The remaining cells were resuspended in 8 ml Solulyse-Tris #L200500 (Genlantis, San Diego, CA) per 100 ml culture and 250 µl/ml lysozyme, and incubated for 1 h at 4 °C with rotation. Subsequently, 10 µl/ml DNAseI was added to the lysate and incubated for 10 min at 25 °C. The lysate was transferred to 2 ml tubes and centrifugated for 2 h at 400 g at 8 °C. The subnatant was removed with a 21.5 G needle, and the supernatant containing the GVs was transferred to a clean tube. PBS was added to the GVs in a 3-fold volume excess and centrifugation, removal of subnatant and PBS dilution was repeated 3 times. Purified GVs were quantified using the Micro BCA Protein Assay Kit (Thermo Fisher Scientific, Carlsbad, CA). GVs were collapsed with hydrostatic pressure prior to quantification. Bovine serum albumin was used to generate the standard curve. Absorbance measurements were taken on a Spectramax M5 spectrophotometer (Molecular Devices, Sunnyvale, CA).
TEM sample preparation and imaging
Cells expressing ARGs, or purified GVs, were exchanged into water or 10 mM HEPES pH8.0 with 150 mM NaCl, respectively, via 3 rounds of buoyancy purification and buffer exchange as described above. Samples were deposited on Formvar/carbon 200 mesh grids (Ted Pella) that were rendered hydrophilic by glow discharging (Emitek K100X). For purified GVs, 2% uranyl acetate was added for staining. The samples were then imaged on a FEI Tecnai T12 transmission electron microscope equipped with a Gatan Ultrascan CCD. Images were processed with FIJI 35.
Hydrostatic collapse pressure measurements
Cells expressing ARGs, or purified GVs, were diluted to OD600 = 1.0 in PBS and 0.4 ml was loaded into an absorption cell (176.700-QS, Hellma GmbH & Co. KG, Müllheim, Germany). A single valve pressure controller (PC series, Alicat Scientific, Tuscon, AZ, USA) supplied by a 1.5 MPa nitrogen gas source applied hydrostatic pressure in the cell, while a microspectrometer (STS-VIS, Ocean Optics, Dunedin FL, USA) measured the optical density of the sample at 500 nm. OD500 was measured from 0 to 1.2 MPa gauge pressure with a 10 kPa step size and a 7 second equilibration period at each pressure.
In vitro ultrasound imaging
Phantoms for imaging were prepared by melting 1% w/v agarose in PBS and casting wells using a custom 3D-printed template. Cells at 2X the final concentration were mixed 1:1 with molten agarose (at 50 °C) and immediately loaded into the phantom. The concentration of cells was determined prior to loading by measuring their OD600 after exposure to 1.2 MPa hydrostatic pressure to eliminate any contribution to light scattering from GVs. The optical density was then converted into cells/ml using the relationship 1 OD = 8 × 10⁸ cells/ml (http://www.genomics.agilent.com/biocalculators/calcODBacterial.jsp). Cell samples collected at early time points following induction, which had an OD insufficient for loading, were first concentrated using centrifugation at 350 g. Ultrasound imaging was performed using a Verasonics Vantage programmable ultrasound scanning system and L22-14v 128-element linear array transducer (Verasonics, Kirkland, WA). The transducer was mounted a computer-controlled 3D translatable stage (Velmex, Inc., Bloomfield, NY). Image acquisition was performed using conventional B-mode imaging using a 128 ray lines protocol with a synthetic aperture to form a focused excitation beam. The transmit waveform was set to a frequency of 19 MHz, 67% intra-pulse duty cycle, and a one cycle pulse. Samples were positioned 6 mm from the transducer face, which is the elevation focus of the L22-14v transducer, coupled through a layer of PBS. The transmit beam was also digitally focused at 6 mm. For imaging, the transmit voltage was 2 V and the f-number was 3, resulting in a peak positive pressure of 0.4 MPa. Backscattered ultrasound signals were filtered with a 7 MHz bandpass filter centered at 19 Mhz. Signals backscattered from four transmit events were summed prior to image processing. Pixel gain was set to 3 and persistence to 90.
For GV collapse using the L22-14 array, we set the f-number to 0.2 (thereby ensuring that all transducer elements were active) and scanned the transmit focus from 3 mm to 9 mm. During the 10-second collapse scan, single-cycle pulses were applied using a ray-lines protocol at 19 MHz with a frame rate of 12 frames per second. To measure GV collapse in ARG-expressing cells as a function of acoustic pressure, images were acquired as described above at a peak positive pressure of 0.4 MPa after sequentially exposing the samples to collapse pulses of increasing amplitude, with pressures varied from 0.55 MPa to 4.7 MPa. To achieve complete collapse, we applied the maximal pressure of 4.7 MPa. Collapse data was fitted with a Boltzmann sigmoid function to facilitate visualization of collapse curves. This function of the form where p is the pressure, and pc and s are fitted parameters representing the collapse midpoint and slope, respectively. For spectral unmixing, the two collapse pressures applied were 2.7 MPa and 4.7 MPa. Transducer output pressures were measured in a degassed water tank using a fiber-optic hydrophone (Precision Acoustics, Dorset, UK).
Plate-based induction and optical imaging
ARG and GFP constructs were transformed as described above, and the transformation mix after recovery was plated on two-layer LB-Agar plates. The underlayer contained 50 µg/ml kanamycin, 1.0% L-arabinose, and 0.8 mM IPTG. The overlayer contained 50 µg/ml kanamycin and 0.4% glucose. The overlayer was poured 30 min prior to plating, and each layer was 4 mm thick. Plates with transformants were incubated at 30 °C for 20 h and then imaged for white light scattering and green fluorescence using a Chemidoc MP instrument (Bio-Rad, Hercules, CA).
Cell growth, viability and microcin production assays
E. coli Nissle 1917 cells were transformed by electroporation with pET28 plasmids containing either the ARG1 or LUX gene cluster under the T5 promoter. Transformed cells were grown in 5 mL starter cultures in LB media containing 50 µg/ml kanamycin, 1% glucose for 16 h at 37 °C. The overnight cultures were diluted 1:100 in 50 mL of LB media containing 50 µg/ml kanamycin and 0.2% glucose. Cultures were grown at 30 °C to OD600 ~0.2–0.3 and induced with 3 µM IPTG (+IPTG), or left uninduced (−IPTG). Both induced and uninduced cultures were allowed to grow for 22 h at 30 °C. For time point OD measurements, 1 mL of the culture was taken out and measured. For plating after 22 h of growth, the cultures were diluted to a uniform OD600 of 0.2, before further serial dilution by a factor of 2 × 10⁴ in LB supplemented with 50 µg/ml kanamycin and 0.2% glucose. 100 uL of the final dilutions was plated on two-layer LB-Agar plates using a cell spreader. The underlayer of the plates contained 50 µg/ml kanamycin and 9 µM IPTG. The overlayer contained 50 µg/ml kanamycin and 0.4% glucose. The overlayer was poured 30 min prior to plating, and each layer was 3 mm thick. Cells uniformly spread on the two-layer plates were allowed to grow at 30°C for 21 h. Colonies were then imaged for light scattering using the Chemidoc MP instrument under white light transillumination and 605 ± 50 nm receive filter, and both opaque (gas vesicle-producing) and clear colonies were counted to determine total cfu/mL and gas vesicle-expressing fraction. Plates had a minimum of 82 and a maximum of 475 total colonies, enabling manual counting.
To assay microcin production, E. coli Nissle 1917 cells containing ARG1 or LUX were cultured as described above and spotted on microcin assay plates containing E. coli K-12 H5316 cells (gift from Klaus Hantke). Wild-type H5316 were grown in 5 mL LB media, and H5316 cells transformed with pET plasmid containing mWasabi and KanR under a T5 promoter (H5316* cells) were grown in 5 mL LB media containing 50 µg/ml kanamycin and 1% glucose for 16 h at 37 °C. Two-layer LB plates were used to assay the growth inhibition of H5316 cells by microcin peptides produced by Nissle 1917 cells. Plates used to assay with wild-type H5316 cells contained 20 mL of 1% LB agar at the bottom, and the top layer contained 2 × 10⁷ H5316 cells in 20 mL of 0.3% LB agar. Plates using H5316* cells contained 20 mL of 1% LB agar with 50 µg/ml kanamycin, 50 µM desferal, and 3 µM IPTG, and the top layer contained 2x10⁷ H5316* cells in 20 mL of 0.3% LB agar with 50 µg/ml kanamycin, 50 µM desferal, and 3 µM IPTG. Nissle cells containing ARG1 or LUX genes were cultured at 30°C for 22 h with or without 3 µM IPTG. Nissle cells with ARG1 were exposed to 1 MPa of hydrostatic pressure to facilitate the removal of kanamycin by centrifugation before spotting on H5316 plates. Nissle cells containing ARG1 and LUX induced and uninduced with IPTG, as well as H5316* cells, were washed 3x in PBS by pelleting and adjusted to OD 1 in LB. All cells were spotted in 2 µL volume on 5 mm sterile filter paper (Bel-Art Products), placed on the microcin assay plates. Unsupplemented LB and 100 mg/mL ampicillin (2 µL each) were similarly spotted as controls. After 17 h at 37 °C, the plates were imaged with the Chemidoc MP instrument with blue transillumination, and unfiltered light was collected to form an image. Images shown are representative of four experiments each.
Colony Ultrasound
ARG and GFP constructs were transformed into BL21(A1) one-shot competent cells (Thermo Fisher Scientific, Carlsbad, CA) and plated onto LB-Agar two-layer inducer plates as described above. Plates were grown at 37 °C for 14h. The colonies were immobilized by depositing a 4 mm layer of 0.5% Agarose-PBS gently onto the plate surface. Ultrasound imaging was performed using a L11-4v128-element linear array transducer (Verasonics, Kirkland, WA) to obtain a larger field of view. The transducer was mounted a computer-controlled 3D translatable stage (Velmex, Inc., Bloomfield, NY). Image acquisition was performed using conventional B-mode imaging using a 128 ray lines protocol with a synthetic aperture to form a focused excitation beam. The transmit waveform was set to a frequency of 6.25 MHz, 67% intra-pulse duty cycle, and a four-cycle pulse. Colonies were positioned 20 mm from the transducer face, which is the elevation focus of the L11-4v transducer, coupled through a layer of PBS. The transmit beam was also digitally focused at 20 mm. For imaging, the transmit power was 2 V and the f-number was 3, resulting in a peak positive pressure of 0.61 MPa. To measure GV collapse in bacterial colonies as a function of acoustic pressure, images were acquired as described above at a peak positive pressure of 0.61 MPa after sequentially exposing the samples to collapse pulses at 6.25 MHz, with increasing amplitude from 0.61 MPa to 5.95 MPa. Pixel gain in the images was set to 0.1 and persistence to 20. Cross-sectional images of the plate (perpendicular to the plate surface) were acquired at spatial intervals of 250 µm using computer-controlled steps. The cross-sectional images were processed in MATLAB to form 2D images of the plate surface. First, the cross-sectional images were stacked to produce a 3D-volumetric reconstruction of the plate. We then summed the signals in a 2mm slice of the volume parallel to and centered on the bacterial growth surface after thresholding to eliminate background, forming a 2D projection image of the plate. After ultrasound imaging, image processing, and acoustic phenotype prediction, the colonies were picked using 10 µl sterile pipet tips. Each colony was used to inoculate a 5 ml LB + 50 µg/ml kanamycin culture. The cultures were mini-prepped and sequenced to determine whether the plasmid contained GFP, ARG1, or ARG2.
In vivo ultrasound and bioluminescence imaging
All in vivo experiments were performed on BALB/c or SCID nude female mice, aged 14–15 weeks, under a protocol approved by the Institutional Animal Care and Use Committee of the California Institute of Technology. No randomization or blinding were necessary in this study. Ultrasound imaging was performed as follows. Mice were anesthetized with 1–2% isoflurane, maintained at 37°C on a heating pad, depilated over the imaged region, and imaged using an L22-14v transducer with the pulse sequence described above. For imaging of E. coli in the gastrointestinal tract (GI), BALB/c mice were placed in a supine position, with the ultrasound transducer positioned on the lower abdomen, transverse to the colon. Anatomical landmarks including the bladder were used to identify the colon’s position. Prior to imaging, buoyancy-enriched E. coli Nissle 1917 expressing ARG1 or LUX were mixed 1:1 with 42°C 4% agarose-PBS for a final bacterial concentration of 109 cells/ml. An 8-gauge needle was filled with the mixture of agarose-bacteria expressing either ARG1 or LUX. Before it solidified, a 14-gauge needle was placed inside the 8-gauge needle to form a hollow lumen within the gel. After the agarose-bacteria mixture solidified at room temperature for 10 min, the 14-gauge needle was removed. The hollow lumen was then filled with the agarose-bacteria mixture expressing the other imaging reporter (ARG1 or LUX). After it solidified, the complete cylindrical agarose gel was injected into the colon of the mouse with a PBS back-filled syringe. The same procedure was used with E. coli BL21 cells, except with the entire gel homogeneously composed of either ARG2- or GFP-expressing cells. Introduction of gel into the colon is a common preparatory protocol for gastrointestinal ultrasound 36,37.
For imaging of S. typhimurium in tumors, we formed hindlimb ovarian tumor xenografts in SCID nude mice via subcutaneous injection of 5 × 10⁷ OVCAR8 cells with matrigel. After tumors grew to dimensions larger than approximately 6 mm (14 weeks), they were injected with ARG1-expressing S. typhimurium. (50 µL, 3.2 × 10⁹ cells/ml). The tumors were then imaged with ultrasound, with mice in a prone position with anesthesia, homeostasis and imaging parameters as described above. Our animal protocol specified that animals with total tumor volume exceeding 2 cm3, or showing signs of distress as assessed by the veterinary team, be euthanized.
For luminescence imaging, mice were anaesthetized with 100 mg/kg ketamine and 10 mg/kg xylazine and imaged using a Bio-Rad ChemiDoc MP imager without illumination, no emission filter, and an integration time of 5 min. The image was thresholded and rendered in ImageJ, and superimposed on a brightfield image of the mouse using GIMP.
Image processing
MATLAB was used to process ultrasound images. Regions-of-interest (ROIs) were defined to capture the ultrasound signal from the phantom well, colon, or tumor region. All in vitro phantom experiments had the same ROI dimensions. For in vivo experiments ROIs were selected consistently to exclude edge effects from the colon wall or skin. Mean pixel intensity was calculated from each ROI, and pressure-sensitive ultrasound intensity was calculated by subtracting the mean pixel intensity of the collapsed image from the mean pixel intensity of the intact image. Images were pseudo-colored, with maximum and minimum levels adjusted for maximal contrast as indicated in accompanying color bars.
For the multiplexed imaging of ARG1 and ARG2, acoustic spectral unmixing was performed according to 20. Briefly, a spatial averaging filter (kernel size 30 × 30 pixels or 750 × 750 µm) was applied to the three acquired images (before collapse, after collapse with 2.7 MPa and after collapse with 4.7 MPa) to reduce noise. Then, pixel-wise differences between the first and second image, and between the second and third image were calculated, and multiplied by the inverse of the collapse matrix, α, representing the expected fractional collapse of each ARG type at each pressure (α = [0.7921, 0.5718; 0.2079, 0.4282]), to produce the unmixed pixel intensities corresponding to the contributions from ARG2 and ARG1.
Statistical analysis
For statistical significance testing, we used two-sided heteroscedastic t-tests with a significance level of type I error set at 0.05 for rejecting the null hypothesis. Sample sizes for all experiments, including animal experiments, were chosen on the basis of preliminary experiments to be adequate for statistical analysis.
Data and code availability
ARG1 and ARG2 plasmid sequences are included in Supplementary Information, and will be deposited to Addgene. All other materials and MATLAB code are available upon reasonable request.
Extended Data
Extended Data Figure 1. Sequence homology of GvpA/B.
Amino acid sequence alignment of the primary gas vesicle structural protein, GvpB from B. megaterium (the GvpA analog in this species) and GvpA from A. flos-aquae.
Extended Data Figure 2. Ultrasound contrast from buoyancy-enriched cells.
(a) Diagram of centrifugation-assisted enrichment of buoyant cells. (b) Image of ARG1 E. coli culture 22 hours after induction and 4 hours of centrifugation at 350 g, showing the presence of buoyant cells. Arrow points to meniscus layer containing buoyant cells. Experiment repeated 3 times with similar results. (c) Ultrasound images of E. coli expressing ARG1 at various cellular concentrations, with and without buoyancy enrichment. Experiment was repeated 4 times with similar results. (d) Ultrasound contrast from E. coli expressing ARG1, with and without buoyant enrichment, and GFP at various cell densities. N=3 biological replicates; lines represent the mean.
Extended Data Figure 3. Time course of acoustic reporter gene contrast after induction.
(a) Ultrasound images of ARG1-expressing E. coli at various times after induction with IPTG. Experiment repeated 4 times with similar results. (b) Mean ultrasound contrast at each time point N=4 biological replicates; line represents the mean. Cell concentration was 5 × 10⁸ cells/ml. Scale bar represents 2 mm.
Extended Data Figure 4. Acoustic reporter gene expression and ultrasound imaging does not affect cell viability.
(a) Growth curves of E. coli containing the ARG1 or GFP expression plasmid, with or without induction using 0.4 mM IPTG. N=3 biological replicates per sample; lines represent the means. (b) Representative TEM images of whole E. coli cells expressing ARG1 with and without exposure to acoustic collapse pulses, and E. coli cells expressing GFP. Images were acquired from 3 biologically independent samples for ARG1, two for ARG1 with ultrasound collapse and one for GFP (more than 50 cells imaged per sample) with similar results. (c) Dark field optical image of agar plate containing colonies of E. coli expressing ARG1 14 hours after seeding. (d) Image of the same plate after the right half of the plate was insonated with high-pressure ultrasound. (e) Image of the same plate 20 hours after insonation. (f) Image after the right half of the plate in (e) was insonated with high-pressure ultrasound. Zoomed in images of representative colonies shown below each plate image. Scale bars represent 500 nm. Experiment was repeated 3 times with similar results.
Extended Data Figure 5. Multiplexed imaging of genetically engineered reporter variants.
(a) Top: image of ARG2 E. coli culture 22 hours after induction showing the presence of buoyant cells. Experiment repeated 3 times with similar results. Bottom: mass fraction of gas vesicles produced 22 hours after induction. N=3 biological replicates; line represents the mean. (b) Ultrasound contrast from the whole population of cells expressing ARG1, ARG2 or GFP. N=3 biological replicates; lines represent the mean. (c) Ultrasound contrast from the buoyancy-enriched population of cells expressing ARG1, ARG2 or GFP. N=3 biological replicates; lines represent the mean. (d) Normalized optical density (representing the intact fraction) of gas vesicles isolated from ARG1- or ARG2-expressing E. coli as a function of applied hydrostatic pressure. (e) Normalized ultrasound intensity as a function of peak positive pressure from 0.6 to 4.7 MPa for E. coli expressing ARG1 or ARG2. (f) Acoustic collapse spectra derived by differentiating the data and curves in (e) with respect to applied pressure. N=3 biological replicates per sample in d-f. Curves represent fits of the data using the Boltzmann sigmoid function to assist visualization.
Extended Data Figure 6. Anatomical ultrasound images of acoustic bacteria in the gastrointestinal tract.
Raw images underlying the difference maps shown in Fig. 4, e and g. The cyan outline identifies the colon region of interest for difference processing. This experiment was repeated 3 times with similar results.
Extended Data Figure 7. Ultrasound imaging of ARG-expressing cells in the mouse colon.
(a) Transverse ultrasound images of mice whose colon contains BL21 E. coli expressing either ARG2 or GFP at a final concentration of 109 cells/ml. A difference heat map of ultrasound contrast within the colon ROI before and after acoustic collapse is overlaid on a grayscale anatomical image. (b) Signal intensity in mice with E. coli expressing either ARG2 or GFP. N=5 biological replicates per sample. P-value = 0.02 using two-sided heteroscedastic t-test. Scale bar represents 2 mm.
Extended Data Figure 8. Impact of ARG1 and LUX expression on E. coli Nissle 1917 (EcN) cell growth, viability and microcin release.
(a) Optical density at 600 nm measured 0 to 22 hours after induction with 3 µM IPTG, or without induction, in EcN cells transformed with ARG1 or LUX. N=4 biological replicates per time point. Lines represent the mean. The p-value comparing induced ARG1 and induced LUX values at 22 hours is 0.06. The p-value comparing uninduced ARG1 and induced LUX at 22 hours is 0.02. Comparisons at all other time points have p-values greater than 0.14. (b) Colony-forming units (cfu) per mL culture per OD600 after 22 hours of induction with 3 µM IPTG, or uninduced growth, of EcN cells transformed with ARG1 or LUX. All p-values greater than or equal to 0.22. N=7 biological replicates for ARG1 samples and N=4 biological replicates for LUX samples. Lines represent the mean. (c) Fraction of opaque, GV-producing colonies produced by plating ARG1-transformed EcN cells 22 hours after induction with 3 µM IPTG, or uninduced growth. Cells are plated on dual-layer IPTG induction plates, allowed to grow overnight at 30°C, and imaged as in Fig. 3, c-f. p-value=0.12. N=7 biological replicates. Lines represent the mean. (d) Left image: microcin release assay using a uniform layer of the indicator strain E. coli K12 H5316 in soft agar, after 17-hour incubation with filters containing microcin sources and controls, as indicated. EcN cells transformed with ARG1 or LUX were induced for 22 hours with 3 µM IPTG, or grown without induction, before spotting. H5316* indicates H5316 cells transformed with mWasabi and cultured for 22 hours as with EcN cells. All cells were washed before spotting to remove antibiotic. LB is LB media. Amp is 100 mg/ml ampicillin. Experiment was performed 4 times with similar results. (e) Results of the same experiment as in (d), but with the indicator strain comprising H5316* cells and the agar containing 50 µg/mL kanamycin, 3 µM IPTG and 50 µM desferal, to show that microcin release also occurs during transgene expression. Note that the H5316* spot appears bright because plate image is acquired with blue light transillumination, resulting in mWasabi fluorescence. Experiment was performed 4 times with similar results. All p-values were calculated using a two-sided heteroscedastic t-test.
Extended Data Figure 9. Ultrasound imaging of S. typhimurium in tumor xenografts.
(a) Diagram of tumor imaging experiment. S. typhimurium expressing ARG1 were introduced into the tumor of mice and imaged with ultrasound. (b) Ultrasound images of a gel phantom containing S. typhimurium expressing ARG1 or the LUX operon. Cell concentration is 109 cells/ml. Experiment repeated 3 times with similar results. (c) TEM images of whole S. typhimurium cells expressing ARG1 with and without exposure to acoustic collapse pulses. At least 20 cellular images were acquired for each sample type (from one biological preparation each) with similar results. (d) Ultrasound images of mouse OVCAR8 tumors injected with 50 µL of 3.2 × 10⁹ cells/ml ARG1-expressing S. typhimurium, before and after acoustic collapse. Experiment repeated 5 times with similar results. (e) Collapse-sensitive ultrasound contrast in tumors injected with ARG1-expressing or LUX-expressing cells. N=5 animals. Line represens the mean. P-value = 0.002 using a two-sided heteroscedastic t-test. Scale bars 2 mm (b), 500 nm (c) and 2.5 mm (d).
Extended Data Figure 10. High throughput screening of acoustic phenotypes.
(a) Ultrasound intensity histogram of 22 randomly picked colonies. Colonies with low contrast were predicted to contain the GFP gene and those with high contrast to contain ARG1 or ARG2 genes. (b) Normalized change in ultrasound intensity for each of the 15 ARG1 or ARG2 colonies after insonation at increasing pressures. At 4 MPa, colonies with signal above the indicated threshold were predicted to be ARG1 and below to be ARG2. This experiment was performed once; each colony was treated as a biological replicate.
Supplementary Material
Acknowledgments
The authors thank David Maresca, Arnab Mukherjee, Muhammad Din and Tal Danino for helpful discussions, and Dr. Alasdair McDowall for assistance with electron microscopy. This research was supported by the National Institutes of Health grant R01-EB018975, the Canadian Institute of Health Research grant MOP 136842 and the Pew Scholarship in the Biomedical Sciences. A.L. is supported by the NSF graduate research fellowship (award 1144469) and the Biotechnology Leaders Program. A.F. is supported by the NSERC graduate fellowship. S.P.N. was supported by the Caltech Summer Undergraduate Research Fellowship. Research in the Shapiro laboratory is also supported by the Heritage Medical Research Institute, the Burroughs Wellcome Career Award at the Scientific Interface and the David and Lucile Packard Fellowship for Science and Engineering.
Footnotes
Author Contributions
RWB and MGS conceived and designed the study. RWB, AL, AL-G, AF and SPN prepared genetic constructs in E. coli. RWB, AL, AL-G, SPN and AF conducted in vitro ultrasound experiments. AL-G and RWB performed in vivo ultrasound experiments. AL, AF and AL-G conducted metabolic burden experiments in Nissle 1917 cells. RWB and SRK prepared genetic constructs in S. typhimurium. RWB and AL obtained TEM images. RWB, AL-G and MGS analyzed ultrasound data. RWB and MGS wrote the manuscript with input from all authors. MGS supervised the research.
The authors declare no competing financial interests. Readers are welcome to comment on the online version of the paper.
Supplementary Notes 1–5
Supplementary Table 1
Plasmid Sequences for ARG1 and ARG2 constructs
References
- 1.Round JL, Mazmanian SK. The gut microbiota shapes intestinal immune responses during health and disease. Nature Reviews Immunology. 2009;9:313–323. doi: 10.1038/nri2515. [DOI] [PMC free article] [PubMed] [Google Scholar]
- 2.Wang Y, Kasper LH. The role of microbiome in central nervous system disorders. Brain, behavior, and immunity. 2014;38:1–12. doi: 10.1016/j.bbi.2013.12.015. [DOI] [PMC free article] [PubMed] [Google Scholar]
- 3.Danino T, et al. Programmable probiotics for detection of cancer in urine. Science translational medicine. 2015;7:289ra284–289ra284. doi: 10.1126/scitranslmed.aaa3519. [DOI] [PMC free article] [PubMed] [Google Scholar]
- 4.Steidler L, et al. Treatment of murine colitis by Lactococcus lactis secreting interleukin-10. Science. 2000;289:1352–1355. doi: 10.1126/science.289.5483.1352. [DOI] [PubMed] [Google Scholar]
- 5.Claesen J, Fischbach MA. Synthetic microbes as drug delivery systems. ACS synthetic biology. 2014;4:358–364. doi: 10.1021/sb500258b. [DOI] [PMC free article] [PubMed] [Google Scholar]
- 6.Din MO, et al. Synchronized cycles of bacterial lysis for in vivo delivery. Nature. 2016;536:81–85. doi: 10.1038/nature18930. [DOI] [PMC free article] [PubMed] [Google Scholar]
- 7.Riglar DT, et al. Engineered bacteria can function in the mammalian gut long-term as live diagnostics of inflammation. Nature Biotechnology. 2017 doi: 10.1038/nbt.3879. [DOI] [PMC free article] [PubMed] [Google Scholar]
- 8.Donaldson GP, Lee SM, Mazmanian SK. Gut biogeography of the bacterial microbiota. Nature Reviews Microbiology. 2015 doi: 10.1038/nrmicro3552. [DOI] [PMC free article] [PubMed] [Google Scholar]
- 9.Derrien M, van Hylckama Vlieg JE. Fate, activity, and impact of ingested bacteria within the human gut microbiota. Trends in microbiology. 2015 doi: 10.1016/j.tim.2015.03.002. [DOI] [PubMed] [Google Scholar]
- 10.Foucault M-L, Thomas L, Goussard S, Branchini B, Grillot-Courvalin C. In vivo bioluminescence imaging for the study of intestinal colonization by Escherichia coli in mice. Applied and environmental microbiology. 2010;76:264–274. doi: 10.1128/AEM.01686-09. [DOI] [PMC free article] [PubMed] [Google Scholar]
- 11.Daniel C, Poiret S, Dennin V, Boutillier D, Pot B. Bioluminescence imaging study of spatial and temporal persistence of Lactobacillus plantarum and Lactococcus lactis in living mice. Applied and environmental microbiology. 2013;79:1086–1094. doi: 10.1128/AEM.03221-12. [DOI] [PMC free article] [PubMed] [Google Scholar]
- 12.Chu J, et al. A bright cyan-excitable orange fluorescent protein facilitates dual-emission microscopy and enhances bioluminescence imaging in vivo. Nat Biotech. 2016;34:760–767. doi: 10.1038/nbt.3550. [DOI] [PMC free article] [PubMed] [Google Scholar]
- 13.Smith-Bindman R, et al. Use of diagnostic imaging studies and associated radiation exposure for patients enrolled in large integrated health care systems, 1996–2010. JAMA. 2012;307:2400–2409. doi: 10.1001/jama.2012.5960. [DOI] [PMC free article] [PubMed] [Google Scholar]
- 14.Foster FS, et al. Principles and applications of ultrasound backscatter microscopy. Ultrasonics, Ferroelectrics and Frequency Control, IEEE Transactions on. 1993;40:608–617. doi: 10.1109/58.238115. [DOI] [PubMed] [Google Scholar]
- 15.Errico C, et al. Ultrafast ultrasound localization microscopy for deep super-resolution vascular imaging. Nature. 2015;527:499–502. doi: 10.1038/nature16066. [DOI] [PubMed] [Google Scholar]
- 16.Walsby AE. Gas vesicles. Microbiol Rev. 1994;58:94–144. doi: 10.1128/mr.58.1.94-144.1994. [DOI] [PMC free article] [PubMed] [Google Scholar]
- 17.Pfeifer F. Distribution, formation and regulation of gas vesicles. Nat Rev Microbiol. 2012;10:705–715. doi: 10.1038/nrmicro2834. [DOI] [PubMed] [Google Scholar]
- 18.Shapiro MG, et al. Biogenic gas nanostructures as ultrasonic molecular reporters. Nat. Nanotechnol. 2014;9:311–316. doi: 10.1038/nnano.2014.32. [DOI] [PMC free article] [PubMed] [Google Scholar]
- 19.Li N, Cannon MC. Gas vesicle genes identified in Bacillus megaterium and functional expression in Escherichia coli. J Bacteriol. 1998;180:2450–2458. doi: 10.1128/jb.180.9.2450-2458.1998. [DOI] [PMC free article] [PubMed] [Google Scholar]
- 20.Lakshmanan A, et al. Molecular Engineering of Acoustic Protein Nanostructures. ACS Nano. 2016;10:7314–7322. doi: 10.1021/acsnano.6b03364. [DOI] [PMC free article] [PubMed] [Google Scholar]
- 21.Gorbach SL. Microbiology of the gastrointestinal tract. 1996 [PubMed] [Google Scholar]
- 22.Klumpp S, Hwa T. Bacterial growth: global effects on gene expression, growth feedback and proteome partition. Current opinion in biotechnology. 2014;28:96–102. doi: 10.1016/j.copbio.2014.01.001. [DOI] [PMC free article] [PubMed] [Google Scholar]
- 23.Hayes P, Buchholz B, Walsby A. Gas vesicles are strengthened by the outer-surface protein, GvpC. Arch. Microbiol. 1992;157:229–234. doi: 10.1007/BF00245155. [DOI] [PubMed] [Google Scholar]
- 24.Daniel C, Roussel Y, Kleerebezem M, Pot B. Recombinant lactic acid bacteria as mucosal biotherapeutic agents. Trends in biotechnology. 2011;29:499–508. doi: 10.1016/j.tibtech.2011.05.002. [DOI] [PubMed] [Google Scholar]
- 25.Sonnenborn U, Schulze J. The non-pathogenic Escherichia coli strain Nissle 1917–features of a versatile probiotic. Microbial Ecology in Health and Disease. 2009;21:122–158. [Google Scholar]
- 26.Chen Z, et al. Incorporation of therapeutically modified bacteria into gut microbiota inhibits obesity. The Journal of clinical investigation. 2014;124:3391–3406. doi: 10.1172/JCI72517. [DOI] [PMC free article] [PubMed] [Google Scholar]
- 27.Francis KP, et al. Monitoring Bioluminescent Staphylococcus aureusInfections in Living Mice Using a Novel luxABCDEConstruct. Infection and immunity. 2000;68:3594–3600. doi: 10.1128/iai.68.6.3594-3600.2000. [DOI] [PMC free article] [PubMed] [Google Scholar]
- 28.Borkowski O, Ceroni F, Stan G-B, Ellis T. Overloaded and stressed: whole-cell considerations for bacterial synthetic biology. Current opinion in microbiology. 2016;33:123–130. doi: 10.1016/j.mib.2016.07.009. [DOI] [PubMed] [Google Scholar]
- 29.Sleight SC, Sauro HM. Visualization of evolutionary stability dynamics and competitive fitness of Escherichia coli engineered with randomized multigene circuits. ACS synthetic biology. 2013;2:519–528. doi: 10.1021/sb400055h. [DOI] [PubMed] [Google Scholar]
- 30.Danino T, Lo J, Prindle A, Hasty J, Bhatia SN. In vivo gene expression dynamics of tumor-targeted bacteria. ACS synthetic biology. 2012;1:465–470. doi: 10.1021/sb3000639. [DOI] [PMC free article] [PubMed] [Google Scholar]
- 31.Romero PA, Arnold FH. Exploring protein fitness landscapes by directed evolution. Nature Reviews Molecular Cell Biology. 2009;10:866–876. doi: 10.1038/nrm2805. [DOI] [PMC free article] [PubMed] [Google Scholar]
- 32.Shaner NC, et al. Improved monomeric red, orange and yellow fluorescent proteins derived from Discosoma sp. red fluorescent protein. Nature biotechnology. 2004;22:1567–1572. doi: 10.1038/nbt1037. [DOI] [PubMed] [Google Scholar]
- 33.Shaner NC, et al. A bright monomeric green fluorescent protein derived from Branchiostoma lanceolatum. Nat Meth. 2013;10:407–409. doi: 10.1038/nmeth.2413. [DOI] [PMC free article] [PubMed] [Google Scholar]
- 34.Blum-Oehler G, et al. Development of strain-specific PCR reactions for the detection of the probiotic Escherichia coli strain Nissle 1917 in fecal samples. Research in microbiology. 2003;154:59–66. doi: 10.1016/s0923-2508(02)00007-4. [DOI] [PubMed] [Google Scholar]
- 35.Schindelin J, et al. Fiji: an open-source platform for biological-image analysis. Nat Meth. 2012;9:676–682. doi: 10.1038/nmeth.2019. [DOI] [PMC free article] [PubMed] [Google Scholar]
- 36.Wang H, et al. Molecular imaging of inflammation in inflammatory bowel disease with a clinically translatable dual-selectin–targeted US contrast agent: comparison with FDG PET/CT in a mouse model. Radiology. 2013;267:818–829. doi: 10.1148/radiol.13122509. [DOI] [PMC free article] [PubMed] [Google Scholar]
- 37.Freeling JL, Rezvani K. Assessment of murine colorectal cancer by micro-ultrasound using three dimensional reconstruction and non-linear contrast imaging. Molecular Therapy — Methods & Clinical Development. 2016;5:16070. doi: 10.1038/mtm.2016.70. [DOI] [PMC free article] [PubMed] [Google Scholar]
Associated Data
This section collects any data citations, data availability statements, or supplementary materials included in this article.
Supplementary Materials
Data Availability Statement
ARG1 and ARG2 plasmid sequences are included in Supplementary Information, and will be deposited to Addgene. All other materials and MATLAB code are available upon reasonable request.


