

Abstract
Objective
Hepatorenal Syndrome (HRS) is a devastating form of acute kidney injury (AKI) in advanced liver disease patients with high morbidity and mortality, but phenotyping algorithms have not yet been developed using large electronic health record (EHR) databases. We evaluated and compared multiple phenotyping methods to achieve an accurate algorithm for HRS identification.
Materials and Methods
A national retrospective cohort of patients with cirrhosis and AKI admitted to 124 Veterans Affairs hospitals was assembled from electronic health record data collected from 2005 to 2013. AKI was defined by the Kidney Disease: Improving Global Outcomes criteria. Five hundred and four hospitalizations were selected for manual chart review and served as the gold standard. Electronic Health Record based predictors were identified using structured and free text clinical data, subjected through NLP from the clinical Text Analysis Knowledge Extraction System. We explored several dimension reduction techniques for the NLP data, including newer high-throughput phenotyping and word embedding methods, and ascertained their effectiveness in identifying the phenotype without structured predictor variables. With the combined structured and NLP variables, we analyzed five phenotyping algorithms: penalized logistic regression, naïve Bayes, support vector machines, random forest, and gradient boosting. Calibration and discrimination metrics were calculated using 100 bootstrap iterations. In the final model, we report odds ratios and 95% confidence intervals.
Results
The area under the receiver operating characteristic curve (AUC) for the different models ranged from 0.73 to 0.93; with penalized logistic regression having the best discriminatory performance. Calibration for logistic regression was modest, but gradient boosting and support vector machines were superior. NLP identified 6985 variables; a priori variable selection performed similarly to dimensionality reduction using high-throughput phenotyping and semantic similarity informed clustering (AUC of 0.81 – 0.82).
Conclusion
This study demonstrated improved phenotyping of a challenging AKI etiology, HRS, over ICD-9 coding. We also compared performance among multiple approaches to EHR-derived phenotyping, and found similar results between methods. Lastly, we showed that automated NLP dimension reduction is viable for acute illness.
Keywords: cirrhosis, phenotyping, hepatorenal syndrome, acute kidney injury, dimension reduction, natural language processing
Graphical abstract

1. Introduction
Electronic health record (EHR) phenotyping helps identify sufficiently large cohorts to perform observational studies that inform clinical care in a wide variety of domains; refer to Shivade et al. and Xu et al. for a review.1,2 Phenotyping is especially important as larger observational cohort datasets have been generated due to collaboration from multiple institutions.3,4 Phenotyping has traditionally been a time intensive process, often requiring the assistance of domain experts. As a result, increasing emphasis has recently been placed on automated methods, termed high throughput phenotyping, requiring less domain knowledge.5–7 These high throughput methods have focused on using natural language processing (NLP) to augment the phenotyping process.8–10 To date, however, they have only been validated on chronic medical conditions. Performance may be biased due to the much higher data density for chronic conditions, particularly in terms of clinical text.
Phenotyping has not been applied to acute kidney injury (AKI), a common acute complication sometimes necessitating hospitalization and a challenging problem because of the close overlap between multiple causes of kidney injury. There are more than ten causes of AKI;11 and in observational cohort studies, though laboratory markers can be used for some etiologies, the majority of etiologies are represented by the International Classification of Diseases (ICD) code. Using ICD-9 codes alone is well known to have limited sensitivity and sub-optimal specificity.12 Hepatorenal syndrome (HRS) is a serious form of AKI that can occur among patients with cirrhosis, and stands as an archetype of multi-organ failure.13–15
Cirrhosis, a late stage of chronic liver damage, results in scarring replaces hepatic tissue and this functional tissue loss reduces the body’s capacity to filter toxins and produce a number of important factors. Cirrhosis causes significant morbidity and mortality due to decreased mental, physical, and biochemical function. The prevalence is estimated between 400,000 and 3,000,000 persons in the United States, and the disease causes 44,000 deaths annually.16–20 More than fifteen etiologies exist, but the most common causes are alcohol, viral hepatitis, and nonalcoholic fatty liver disease.21–23 Over a five year span, 39% of cirrhotic patients with ascites will develop HRS.24 HRS results in kidney dysfunction due to intense constriction of renal blood vessels with concomitant dilation of abdominal visceral vessels. Renal biopsy often does not show sufficient intrinsic disease to explain the amount of dysfunction. HRS is broadly divided into two types: Type 1 has a rapid onset with a doubling of serum creatinine >2.5 mg/dl in two weeks, and Type 2 has a delayed onset with a survival of approximately 6 months.14,25,26 Median survival in Type 1 and Type 2 HRS is two weeks and six months, respectively.
The ICD versions 9 and 10 have codes for HRS; however, their accuracy has not been studied. HRS is commonly one of several competing diagnoses, which often require clinical interpretation as opposed to strict laboratory tests, when diagnosing the etiology of AKI in cirrhosis. Studies on HRS have been limited by small sample sizes and have focused on targeted evaluations of clinical management, such as the use of vasopressors and predicting outcomes.24,27–31 Clinical research investigating therapies such as Transjugular Intrahepatic Portosystemic Shunts (TIPS)32–35 and continuation of beta-blockers36–38 have been limited by small sample sizes, as well as challenges in establishing a reliable phenotype definition for these patients in the absence of prospective clinical trials.
Due to the lack of biomarkers, identifying HRS characteristics from clinical note free text may be important. Multiple information sources from the EHR have been used in phenotyping applications, with natural language processing (NLP) of clinical text playing a crucial role.39–41 Popular clinical NLP systems can generate hundreds to thousands of features from reviewed documents.42–45 Often, dimensionality reduction is necessary to either make the classification task more tractable or improve performance.46,47 A relatively recent dimensionality reduction technique involves a distributed vector representation of words, or word embeddings, that has shown good performance in many NLP tasks.48,49 Google’s word2vec, an increasingly popular embedding algorithm,50 has been generalized to vector representations of an entire document (termed doc2vec).51 Although word embeddings have been used to improve classification in healthcare tasks,52–54 it is still relatively new to assess improvement in phenotyping. Zhang et al. assessed word embedding’s benefit in identifying phrases suggestive of psychiatric illness,55 and Turner et al used word embedding to identify an overall phenotype for Systemic Lupus Erythematosus.56 However, they applied it to chronic conditions and used raw text. Natural language processing has increasingly turned to replacing raw text with standardized concepts from ontologies such as the Unified Medical Language System (UMLS).57 Natural Language Processing pipelines from cTAKES,44 MedLEE,42 and MetaMap43 allow for replacing free text concepts with UMLS concept unique identifiers (CUIs).
In this study, we sought first to assess the performance characteristics of ICD-9 codes for determining HRS occurring during a patient hospitalization. We then evaluated commonly used machine learning methods and dimensionality reduction techniques among a large number of variables. We constructed models derived from EHR structured data and NLP processed outputs in order to develop probabilistic predictions for phenotyping HRS among hospitalized cirrhotic patients with AKI. We report the performance of these methods by comparing each of the HRS predictors to a reference standard of clinical patient chart reviews.
2. Materials and Methods
2.1 Study Population
We analyzed a retrospective cohort of patients hospitalized from among 124 medical centers in the Department of Veterans Affairs (VA) between January 1, 2005 and December 31, 2013. The VA is an integrated care network that includes acute inpatient hospitals, outpatient primary care and sub-specialist clinics, outpatient pharmacies, rehabilitation facilities, long-term care facilities and domiciliaries. All VA personnel use the same EHR, Veterans Information Systems and Technology Architecture/Computerized Patient Record System (ViSTa/CPRS), for documentation and administration of clinical care.58 The institutional review board and research and development committees of the Tennessee Valley Health Care System VA Medical Center, Nashville, TN, approved this study.
2.2 Data Collection
All data were collected from the EHR and accessed via the national Corporate Data Warehouse. The clinical data included vital signs, laboratory data, inpatient and outpatient medication data, narrative text notes, ICD-9 codes for diagnoses, and Current Procedural Terminology (CPT) codes for procedures.
2.3 Cohort Selection
We examined a cohort of patients hospitalized at a VA facility during the study years. We included all hospitalizations for patients who had a cirrhosis diagnosis (based on a history of two outpatient or one inpatient) ICD-9 code (571.2 or 571.5) and had AKI during their hospitalization with a maximum inpatient creatinine of at least 1.5 mg/dl. The maximum inpatient creatinine cutoff was used to be compliant with International Ascites Club criteria for HRS (Refer to Table 1).13 We excluded hospitalizations where the patient was on dialysis prior to admission, did not have at least one serum creatinine value within the year prior to admission or during the inpatient stay, who had a diagnosis of HRS prior to the hospitalization, who had a prior hospitalization with AKI, or who were discharged in less than forty eight hours.
Table 1.
Diagnostic criteria for Hepatorenal Syndrome from the International Ascites Club.
| Criteria |
|---|
| Cirrhosis with ascites |
| Serum creatinine > 1.5 mg/dl |
| No improvement of serum creatinine after at least 2 days with diuretic withdrawal and volume expansion |
| Absence of shock |
| No current treatment with nephrotoxic drugs |
| Absence of parenchymal kidney disease |
We performed stratified sampling based on presence/absence of an ICD-9 code for HRS, level of kidney injury, and level of liver disease. Acute Kidney Injury was defined by the Kidney Disease: Improving Global Outcomes (KDIGO) guidelines: with Stage I being a defined as a rise in creatinine of ≥0.3 mg/dl from baseline; Stage II being defined as a doubling of serum creatinine from baseline; and Stage III being defined as a tripling of serum creatinine or initiation of dialysis. Severity of liver disease was defined by the Model for End Stage Liver Disease (MELD) score: a combination of three laboratory values: the serum creatinine, international normalized ratio, and platelet count. We sampled in blocks of twelve: six patients were selected if they had an ICD-9 code for HRS (572.4) anytime during their hospitalization; six patients (without an HRS ICD-9 code) were selected based on two levels of kidney injury (KDIGO Stage I versus KDIGO Stages II and III) and three levels of MELD (< 20, >= 20, and unable to calculate). We randomly selected a total of 42 blocks (504 inpatient admissions) to serve as the gold standard cohort.
2.4 Outcome
Two physician annotators reviewed the 504 hospitalizations reviewing all clinical notes, relevant laboratory values, medications, and radiology reports to assign each hospitalization into one of five categories: HRS Type I, HRS Type II, HRS Type Indeterminate, Maybe HRS, and Not HRS. Reviewers were instructed to differentiate Type I, Type II, and Not HRS based on International Ascites Club criteria.13 Type Indeterminate was reserved for cases where the reviewer felt the patient had enough evidence for HRS, but could not differentiate between Type I and II; whereas, Maybe HRS was reserved for cases of clinical uncertainty. We employed a practice phase where the two annotators worked in blocks of twelve patients until the inter-annotator agreement was ≥ 0.8. Disagreements on the 504 patient set were adjudicated by a board certified nephrologist. We report the inter-annotator agreement for the 504 charts that were reviewed. To reduce the problem to a two-class classification measure, we combined HRS Type I, Type II, Type Indeterminate, and Maybe HRS into a “Yes HRS” category. We performed a sensitivity analysis to examine classification performance after excluding “Maybe HRS” from model building and validation.
2.5 Predictor Variables
We included 649 variables from the structured data in the EHR, including demographics (3), laboratory values (92), vital signs (21), home medications (99), inpatient medications (116), medical history (129), inpatient diagnoses and procedures (176), and four other miscellaneous variables. To the structured data we added nine engineered variables comprised of the patient’s creatinine response to various events during hospitalization. Variable engineering was performed using the training set and validated on the test set prior to inclusion. A detailed summary of these variables and associated definitions are included in Online Appendix A.1 and A.2. To the structured variables, we added variables from natural language processing of the clinical notes as outlined in the next section.
With the exception of cirrhosis-related or nephrotoxic medications (e.g., lactulose, rifaximin, albumin, norepinephrine, cyclosporine), which were coded as separate variables, all medications were represented by their corresponding VA drug class code (e.g., “cephalosporin 3rd generation”). The VA drug class codes are available publicly through the VA National Drug File.59 With the exception of three prehospitalization laboratory variables, the inpatient laboratory values and vital signs were summarized by their maximum, minimum, and mean or median. Missing values for laboratory test results were filled in using Markov Chain Monte Carlo multiple imputation using a subset of co-morbid conditions, medications, and procedures (See Online Appendix A.3).60
2.6 Natural Language Processing
We filtered all available clinical notes based on authorship by first including only physicians and advanced practice providers, and then excluding specialties unlikely to address hepatic pathology (podiatry, ophthalmology, and dentistry). We converted the documents into a string of CUIs mapped to the UMLS (version 2013AB)57 using the clinical Text Analysis Knowledge Extraction System (cTAKES) version 3.2.44 To manage the large number of unique CUIs and data sparsity, based on inspection and evaluation of instability of modeling within the training data, we first filtered the output by removing CUIs with a less than 2% or greater than 90% prevalence among documents. All CUI counts were log transformed. From this data, we evaluated nine different dimensionality reduction techniques: (1) using the full set of CUIs; (2) CUIs limited by semantic type; (3) CUIs aggregated by semantic similarity; (4) document embedding using the raw text; (5) document embedding using CUIs; (6) an a priori selection of CUIs based on domain knowledge; (7) Yu’s Automated Feature Extraction for Phenotyping (AFEP);10 (8) Yu’s Surrogate-Assisted Feature Extraction (SAFE);9 and (9) principal component analysis (PCA). We refer the reader to Online Appendix Tables A.4, A.5, and A.8 for the list of semantic type filters, a priori selected CUIs, and AFEP/SAFE selected CUIs, respectively.
To aggregate CUIs by semantic similarity we first limited by semantic type and then constructed a pairwise similarity matrix using the Information Content based on the Leacock and Chodorow distance measure, which has been shown to exhibit good performance when compared against other semantic similarity measures.61 We subsequently performed k-medoids clustering to find groups of similar CUIs. Seventy clusters were chosen using the gap statistic and the “1-standard-error” rule.62 For models (4) and (5) we used the Distributed Memory Model of Paragraph Vectors (doc2vec)51 as implemented by the python gensim package.63 We utilize the term “document embedding,” as opposed to “word embedding,” signifying doc2vec’s ability to consume variable length text, and therefore obviate the need to combine word vectors. Similar to Turner et al.56 we pre-processed raw text by removing non-alpha numeric characters and eliminating stopwords before using the doc2vec algorithm to generate vectors. No processing of the CUIs was performed other than the default parameters within cTAKES. For PCA, we kept sufficient components (395) to explain 95% of the variance. Refer to Figure 1 for the workflow.
Figure 1. Workflow describing Natural Language Processing pipeline.

(Note: cTAKES: clinical Text Analysis Knowledge Extraction System; CUI: Concept Unique Identifier; AFEP: Automated Feature Extraction for Phenotyping; SAFE: Surrogate-Assisted Feature Extraction; PCA: Principal Component Analysis)
2.7 Final Phenotyping Model Development
We tested five different classification models: logistic regression (LR), support vector machines (SVM), gradient boosting (GBM), random forest, and naïve Bayes. For LR and naïve Bayes we first performed variable selection using penalized LR, using the L1 penalty (Least Absolute Shrinkage and Selection Operator—LASSO), to select a subset of the predictor variables.42 For the remainder of the models we used the full set of predictor variables. The hyperparameters for SVM, GBM, and random forest were optimized using five-fold cross validation on the training set. A Gaussian distribution was assumed for naïve Bayes.
2.8 NLP Dimensionality Reduction and Phenotyping Model Assessment
We assessed the NLP dimensionality reduction techniques by constructing an SVM model using only the NLP variables with HRS as the outcome measure. The Radial Basis Function served as the SVM kernel and hyperparameters, C and γ, were optimized using grid search and 5-fold cross validation. While it is possible that the dimensionality reduction techniques may perform differently using an alternative model assessment method, we elected to test NLP variables with an SVM model because we wanted to utilize a method that had a low bias and few assumptions about the model parameter development, to allow for complex interactions to be discoverable in the CUI data. While this can result in high variance, we limited the values of C in the grid search to prevent very small C values that would increase the variance and over-fitting to observed data. In addition, this machine learning framework has been shown to work well with NLP variables.1,65,66
Performance of the NLP dimension reduction technique and the final phenotyping algorithm were calculated using bootstrapping (100 bootstrap samples) to estimate discrimination (area under the receiver operating characteristic [ROC] curve [AUC], F1-measure, precision, recall) and calibration (slope and intercept of the best fit line through the observed to predicted probability plot and Brier score) metrics.67,68 We defined statistical significance as non-crossing of the 95% bootstrapped confidence intervals. We compared the discriminatory performance of the machine learning algorithms to the ICD-9 code.
We conducted an error analysis using the best machine learning method and studied the false positives and false negatives. We looked at false positives and false negatives at three cut-points for the probabilistic phenotype: the optimal sensitivity and specificity based on Youden’s index, sensitivity of 0.95, and specificity of 0.95. For each of these scenarios, we examined the annotators’ notes on the gold standard to understand why the errors occurred.
3. Results
Based on manual annotation there were 87 cases with Type I HRS, 19 with Type II HRS, 16 with Type Indeterminate, 88 with Maybe HRS, and 294 without HRS. Table 2 shows a summary of the cohort after the case annotations were dichotomized as noted in the methods, resulting in a total of 210 (41.7%) hospitalizations with HRS. Eighty cases were adjudicated, yielding a weighted Cohen’s kappa of 0.83. Males represented 98.2% of the total admissions, with a median age of 61. White patients accounted for the majority of hospital admissions (71.1%). The sensitivity, specificity, positive predictive value (PPV), and negative predictive value (NPV) of a discharge ICD-9 code for HRS were 57.6%, 88.8%, 78.6%, and 74.6%, respectively. The sensitivity, specificity, PPV, and NPV of an HRS ICD-9 code at any time during hospitalization were 87.1%, 76.5%, 72.6%, and 89.3%, respectively.
Table 2.
Characteristics of the cohort of cirrhotic patients with and without HRS as determined by chart review.
| Characteristic | HRS Diagnosis (n = 210) | No HRS Diagnosis (n = 294) |
|---|---|---|
| DEMOGRAPHICS | ||
| Age, mean (SD) | 60 (7.9) | 62 (10.2) |
| Gender (male), n (%) | 208 (99.0%) | 292 (99.3%) |
| Race, n (%) | ||
| White | 154 (73.3%) | 201 (68.4%) |
| Black | 28 (13.3%) | 65 (22.1%) |
| Other | 28 (13.3%) | 28 (9.5%) |
| PRE-ADMISSION CHARACTERISTICS | ||
| Cirrhosis Etiology, n (%)1 | ||
| Alcoholic | 130 (61.9%) | 151 (51.4%) |
| Viral (Hepatitis B and C) | 112 (53.3%) | 130 (44.2%) |
| NAFLD | 31 (14.7%) | 41 (13.9%) |
| Congestive Heart Failure, n (%) | 19 (9.0%) | 61 (20.7%) |
| Diabetes Mellitus, n (%) | 59 (28.1%) | 122 (41.5%) |
| Chronic Kidney Disease, n (%) | 20 (9.5%) | 54 (18.4%) |
| Prior Cirrhosis Complications, n (%) | ||
| Hepatic Encephalopathy | 75 (35.7%) | 61 (20.7%) |
| Varices | 58 (27.6%) | 66 (22.4%) |
| SBP | 30 (14.3%) | 19 (6.5%) |
| Ascites | 122 (58.1%) | 132 (44.9%) |
| Hepatocellular Carcinoma | 28 (13.3%) | 22 (7.5%) |
| Baseline Creatinine, mean (SD) | 1.04 (0.42) | 1.15 (0.49) |
| INDEX HOSPITALIZATION CHARACTERISTICS | ||
| Maximum Creatinine, mean (SD) | 4.16 (2.10) | 2.75 (1.50) |
| Maximum Blood Urea Nitrogen, mean (SD) | 78.2 (49.0) | 49.9 (26.0) |
| Average Sodium, mean (SD) | 132.6 (5.7) | 135.8 (5.0) |
| Average Bilirubin, mean (SD) | 12.7 (11.5) | 4.4 (6.2) |
| Average Albumin, mean (SD) | 2.4 (0.6) | 2.6 (0.7) |
| Average INR, mean (SD) | 2.0 (0.7) | 1.7 (0.7) |
| Admission MELD, mean (SD) | 26.3 (8.4) | 20.5 (7.1) |
| Discharge HRS ICD-9 Code, n (%) | 170 (81.0%) | 63 (21.4%) |
Note: A patient may have more than one etiology of cirrhosis, hence percentages add up to greater than 100%.
There were a total of 23,415 distinct CUIs within the entire document corpus, and a total of 6,985 distinct CUIs after initial frequency filtering. Limiting based on semantic type reduced the total number of distinct CUIs to 2082. The median number of CUIs per cluster was 12 (IQR: 5 – 18). AFEP and SAFE selected thirty-six and three CUIs, respectively. Table 3 presents the total number of variables and evaluation results for each of the nine NLP strategies. Document embedding using CUIs (AUC of 0.79, 95% CI: 0.79 – 0.80) significantly improved performance compared to embedding using raw text (AUC of 0.66, 95% CI 0.66 – 0.67). The a priori CUI selection, semantically informed clustering, and the high-throughput phenotyping methods (SAFE and AFEP) had statistically similar performance (AUC of 0.81 – 0.82). The a priori CUI set was selected for further analysis due to their clinical relevance and ease of interpretation.
Table 3.
Evaluation of dimension reduction techniques for handling Natural Language Processing outputs for phenotyping.
| Model | No. of Variables | Precision | Recall | F-measure | AUC |
|---|---|---|---|---|---|
| Full CUI Set | 13,970¥ | 0.56 (0.55, 0.57) |
0.84 (0.83, 0.84) |
0.68 (0.67, 0.70) |
0.74 (0.74, 0.75) |
| Semantic Type Limited CUI Set | 4,164¥ | 0.63 (0.62, 0.64) |
0.80 (0.79, 0.81) |
0.70 (0.68, 0.71) |
0.73 (0.72, 0.73) |
| AFEP | 37 | 0.66 (0.65, 0.67) |
0.84 (0.83, 0.86) |
0.74 (0.73, 0.74) |
0.82 (0.81, 0.82) |
| SAFE | 4 | 0.73 (0.72, 0.74) |
0.79 (0.78, 0.80) |
0.76 (0.75, 0.76) |
0.82 (0.81, 0.82) |
| Principal Component Analysis | 395 | 0.53 (0.52, 0.54) |
0.77 (0.74, 0.80) |
0.61 (0.60, 0.63) |
0.57 (0.56, 0.57) |
| Document Embedding with Raw Text | 500 | 0.58 (0.57, 0.59) |
0.65 (0.62, 0.67) |
0.60 (0.59, 0.61) |
0.66 (0.66, 0.67) |
| Document Embedding with CUIs | 500 | 0.66 (0.65, 0.67) |
0.79 (0.78, 0.81) |
0.72 (0.71, 0.72) |
0.79 (0.79, 0.80) |
| Clustered CUIs | 140¥ | 0.72 (0.71, 0.73) |
0.78 (0.77, 0.79) |
0.73 (0.72, 0.73) |
0.82 (0.81, 0.82) |
| A priori CUIs | 52¥ | 0.66 (0.65, 0.67) |
0.84 (0.83, 0.85) |
0.74 (0.73, 0.74) |
0.81 (0.80, 0.81) |
Note:
: the counts for these models are doubled because they include both the positive assertion and the negative assertion; AFEP and SAFE include an extra variable for note count. AFEP: Automated Feature Extraction for Phenotyping; SAFE: Surrogate-Assisted Feature Extraction; CUI: Concept Unique Identifier; AUC: Area Under the Curve.
Combining the structured and NLP variables, there were a total of 701 candidate predictors. LASSO selected 21 variables. The results of the model comparisons are shown in Table 4. Logistic regression had the best performance in terms of AUC, though modest performance in terms of calibration. Figure 2 shows the ROC curves with 95% confidence intervals for the 5 methods. The sensitivity and specificity are also plotted for the HRS ICD-9 code (both for a discharge ICD-9 code and any ICD-9 code during the inpatient stay). Logistic regression dominated the other methods and was superior to using just the ICD-9 code. Figure 3 shows the smoothed calibration curves for the different methods based on Van Hoorde et al.68 Though calibration appears relatively uniform for regression, GBM, SVM, and random forest based on the Brier score; the calibration curve shows GBM and SVM had superior performance. As part of our sensitivity analysis, appendix Table A.6 shows the classifier performance after building the five classifiers after excluding “Maybe HRS” from the model building and validation. We note slight improvement for regression (AUC of 0.94); however, we elected to maintain “Maybe HRS” within the model to account for edge cases. By varying the probability threshold, the user may include/exclude clinically uncertain cases. Appendix Table A.7 shows model performance using the SAFE CUIs for comparison. Overall model performance for logistic regression is largely unchanged, though the individual variables selected by LASSO identify more structured variables to make up for the fewer NLP variables.
Table 4.
Discrimination and calibration performance of the five models to phenotype Hepatorenal Syndrome.
| Model | AUC (95% CI) | Slope (95% CI) | Intercept (95% CI) | Brier Score (95% CI) |
|---|---|---|---|---|
| Logistic Regression | 0.93 (0.92, 0.93) | 0.68 (0.65, 0.71) | 0.18 (0.13, 0.24) | 0.11 (0.11, 0.11) |
| Gradient Boosting | 0.88 (0.88,0.88) | 1.26 (1.21, 1.31) | 0.15 (0.10, 0.20) | 0.14 (0.13, 0.14) |
| Naïve Bayes | 0.73 (0.72, 0.74) | 0.04 (0.03, 0.04) | −0.41 (−0.53, − 0.29) | 0.32 (0.30, 0.33) |
| Random Forest | 0.91 (0.91, 0.91) | 2.01 (1.95, 2.06) | 0.29 (0.24, 0.35) | 0.13 (0.13, 0.13) |
| Support Vector Machine | 0.90 (0.90, 0.91) | 0.74 (0.71, 0.77) | −0.12 (−0.17, − 0.07) | 0.13 (0.12, 0.13) |
Note: Slope and Intercept refer to the parameters of the best-fit line through the observed-to-predicted probability plot; AUC: Area Under the Curve
Figure 2. Receiver Operating Characteristic curves for the five different various models for phenotyping Hepatorenal Syndrome phenotyping models.
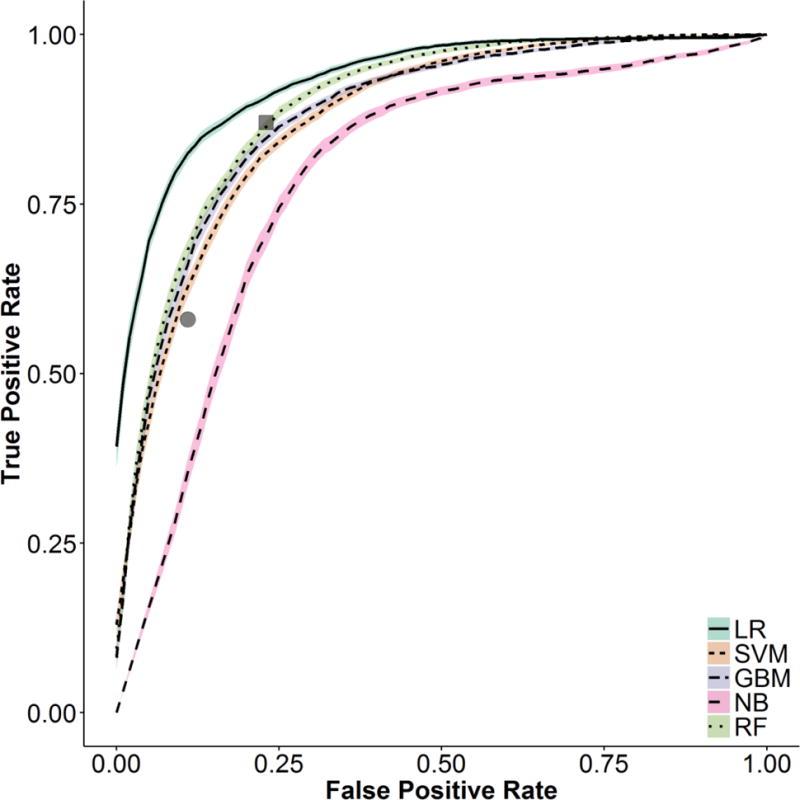
(Note: The grey square represents performance for a Hepatorenal Syndrome ICD-9 code anytime during the admission. The grey circle represents a Hepatorenal Syndrome ICD-9 code as a discharge diagnosis. LR: Logistic Regression; SVM: Support Vector Machine; GBM: Gradient Boosting Machine; NB: Naïve Bayes; RF: Random Forest)
Figure 3. Smoothed calibration curves for the observed-to-expected predicted probability plots for the five different various methods.

(Note: LR: Logistic Regression; SVM: Support Vector Machine; GBM: Gradient Boosting Machine; NB: Naïve Bayes; RF: Random Forest)
Table 5 reports the odds ratios for the variables used in the LR model. Significant variables predictive of HRS include an ICD-9 code for HRS, NLP mention of HRS, inpatient use of midodrine, the peak serum creatinine after the first 48 hours of admission, and the average mean corpuscular hemoglobin concentration (MCHC). Variables predictive of other causes of renal failure include an ICD-9 code for acute tubular necrosis (ATN), NLP mention of shock, high urine sodium, a significant difference between the maximum inpatient serum creatinine versus at discharge, and higher serum sodium.
Table 5.
Odds ratios and confidence intervals for the logistic regression model based on 100 bootstrap samples.
| Variable | Odds Ratio (95% CI) | Variable | Odds Ratio (95% CI) |
|---|---|---|---|
| Inpatient Labs | – | Temporal | – |
| Average Serum Sodium | 0.67 (0.64, 0.70) | Creatinine Diff. (max inpt. to discharge) | 0.21 (0.20, 0.23) |
| Average Urine Sodium | 0.73 (0.70, 0.77) | Creatinine Diff. (1st 48 hours vs. rest of stay) | 0.55 (0.51, 0.60) |
| Average Bicarbonate | 0.79 (0.76, 0.83) | Peak Creatinine After First 48h | 1.78 (1.66, 1.91) |
| Minimum Albumin | 0.84 (0.81, 0.88) | ||
| Average Glucose | 0.94 (0.90, 0.97) | ICD 9 Codes | – |
| Average Total Bilirubin | 1.15 (1.09, 1.20) | Inpatient ATN | 0.40 (0.36, 0.45) |
| Minimum INR | 1.16 (1.11, 1.21) | Inpatient NAFLD | 1.07 (1.03, 1.11) |
| Average Blood Urea Nitrogen | 1.16 (1.07, 1.26) | Inpatient Ascites | 1.59 (1.51, 1.67) |
| Minimum Blood Urea Nitrogen | 1.77 (1.63, 1.93) | Inpatient HRS | 9.98 (9.12, 10.93) |
| Average MCHC | 1.96 (1.87, 2.05) | ||
| NLP | – | ||
| Inpatient Medications | – | (+) Shock | 0.21 (0.20, 0.23) |
| Midodrine | 3.24 (2.89, 3.62) | (+) Paracentesis | 1.37 (1.30, 1.43) |
| (+) HRS | 1.78 (1.67, 1.90) |
(Note: INR: International Normalized Ratio; MCHC: Mean Corpuscular Hemoglobin Concentration; NLP: Natural Language Processing; HRS: Hepatorenal Syndrome; ATN: Acute Tubular Necrosis; NAFLD: Non-alcoholic Fatty Liver Disease)
Table 6 reports our error analysis at three levels of cut-offs: optimal using Youden’s index, high sensitivity, and high specificity. As expected, false positives versus false negatives dominate at higher sensitivity and higher specificity, respectively. False positives at high sensitivity are primarily caused by the algorithm’s inability to detect improvement with fluid administration, separating chronic kidney disease from HRS, and other causes of AKI in cirrhotics. At higher specificity, false negatives are caused by high urine sodium, chronic kidney disease, and competing diagnoses. At an optimal threshold, the majority of errors stemmed from an inability to identify improvement with fluid administration. Insufficient information caused errors at all cut-points, though a relatively small percentage of errors.
Table 6.
Error analysis of false positive and false negatives using the logistic regression model on the test set at three different thresholds.
| Sensitivity = 0.95 | Specificity = 0.95 | Optimal Threshold (Youden’s Index) | ||||
|---|---|---|---|---|---|---|
| FP (n=21) | FN (n=3) | FP (n=3) | FN (n=15) | FP (n=9) | FN (n=5) | |
| High Urine Sodium | 2 | 3 | 2 | |||
| Improved with fluids | 9 | 1 | 1 | 5 | ||
| CKD | 4 | 2 | 2 | |||
| Competing Diagnosis (sepsis) | 2 | 1 | ||||
| Competing Diagnosis (contrast) | 1 | 1 | ||||
| Competing Diagnosis (ATN) | 1 | 1 | 1 | |||
| Competing Diagnosis (hypotension or shock) | 1 | 2 | 1 | |||
| Competing Diagnosis (multiple) | 1 | 1 | ||||
| Competing Diagnosis (GI Bleed) | 1 | 1 | ||||
| Competing Diagnosis (HIVAN) | 1 | |||||
| Insufficient Information | 1 | 1 | 1 | 3 | 1 | |
| Error in Underlying Data | 1 | |||||
Note: FP: False Positive; FN: False Negative; CKD: Chronic Kidney Disease; ATN: Acute Tubular Necrosis; GI: Gastrointestinal; HIVAN: Human Immunodeficiency Virus Associated Nephropathy
4. Discussion
This research demonstrates that it is possible to create a high performance probabilistic phenotyping algorithm to detect cases of HRS. This is one of the first efforts to phenotype AKI etiology, a condition that effects up to 2% of hospitalized patients.69 Penalized LR achieved the best performance with an AUC of 0.93 (95% CI: 0.92–0.93). NLP significantly boosted the performance of the model from an AUC of 0.82 (95% CI: 0.81–0.83). The sensitivity and specificity of an ICD-9 code anytime during the hospitalization were 87.1% and 76.5%, respectively; whereas, a discharge ICD-9 code had a sensitivity and specificity of 57.6% and 88.8%, respectively. At Youden’s index, the LR algorithm would have a sensitivity of 85.4% and a specificity of 84.0%. The probabilistic phenotyping algorithm allows one to alter the thresholds for varying levels of sensitivity and specificity depending on the needs of the user.
Optimizing the algorithm required handling the large number of NLP variables. Automated dimensionality reduction in NLP based classification has been shown to improve performance in multiple studies.70–72 Increasing effort has been placed on high-throughput phenotyping to perform automated feature selection/dimension reduction, though to date they have been primarily tested in chronic conditions where the data density is much higher. In our study, manual NLP variable selection using domain knowledge performed similarly to dimensionality reduction using SAFE, AFEP, and semantic similarity informed clustering. Manual variable selection has been shown to perform favorably in other studies.73,74 For instance, Chen et. al. showed that a feature set selected by domain experts outperformed a data driven approach in phenotyping algorithms for Rheumatoid Arthritis, Colorectal Cancer, and Venous Thromboembolism.75
Although embeddings have been used for phenotyping tasks, we demonstrate its performance in acute illness and using CUIs instead of raw text.55,56 Turner et al. showed their word embedding task using raw text outperformed bag-of-words models but did not outperform machine learning models using CUIs. We show that CUI based models (including embedding) outperform embedding models using free text. Increasing effort is being applied to mapping free text to a domain ontology for purposes of improving a wide variety of NLP tasks70,76 and constructing shareable, computable clinical data warehouses.77
Though machine learning algorithms are increasingly popular for cohort identification,1 our study showed superior performance with penalized LR. Regression has been used for phenotyping efforts78 and, in at least one risk prediction study comparing regression to machine learning models, regression performed better.79 Machine learning methods such as support vector machines and random forests tend to perform well on classification tasks where multiple interactions exist between the predictor variables, which suggests that complex interactions may not have been highly prevalent in these data. Additionally, despite the better discriminatory power of the logistic regression model, calibration was better with gradient boosting and support vector machines, which suggests that for some cut-points performance may still favor the machine learning methods.
The most important variable based on odds ratio was the HRS ICD-9 code. Inpatient codes for ascites also significantly increased the probability of HRS. This makes pathophysiologic sense because development of ascites and HRS are tightly related, particularly in HRS Type II. Inpatient administration of midodrine, a medication that increases the blood pressure, was significantly predictive of HRS. This is also a logical finding because midodrine is used in only a few contexts in medicine and one of them is treatment of HRS. NLP variables that were predictive of HRS include mention of HRS and mention of paracentesis (removal of accumulated fluid in the abdomen), which is indicative of the presence of clinically significant ascites. Predictors with good negative predictive value for HRS include variables that indicate less severe portal hypertension (increased blood pressure in the abdominal blood vessels), other causes of acute kidney injury (ATN and shock), and significant improvement in creatinine levels at time of discharge.
To better understand failure points and edge cases, we performed an error analysis, revealing three common themes. First, errors were made in the system assessing response to fluid administration. In essence, this is a temporal pattern recognition problem. Though some temporal type variables were included in the model, they were insufficient to capture the full variation of response waveforms. Second, there were challenges differentiating HRS from other causes of kidney failure in cirrhotics. HRS is commonly one of several competing diagnoses in clinical practice when diagnosing the etiology of AKI in cirrhosis. The phenotyping system performed well in most cases. Finally, insufficient information caused a low level of persistent error across all cut-points. While this is unavoidable when using retrospective data, it may be mitigated when using the system prospectively. Importantly, our probabilistic phenotyping model allows the user to tailor the cutoff to the intended use: higher sensitivity for clinical decision support and higher specificity for defining cohorts in secondary data use analyses.
4.1 Limitations
There are some limitations to this research that are worth highlighting for refinement and extension of this investigation. First, this is a retrospective observational cohort and there were gaps in documentation that likely lowered ascertainment from chart review for the phenotype. Second, the VA data may not be representative of other clinical environments due to the slightly older average age and predominance of men. The other clinical variables, however, are not significantly different than other studies published regarding HRS.30,80,81 We only performed internal validation; however, we aimed to increase generalizability by sampling across a broad range of kidney injury and liver disease. Moreover, all variables are common to other electronic health records, and the selected variables make pathophysiologic sense. Third, several significant predictors were ICD-9 codes, but with the transition to ICD-10 in the US, the algorithm’s performance cannot be assured. At the same time, it is worth noting that there are one-to-one mappings for two of the important ICD-9 codes (ATN and HRS) based on the General Equivalent Maps (GEMs) framework.82 The code sets defining non-alcoholic fatty liver disease and ascites would require additional validation.
NLP dimension reduction was assessed with SVM, and it is possible that an alternate method may have ranked the methods in a different order. We did not test expectation-maximization methods of clustering, such as Gaussian mixture modeling, for dimension reduction as we do not know the inherent probability distribution of the data. Lastly, a more thoughtful exploration of mapping temporal changes using established methods may have improved performance.83–85
4.2 Conclusion
This study demonstrated the utility of a probabilistic phenotype that used machine learning based methods to retrospectively classify patients with HRS. Though we focused on one form of AKI due to its high mortality, lessons learned could be applied to phenotyping other forms of kidney injury. Domain knowledge and several automated dimension reduction methods demonstrated similar performance for identifying acute illness. Penalized logistic regression identified a parsimonious set of features with excellent performance. Unlike the fixed sensitivity and specificity of the HRS ICD-9 code, this probabilistic model can be used at multiple set points depending on the use case (e.g., a bias towards specificity or sensitivity). Future directions include external validation and identifying HRS cohorts for predictive analytics, clinical decision making, and population management.
Supplementary Material
Highlights.
Computational phenotype for Hepatorenal Syndrome
Performance of Natural Language Processing dimension reduction techniques
Document embedding using Concept Unique Identifiers for phenotyping
Assessment of high-throughput phenotyping for acute illness
Acknowledgments
The authors would like to thank the National Institute of Diabetes and Digestive and Kidney Diseases, National Institutes of Health for copyright free use of the images found in the graphical abstract.
Funding: JK was supported by the Department of Veterans Affairs, Office of Academic Affiliations, Advanced Fellowship Program in Medical Informatics, and the Department of Biomedical Informatics, Vanderbilt University, Nashville, TN. SED was supported by the National Library of Medicine (5T15LM007450). SKP was supported by the Department of Veterans Affairs, Office of Academic Affiliations, Advanced Fellowship Program in Medical Informatics, and the Department of Biomedical Informatics, Vanderbilt University, Nashville, TN. BAM was supported by the National Center for Advancing Translational Sciences (UL1 TR000445) and the National Science Foundation (IIS1418504). MEM received support from Veterans Health Administration Health Services Research & Development (HSR&D) Investigator Initiated Research (IIR 13-052, IIR 11-292). SBH was supported by VA HSR&D IIR (13-052).
Abbreviations
- EHR
Electronic Health Record
- AKI
Acute Kidney Injury
- HRS
Hepatorenal Syndrome
- ICD
International Classification of Diseases
- NLP
Natural Language Processing
- VA
Veterans Affairs
- CPT
Current Procedural Terminology
- KDIGO
Kidney Disease Improving Global Outcomes
- MELD
Model for End Stage Liver Disease
- SVM
Support Vector Machine
- LR
Logistic Regression
- LASSO
Least Absolute Shrinkage and Selection Operator
- ROC
Receiver Operating Characteristic
- AUC
Area Under the Curve
- CUI
Concept Unique Identifier
- GBM
Gradient Boosting Machine
- ATN
Acute Tubular Necrosis
- MCHC
Mean Corpuscular Hemoglobin Concentration
- NAFLD
Non-Alcoholic Fatty Liver Disease
- INR
International Normalized Ratio
- CKD
Chronic Kidney Disease
- HIVAN
Human Immunodeficiency Virus Associated Nephropathy
- AFEP
Automated Feature Extraction for Phenotyping
- SAFE
Surrogate-Assisted Feature Extraction
Footnotes
Publisher's Disclaimer: This is a PDF file of an unedited manuscript that has been accepted for publication. As a service to our customers we are providing this early version of the manuscript. The manuscript will undergo copyediting, typesetting, and review of the resulting proof before it is published in its final citable form. Please note that during the production process errors may be discovered which could affect the content, and all legal disclaimers that apply to the journal pertain.
References
- 1.Shivade C, et al. A review of approaches to identifying patient phenotype cohorts using electronic health records. J Am Med Inform Assoc. 2014;21:221–230. doi: 10.1136/amiajnl-2013-001935. [DOI] [PMC free article] [PubMed] [Google Scholar]
- 2.Xu J, et al. Review and evaluation of electronic health records-driven phenotype algorithm authoring tools for clinical and translational research. J Am Med Inform Assoc. 2015;22:1251–1260. doi: 10.1093/jamia/ocv070. [DOI] [PMC free article] [PubMed] [Google Scholar]
- 3.Gottesman O, et al. The Electronic Medical Records and Genomics (eMERGE) Network: past, present, and future. Genet Med. 2013;15:761–771. doi: 10.1038/gim.2013.72. [DOI] [PMC free article] [PubMed] [Google Scholar]
- 4.Kirby JC, et al. PheKB: a catalog and workflow for creating electronic phenotype algorithms for transportability. J Am Med Inform Assoc. 2016;23:1046–1052. doi: 10.1093/jamia/ocv202. [DOI] [PMC free article] [PubMed] [Google Scholar]
- 5.Hripcsak G, Albers DJ. Next-generation phenotyping of electronic health records. J Am Med Inform Assoc. 2013;20:117–121. doi: 10.1136/amiajnl-2012-001145. [DOI] [PMC free article] [PubMed] [Google Scholar]
- 6.Richesson RL, Sun J, Pathak J, Kho AN, Denny JC. Clinical phenotyping in selected national networks: demonstrating the need for high-throughput, portable, and computational methods. Artif Intell Med. 2016;71:57–61. doi: 10.1016/j.artmed.2016.05.005. [DOI] [PMC free article] [PubMed] [Google Scholar]
- 7.Pathak J, Kho AN, Denny JC. Electronic health records-driven phenotyping: challenges, recent advances, and perspectives. J Am Med Inform Assoc. :e206–e211. doi: 10.1136/amiajnl-2013-002428. [DOI] [PMC free article] [PubMed] [Google Scholar]
- 8.Halpern Y, Horng S, Choi Y, Sontag D. Electronic medical record phenotyping using the anchor and learn framework. J Am Med Inform Assoc. 2016;23:731–740. doi: 10.1093/jamia/ocw011. [DOI] [PMC free article] [PubMed] [Google Scholar]
- 9.Yu S, et al. Surrogate-assisted feature extraction for high-throughput phenotyping. J Am Med Inform Assoc. 2017;24:e143–e149. doi: 10.1093/jamia/ocw135. [DOI] [PMC free article] [PubMed] [Google Scholar]
- 10.Yu S, et al. Toward high-throughput phenotyping: unbiased automated feature extraction and selection from knowledge sources. J Am Med Inform Assoc. 2015;22:993–1000. doi: 10.1093/jamia/ocv034. [DOI] [PMC free article] [PubMed] [Google Scholar]
- 11.Findlay M, Isles C. Clinical Companion in Nephrology. Springer International Publishing; 2015. Causes of Acute Kidney Injury; pp. 45–52. [DOI] [Google Scholar]
- 12.Quan H, Parsons GA, Ghali WA. Validity of information on comorbidity derived rom ICD-9-CCM administrative data. Med Care. 2002;40:675–685. doi: 10.1097/00005650-200208000-00007. [DOI] [PubMed] [Google Scholar]
- 13.Salerno F, Gerbes A, Gines P, Wong F, Arroyo V. Diagnosis, prevention and treatment of hepatorenal syndrome in cirrhosis. Gut. 2007;56:1310–1318. doi: 10.1136/gut.2006.107789. [DOI] [PMC free article] [PubMed] [Google Scholar]
- 14.EASL clinical practice guidelines on the management of ascites, spontaneous bacterial peritonitis, and hepatorenal syndrome in cirrhosis. J Hepatol. 2010;53:397–417. doi: 10.1016/j.jhep.2010.05.004. [DOI] [PubMed] [Google Scholar]
- 15.Wadei HM. Hepatorenal syndrome: a critical update. Semin Respir Crit Care Med. 2012;33:55–69. doi: 10.1055/s-0032-1301735. [DOI] [PubMed] [Google Scholar]
- 16.Kim WR, Brown RS, Terrault NA, El-Serag H. Burden of liver disease in the United States: Summary of a workshop. Hepatology. 2002;36:227–242. doi: 10.1053/jhep.2002.34734. [DOI] [PubMed] [Google Scholar]
- 17.Younossi ZM, et al. Changes in the prevalence of the most common causes of chronic liver diseases in the United States from 1988 to 2008. Clin Gastroenterol Hepatol Off Clin Pract J Am Gastroenterol Assoc. 2011;9:524–530.e1. doi: 10.1016/j.cgh.2011.03.020. quiz e60. [DOI] [PubMed] [Google Scholar]
- 18.ASRANI SK, LARSON JJ, YAWN B, THERNEAU TM, KIM WR. Underestimation of Liver-Related Mortality in the United States. Gastroenterology. 2013;145:375–82.e1-2. doi: 10.1053/j.gastro.2013.04.005. [DOI] [PMC free article] [PubMed] [Google Scholar]
- 19.Schuppan D, Afdhal NH. Liver Cirrhosis. Lancet. 2008;371:838–851. doi: 10.1016/S0140-6736(08)60383-9. [DOI] [PMC free article] [PubMed] [Google Scholar]
- 20.Everhart JE, Ruhl CE. Burden of Digestive Diseases in the United States Part III: Liver, Biliary Tract, and Pancreas. Gastroenterology. 2009;136:1134–1144. doi: 10.1053/j.gastro.2009.02.038. [DOI] [PubMed] [Google Scholar]
- 21.Heidelbaugh JJ, Bruderly M. Cirrhosis and chronic liver failure: part I. Diagnosis and evaluation. Am Fam Physician. 2006;74:756–762. [PubMed] [Google Scholar]
- 22.Sherlock’s Diseases of the Liver and Biliary System. Wiley-Blackwell; 2011. [Google Scholar]
- 23.Brown JJ, Naylor MJ, Yagan N. Imaging of hepatic cirrhosis. Radiology. 1997;202:1–16. doi: 10.1148/radiology.202.1.8988182. [DOI] [PubMed] [Google Scholar]
- 24.Ginès A, et al. Incidence, predictive factors, and prognosis of the hepatorenal syndrome in cirrhosis with ascites. Gastroenterology. 1993;105:229–236. doi: 10.1016/0016-5085(93)90031-7. [DOI] [PubMed] [Google Scholar]
- 25.Wong F. Recent advances in our understanding of hepatorenal syndrome. Nat Rev Gastroenterol Hepatol. 2012;9:382–391. doi: 10.1038/nrgastro.2012.96. [DOI] [PubMed] [Google Scholar]
- 26.Management of Adult Patients with Ascites Due to Cirrhosis: Update 2012.
- 27.Angeli P, et al. Reversal of type 1 hepatorenal syndrome with the administration of midodrine and octreotide. Hepatology. 1999;29:1690–1697. doi: 10.1002/hep.510290629. [DOI] [PubMed] [Google Scholar]
- 28.Boyer TD, et al. Predictors of response to terlipressin plus albumin in hepatorenal syndrome (HRS) type 1: Relationship of serum creatinine to hemodynamics. J Hepatol. 2011;55:315–321. doi: 10.1016/j.jhep.2010.11.020. [DOI] [PMC free article] [PubMed] [Google Scholar]
- 29.Cavallin M, et al. Terlipressin plus albumin versus midodrine and octreotide plus albumin in the treatment of hepatorenal syndrome: A randomized trial. Hepatology. 2015;62:567–574. doi: 10.1002/hep.27709. [DOI] [PubMed] [Google Scholar]
- 30.Ghosh S, et al. Noradrenaline vs terlipressin in the treatment of type 2 hepatorenal syndrome: a randomized pilot study. Liver Int. 2013;33:1187–1193. doi: 10.1111/liv.12179. [DOI] [PubMed] [Google Scholar]
- 31.Al Sibae MR, Cappell MS. Accuracy of MELD scores in predicting mortality in decompensated cirrhosis from variceal bleeding, hepatorenal syndrome, alcoholic hepatitis, or acute liver failure as well as mortality after non-transplant surgery or TIPS. Dig Dis Sci. 2011;56:977–987. doi: 10.1007/s10620-010-1390-3. [DOI] [PubMed] [Google Scholar]
- 32.Guevara M, et al. Transjugular intrahepatic portosystemic shunt in hepatorenal syndrome: Effects on renal function and vasoactive systems. Hepatology. 1998;28:416–422. doi: 10.1002/hep.510280219. [DOI] [PubMed] [Google Scholar]
- 33.Brensing KA, et al. Long term outcome after transjugular intrahepatic portosystemic stent-shunt in non-transplant cirrhotics with hepatorenal syndrome: a phase II study. Gut. 2000;47:288–295. doi: 10.1136/gut.47.2.288. [DOI] [PMC free article] [PubMed] [Google Scholar]
- 34.Senzolo M, Cholongitas E, Tibballs J, Burroughs A, Patch D. Transjugular intrahepatic portosystemic shunt in the management of ascites and hepatorenal syndrome. J Gastroenterol. 2006;18:1143–1150. doi: 10.1097/01.meg.0000236872.85903.3f. [DOI] [PubMed] [Google Scholar]
- 35.Testino G, Leone S, Ferro C, Borro P. Severe acute alcoholic hepatitis and hepatorenal syndrome: role of transjugular intrahepatic portosystemic stent shunt. J Med Life. 2012;5:203–205. [PMC free article] [PubMed] [Google Scholar]
- 36.Sersté T, et al. Deleterious effects of beta-blockers on survival in patients with cirrhosis and refractory ascites. Hepatology. 2010;52:1017–1022. doi: 10.1002/hep.23775. [DOI] [PubMed] [Google Scholar]
- 37.Mandorfer M, et al. Nonselective β Blockers Increase Risk for Hepatorenal Syndrome and Death in Patients With Cirrhosis and Spontaneous Bacterial Peritonitis. Gastroenterology. 2014;146:1680–1690.e1. doi: 10.1053/j.gastro.2014.03.005. [DOI] [PubMed] [Google Scholar]
- 38.Krag A, Bendtsen F, Henriksen JH, Møller S. Low cardiac output predicts development of hepatorenal syndrome and survival in patients with cirrhosis and ascites. Gut. 2010;59:105–110. doi: 10.1136/gut.2009.180570. [DOI] [PubMed] [Google Scholar]
- 39.Carroll RJ, Eyler AE, Denny JC. Naïve Electronic Health Record Phenotype Identification for Rheumatoid Arthritis. AMIA Annu Symp Proc. 2011;2011:189–196. [PMC free article] [PubMed] [Google Scholar]
- 40.DeLisle S, et al. Combining free text and structured electronic medical record entries to detect acute respiratory infections. PloS One. 2010;5:e13377. doi: 10.1371/journal.pone.0013377. [DOI] [PMC free article] [PubMed] [Google Scholar]
- 41.Wei WQ, et al. Combining billing codes, clinical notes, and medications from electronic health records provides superior phenotyping performance. J Am Med Inform Assoc. 2016;23:e20–e27. doi: 10.1093/jamia/ocv130. [DOI] [PMC free article] [PubMed] [Google Scholar]
- 42.Friedman C, Shagina L, Lussier Y, Hripcsak G. Automated Encoding of Clinical Documents Based on Natural Language Processing. J Am Med Inform Assoc. 2004;11:392–402. doi: 10.1197/jamia.M1552. [DOI] [PMC free article] [PubMed] [Google Scholar]
- 43.Aronson AR. Effective mapping of biomedical text to the UMLS Metathesaurus: the MetaMap program. Proc AMIA Symp. 2001:17–21. [PMC free article] [PubMed] [Google Scholar]
- 44.Savova GK, et al. Mayo clinical Text Analysis and Knowledge Extraction System (cTAKES): architecture, component evaluation and applications. J Am Med Inform Assoc JAMIA. 2010;17:507–513. doi: 10.1136/jamia.2009.001560. [DOI] [PMC free article] [PubMed] [Google Scholar]
- 45.Denny JC, Irani PR, Wehbe FH, Smithers JD, Spickard A. The KnowledgeMap Project: Development of a Concept-Based Medical School Curriculum Database. AMIA Annu Symp Proc. 2003;2003:195–199. [PMC free article] [PubMed] [Google Scholar]
- 46.Koller D, Sahami M. Toward Optimal Feature Selection. Stanford InfoLab; 1996. [Google Scholar]
- 47.Yang Y, Pedersen JO. A Comparative Study on Feature Selection in Text Categorization. Morgan Kaufmann Publishers; 1997. pp. 412–420. [Google Scholar]
- 48.Levy O, Goldberg Y. Neural Word Embedding as Implicit Matrix Factorization. In: Ghahramani Z, Welling M, Cortes C, Lawrence ND, Weinberger KQ, editors. Advances in Neural Information Processing Systems 27. Curran Associates, Inc.; 2014. pp. 2177–2185. [Google Scholar]
- 49.Turian J, Ratinov L, Bengio Y. Proceedings of the 48th Annual Meeting of the Association for Computational Linguistics. Association for Computational Linguistics; 2010. Word Representations: A Simple and General Method for Semi-supervised Learning; pp. 384–394. [Google Scholar]
- 50.Mikolov T, Chen K, Corrado G, Dean J. Efficient Estimation of Word Representations in Vector Space. ArXiv13013781 Cs. 2013 [Google Scholar]
- 51.Le QV, Mikolov T. Distributed Representations of Sentences and Documents. ICML. 2014;14:1188–1196. [Google Scholar]
- 52.Yang CC, Zhao M. Determining Associations with Word Embedding in Heterogeneous Network for Detecting Off-Label Drug Uses. 2017 IEEE International Conference on Healthcare Informatics (ICHI) 2017:496–501. doi: 10.1109/ICHI.2017.78. [DOI] [Google Scholar]
- 53.Cocos A, Fiks AG, Masino AJ. Deep learning for pharmacovigilance: recurrent neural network architectures for labeling adverse drug reactions in Twitter posts. J Am Med Inform Assoc. 2017;24:813–821. doi: 10.1093/jamia/ocw180. [DOI] [PMC free article] [PubMed] [Google Scholar]
- 54.Baćac A. Classification of Large-Scale Biological Annotations Using Word Embeddings Derived from Corpora of Biomedical Research Literature. Fakultet Elektrotehnike i Računarstva, Sveučilište u Zagrebu; 2017. [Google Scholar]
- 55.Zhang Y, et al. Psychiatric symptom recognition without labeled data using distributional representations of phrases and on-line knowledge. J Biomed Inform. 2017 doi: 10.1016/j.jbi.2017.06.014. [DOI] [PMC free article] [PubMed] [Google Scholar]
- 56.Turner CA, et al. Word2Vec inversion and traditional text classifiers for phenotyping lupus. BMC Med Inform Decis Mak. 2017;17:126. doi: 10.1186/s12911-017-0518-1. [DOI] [PMC free article] [PubMed] [Google Scholar]
- 57.Unified Medical Language System (UMLS) Available at: https://www.nlm.nih.gov/research/umls/. (Accessed: 10th September 2016)
- 58.Brown SH, Lincoln MJ, Groen PJ, Kolodner RM. VistA—U.S. Department of Veterans Affairs national-scale HIS. Int J Med Inf. 2003;69:135–156. doi: 10.1016/s1386-5056(02)00131-4. [DOI] [PubMed] [Google Scholar]
- 59.VA National Drug File - Data.gov. Available at: https://catalog.data.gov/dataset/va-national-drug-file-may-2015. (Accessed: 13th June 2017)
- 60.Su YS, Yajima M, Gelman AE, Hill J. Multiple imputation with diagnostics (mi) in R: Opening windows into the black box. J Stat Softw. 2011;45:1–31. [Google Scholar]
- 61.Sánchez D, Batet M. Semantic similarity estimation in the biomedical domain: An ontology-based information-theoretic perspective. J Biomed Inform. 2011;44:749–759. doi: 10.1016/j.jbi.2011.03.013. [DOI] [PubMed] [Google Scholar]
- 62.Tibshirani R, Walther G, Hastie T. Estimating the number of clusters in a data set via the gap statistic. J R Stat Soc Ser B Stat Methodol. 2001;63:411–423. [Google Scholar]
- 63.Řehůřek R, Sojka P. Proceedings of the LREC 2010 Workshop on New Challenges for NLP Frameworks. ELRA; 2010. Software Framework for Topic Modelling with Large Corpora; pp. 45–50. [Google Scholar]
- 64.Tibshirani R. Regression Shrinkage and Selection Via the Lasso. J R Stat Soc Ser B. 1994;58:267–288. [Google Scholar]
- 65.Bekkerman R, El-Yaniv R, Tishby N, Winter Y. Distributional Word Clusters vs. Words for Text Categorization. J Mach Learn Res. 2003;3:1183–1208. [Google Scholar]
- 66.Dumais S, Platt J, Heckerman D, Sahami M. Proceedings of the Seventh International Conference on Information and Knowledge Management. ACM; 1998. Inductive Learning Algorithms and Representations for Text Categorization; pp. 148–155. [DOI] [Google Scholar]
- 67.Steyerberg EW, et al. Assessing the performance of prediction models: a framework for some traditional and novel measures. Epidemiol Camb Mass. 2010;21:128–138. doi: 10.1097/EDE.0b013e3181c30fb2. [DOI] [PMC free article] [PubMed] [Google Scholar]
- 68.Van Hoorde K, Van Huffel S, Timmerman D, Bourne T, Van Calster B. A spline-based tool to assess and visualize the calibration of multiclass risk predictions. J Biomed Inform. 2015;54:283–293. doi: 10.1016/j.jbi.2014.12.016. [DOI] [PubMed] [Google Scholar]
- 69.Bellomo R, Kellum JA, Ronco C. Acute kidney injury. The Lancet. 2012;380:756–766. doi: 10.1016/S0140-6736(11)61454-2. [DOI] [PubMed] [Google Scholar]
- 70.Garla VN, Brandt C. Ontology-guided feature engineering for clinical text classification. J Biomed Inform. 2012;45:992–998. doi: 10.1016/j.jbi.2012.04.010. [DOI] [PMC free article] [PubMed] [Google Scholar]
- 71.Miller S, Guinness J, Zamanian A. Name tagging with word clusters and discriminative training. Proceedings of HLT. 2004:337–342. [Google Scholar]
- 72.Hofmann T. Proceedings of the Fifteenth Conference on Uncertainty in Artificial Intelligence. Morgan Kaufmann Publishers Inc.; 1999. Probabilistic Latent Semantic Analysis; pp. 289–296. [Google Scholar]
- 73.Friedlin J, et al. Comparing Methods for Identifying Pancreatic Cancer Patients Using Electronic Data Sources. AMIA Annu Symp Proc. 2010;2010:237–241. [PMC free article] [PubMed] [Google Scholar]
- 74.Peissig PL, et al. Importance of multi-modal approaches to effectively identify cataract cases from electronic health records. J Am Med Inform Assoc. 2012;19:225–234. doi: 10.1136/amiajnl-2011-000456. [DOI] [PMC free article] [PubMed] [Google Scholar]
- 75.Chen Y, et al. Applying active learning to high-throughput phenotyping algorithms for electronic health records data. J Am Med Inform Assoc. :e253–e259. doi: 10.1136/amiajnl-2013-001945. [DOI] [PMC free article] [PubMed] [Google Scholar]
- 76.Shivade C, Malewadkar P, Fosler-Lussier E, Lai AM. Comparison of UMLS Terminologies to Identify Risk of Heart Disease in Clinical Notes. J Biomed Inform. 2015;58:S103–S110. doi: 10.1016/j.jbi.2015.08.025. [DOI] [PMC free article] [PubMed] [Google Scholar]
- 77.CommonDataModel: Definition and DDLs for the OMOP Common Data Model (CDM) Observational Health Data Sciences and Informatics; 2018. [Google Scholar]
- 78.Fine AM, et al. Use of population health data to refine diagnostic decision-making for pertussis. J Am Med Inform Assoc JAMIA. 2010;17:85–90. doi: 10.1197/jamia.M3061. [DOI] [PMC free article] [PubMed] [Google Scholar]
- 79.Cronin RM, et al. National veterans health administration inpatient risk stratification models for hospital-acquired acute kidney injury. J Am Med Inform Assoc. 2015 doi: 10.1093/jamia/ocv051. ocv051. [DOI] [PMC free article] [PubMed] [Google Scholar]
- 80.Singh V, et al. Noradrenaline vs. terlipressin in the treatment of hepatorenal syndrome: A randomized study. J Hepatol. 2012;56:1293–1298. doi: 10.1016/j.jhep.2012.01.012. [DOI] [PubMed] [Google Scholar]
- 81.Alessandria C, et al. MELD score and clinical type predict prognosis in hepatorenal syndrome: Relevance to liver transplantation. Hepatology. 2005;41:1282–1289. doi: 10.1002/hep.20687. [DOI] [PubMed] [Google Scholar]
- 82.Medicare, C. for, Baltimore, M. S. 7500 S. B. & Usa, M. 2017-ICD-10-CM-and-GEMs. 2016 Available at: https://www.cms.gov/medicare/coding/icd10/2017-icd-10-cm-and-gems.html. (Accessed: 22nd March 2017)
- 83.Moskovitch R, Shahar Y. Medical Temporal-Knowledge Discovery via Temporal Abstraction. AMIA Annu Symp Proc. 2009;2009:452–456. [PMC free article] [PubMed] [Google Scholar]
- 84.Sacchi L, Capozzi D, Bellazzi R, Larizza C. JTSA: An open source framework for time series abstractions. Comput Methods Programs Biomed. 2015;121:175–188. doi: 10.1016/j.cmpb.2015.05.006. [DOI] [PubMed] [Google Scholar]
- 85.Post AR, et al. Temporal Abstraction-based Clinical Phenotyping with Eureka! AMIA Annu Symp Proc. 2013;2013:1160–1169. [PMC free article] [PubMed] [Google Scholar]
Associated Data
This section collects any data citations, data availability statements, or supplementary materials included in this article.