

Abstract
We describe a protocol for multiplexed proteomic analysis using neutron-encoded (NeuCode) stable isotope labeling of amino acids in cells (SILAC) or mice (SILAM)). This method currently enables simultaneous comparison of up to 9 treatment and control proteomes. Another important advantage over traditional SILAC/SILAM is that shorter labeling times are required. Exploiting the small mass differences that correspond to subtle differences in neutron binding energies of different isotopes, the amino acids used in NeuCode SILAC/SILAM differ in mass by just a few milliDaltons. Isotopologues of lysine are introduced to cells or mammals, via the culture medium or diet, respectively, to metabolically label the proteome. Labeling time is approximately two weeks for cultured cells and 3-4 weeks for mammals. The proteins are then extracted, relevant samples are combined, and these are enzymatically digested with lysyl endopeptidase (Lys-C). The resultant peptides are chromatographically separated and then mass analyzed. During MS data acquisition, high resolution MS1 spectra (≥240,000 resolving power @ m/z 400) reveal the embedded isotopic signatures, enabling relative quantification, while tandem mass spectra, collected at lower resolutions provide peptide identities. Both types of spectra are processed using NeuCode-enabled MaxQuant software. In total, the approximate completion time is 3-5 weeks.
Introduction
A major component of proteome research is to identify and accurately quantify proteins. These measurements allow one to ask many critical questions about biological systems, such as: what proteins exist, how are protein modifications perturbed across different backgrounds, and which proteins interact? Mass spectrometry-based proteomics is the preeminent approach for assessing the proteome, and scientists are continually making improvements in sample preparation, instrumentation, and software to enable rapid analysis of entire proteomes with very high throughput. Accurate and robust quantitation of proteins is an ever-present goal, and a variety of methods exist for this purpose; these methods are diverse and each offers unique qualities1–3. All these approaches come with trade-offs including cost, sample-preparation time, required instrument analysis time, dynamic range, and accuracy; for example, multiple-plexing with isotopic-labels often results in more sample-preparation time, but can reduce instrument analysis time. The optimal quantification strategy may depend on priorities and how the experiment was designed. Here we describe the protocol for NeuCode metabolic labeling which enables simple metabolic incorporation, multi-plexed analysis, and high quality quantitative metrics.
NeuCode labeling, first described in 20134, is a method for increasing the proteomic multi-plexing capabilities of metabolic labeling by reducing the mass window between isotopologues. Importantly, NeuCode isotopologues have the same nominal mass but differ in exact mass due to differences in neutron binding energy. These closely spaced isotopologues (~12-36 mDa) can be combined for 2-, 3-, and 4-plex experiments so that the quantitative isotopic signatures are invisible at mass resolving powers of < ~ 100,000. The result is that while peptides from up to four different sources are present, sample complexity, as viewed by the mass spectrometer, is not increased under normal data acquisition settings. This protocol describes a 3-plex NeuCode labeling experiment, highlighting specific MS method settings and use of new software for data analysis. Further multi-plexing, so far up to 9-plex, can be achieved by adding additional amino acid isotopologues at other nominal masses (+4, +8, +12 Da).
In general, stable isotope labeling strategies are particularly useful for relative protein quantitation between different experimental conditions. Often experimental designs are complex and require many sample processing steps. Use of stable isotope labels allows researchers to process multiple samples in parallel, reducing and even eliminating many sources of random and systematic errors.
There are two common multi-plexing strategies in shotgun proteomics: in vivo metabolic labeling (e.g., SILAC) and in vitro chemical labeling (e.g., isobaric tags5,6 or di-methyl labeling7,8). Chemical labeling relies on chemical reactions to add a variety of tags to peptides. This strategy requires that the tags be added to samples partway through sample processing. In contrast, metabolic labeling leverages in vivo incorporation of the label into proteins (i.e., during protein synthesis), typically by substituting naturally occurring amino acids with isotopically-labeled varieties9.
With metabolic labeling, samples containing different isotopologues can be mixed prior to down-stream sample processing, which greatly reduces the effect of variation introduced during sample preparation. Metabolic labeling is advantageous as it allows samples to be combined at the earliest sample processing steps while the multi-plexing it affords allows for a reduction in instrument analysis time per sample10.
The common metabolic labeling strategy using stable isotope-labeled amino acids in cell culture (SILAC) traditionally allows for 2- or 3-plex experimental designs9. The traditional application of this technique adds 4-12 Da to essential amino acids, which shifts peptide isotopic patterns by predictable mass units; therefore, each separate isotope label increases the number of distinct peptide mass-to-charge (m/z) peaks in the MS1 spectrum9,10. The mass spacing is typically 4 Daltons or greater to reduce the potential overlap between the intended labeled peptide and the naturally occurring isotopologues of the peptide (also known as the isotopic envelope).
Despite having advantages, there are both financial and analytical costs to metabolic labelling approaches. In particular, traditional SILAC increases MS1 spectral complexity, which ultimately reduces the number of proteins quantified and quality of protein quantification.
The increased spectral complexity results from there being multiple isotopic envelopes per peptide (i.e. for every isotopically labeled peptide there is an isotopic envelope due to naturally occurring isotopes) and limits the multi-plexing capability, typically to a maximum of 3-plex. This limitation is, in part, because peptides with the same amino acid sequence but differing isotope composition can both be selected for MS2 analysis. Thus, if the increased sample complexity exceeds the MS2 sampling rate of the instrument, then there will be a reduced number of unique peptide sequences selected for MS2 and reduced number of identified peptides.
Multiplexed analysis using isobaric tagging does not increase the complexity of MS1 spectra. The samples are labeled individually using tags which have the same intact mass, but upon fragmentation dissociate to release reporter ion signals that can be distinguished in the resulting MS/MS scan. At present, this approach affords parallel analysis of up to ten samples which are typically labeled after proteolytic digestion, but before further enrichments, separations or mass spectrometry analysis. Besides the later incorporation of label, as compared to metabolic labeling discussed above, isobaric tagging methods have another drawback – limited dynamic range. Specifically, because multiple precursors are typically co-isolated during MS/MS, the reporter ion signals that are used for quantitation can result from a mix of both the intended target peptide and others that are co-isolated. The result is that peptides having ten-fold regulation are often only measured to have a fraction of this ratio (~ 2-3 fold). While co-isolation is a general problem for proteomics, it is especially problematic for analysis of samples labelled with isobaric tags. In these assays, quantitation is based on the MS/MS and thus quantitation (and not just identification) are adversely affected by chimeric MS/MS spectra, because reporter signals are the same no matter which peptide they come from. Quantitation which is based on MS1 spectra (SILAC and di-methyl labeling) will not have this issue because there are unique mass signatures for peptides in both MS1 and MS2 spectra.
Here we detail an alternative to traditional SILAC and chemical labeling strategies that unites the best of both approaches – NeuCode SILAC4. Rather than use isotopes spaced 4 or 8 Da, as in traditional SILAC, NeuCode compresses this spacing down to such a small amount (12-36 mDa) that they are not visible under normal MS operating conditions. In this way having four different samples in the mixture does not lead to increased mass spectrum complexity or reduced sampling depth when compared to spectra obtained for just one sample. To achieve this very close spacing, NeuCode exploits the subtle differences in nuclear binding energy that exist between 13C (+1.0034),2H (+1.0062), and15N (+0.997) to generate a series of designer Lysine isotopologues that differ by as little as 12 mDa. Peptide ions labeled with these isotopologues can only be distinguished following analysis at high resolving power. By taking advantage of modern instrument capabilities, NeuCode offers a metabolic labeling strategy with more multi-plexing power than traditional SILAC and with greater dynamic range than isobaric tags11.
NeuCode SILAC labeling strategy
Central to the NeuCode labeling scheme is the concept of mass defect, which stems from the difference in energy released upon the formation and stabilization of the atomic nucleus. The nuclear binding energy, and mass defect, differs for every isotope of every element12. Nuclear binding energy differences for stable isotopes 13C,2H and15N make it possible to generate lysine isotopologues with the same nominal mass but unique exact masses. Lysine was chosen because it is an essential amino acid and has been used successfully in other SILAC experiments for MS-based proteomics9,13. Additionally, with the proteolytic enzyme Lys-C that cleaves at the C-terminal residue of Lysine14, every peptide generated will contain at least one isotopically-labeled lysine. In Figure 1a we plot the mass of all 21 theoretical lysine isotopologues that contain 8 stable isotopes from combinations of 13C,2H and15N (adapted from4). The unique mass values range from 154.1199 Da (13C-6,15N-2 lysine) to 154.1551 Da (D-8 lysine) with only a few mDa separating each isotopologue. When selecting lysine isotopologues for metabolic labeling, we optimize mass spacing between isotopologues based on mass spectrometer resolving power. Current orbitrap systems can operate at a resolving power of 480,000 or better15, which is sufficient for distinguishing peptides with isotopologues spaced 18 mDa apart (Figure 1b). Thus, 3-plex NeuCode with lysine isotopologues spaced 17.6 mDa apart is achievable on most orbitrap systems. For 3-plex NeuCode, we use isotopologues 13C-6,15N-2 lysine; 13C-3,2H-4,15N lysine; and2H-8 lysine (Figure 1a). These isotopologues will be referred to by the number of 13C,2H,15N: lysine 602 (K602), lysine 341 (K341), and lysine 080 (K080).
Figure 1. Lysine isotopologues and theoretical resolution calculations.
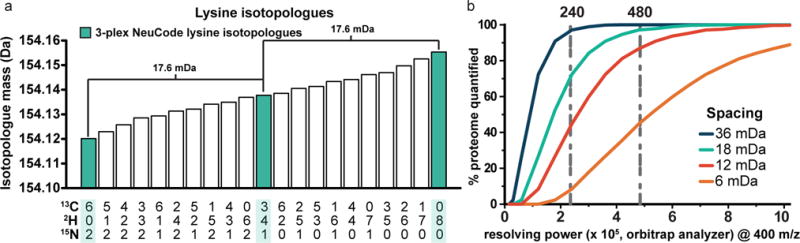
Using combinations of 13C,2H and 15N there are 21 theoretical lysine isotopologues with 8 additional neutrons (a). Highlighted in green are isotopologues used for 3-plex NeuCode. We calculated the percentage of resolved peptides (full width at 10% maximum peak height) with increasing resolving power for isotopologues spaced 6, 12, 18 or 36 mDa apart (b). Both panels are adapted from previous publication4.
NeuCode labeling relies on similar incorporation techniques as SILAC or SILAM, i.e., feeding cells or animals with formulated diet containing isotopically-labeled amino acids9,16,17. In this protocol we will describe a 3-plex experiment with isotopes of lysine: K602, K341, and K080 with digestion using Lys-C enzyme. Like SILAC or SILAM, samples containing unique isotopologues are mixed prior to sample preparation and analysis by high-resolution mass spectrometry.
To quantify peptides containing 3-plex NeuCode isotopologues, high-resolution (~480,000 resolving power) MS1 scans are required; this necessitates a high-resolving power instrument such as a QLT-OT (Orbitrap Elite) or Q-OT-qIT (Orbitrap Fusion) hybrid instrument. For optimizing instrument scans and computational processing time, we suggest two alternating MS1 scans; one at moderate resolving power and one at high resolving power (Figure 2). The initial MS1 full scan at 30,000 resolving power (@ 400 m/z) will yield an average (non-resolved) peak, and the 480,000+ resolution MS1 scan will reveal the 3-plex NeuCode peaks. The fully resolved spectra are used for quantification, while the moderate-resolution spectra are used for selecting m/z values for ion trap MS2 analysis, which will later be used for peptide identification. The MS/MS analyses are triggered from the faster, lower-resolution MS1 scan, and in fact, the system operates such that MS/MS scans are collected during the acquisition of the high resolution MS1. If only 240,000 resolving power is needed (i.e., for 36 mDa spaced isotopologues), the strategy can be adapted such that only one MS1 at 240,000 resolving power is collected as described in Supplementary Tables 1 and 2.
Figure 2. Scan sequences for NeuCode 3-plex analysis.
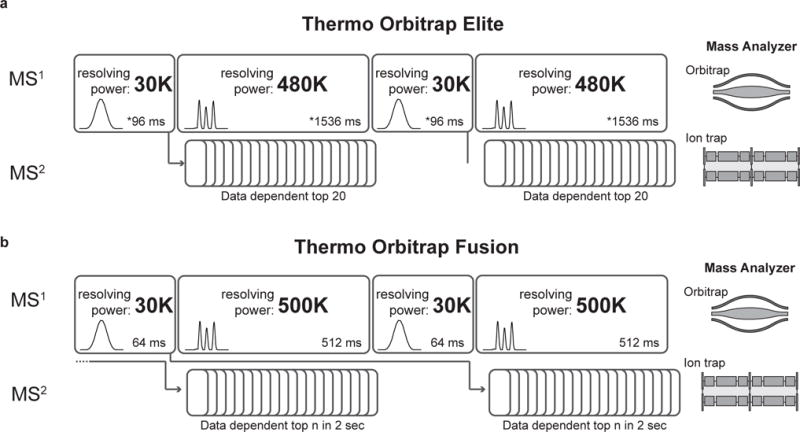
For optimizing quantitation of NeuCode samples, we recommend two MS1 scans collected in the Orbitrap; one at moderate resolving power (30K) and one at high resolving power (480K+). Depending on the instrument, Thermo Orbitrap Elite (a) or Thermo Orbitrap Fusion (b), MS2 scans will trigger off of the previous 30K MS1 scan (a) or the n-1 30K MS1 scan (b) and be collected in the ion trap. *estimated transient times from Michalski, A. et al.15.
Analysis of NeuCode data involves identifying peptides and quantifying their abundances. Identification can be performed with most search algorithms by setting up a fixed modification of +8.0332 Da on Lysine. Quantification of NeuCode labeled peptides, however, requires software that can detect the small mass differences in peptide features (~ 5-50 ppm). The mass differences between NeuCode peptides can overlap with the tolerance often used for quantitation (± 10 ppm). To help with this unique challenge of quantifying NeuCode spectra, we developed a NeuCode quantitation capacity within the MaxQuant protein software suite. The NeuCode MaxQuant tool simplifies NeuCode identification and quantitation by requiring the user to input only a few parameters, described in the protocol below. The results resemble traditional MaxQuant output with the channel intensity values found in the evidence, peptides, protein groups and posttranslational modification sites files18.
NeuCode SILAC enables higher multiplexing metabolic labeling but has some caveats that should be considered. Similar to traditional SILAC, this approach provides relative quantitation, not absolute quantitation, of the proteome. Also, like traditional SILAC, labels must be introduced metabolically; hence, clinical specimens of human tissue cannot be analyzed directly using this approach. Digestions with Lys-C typically result in fewer peptide identifications than digestions with Trypsin, because the peptides resulting from the digestion are longer. That said, our data suggests (unpublished work) we obtain more quantifiable peptides by using Lys-C, since all peptides will have at least one label. Finally, NeuCode requires instrumentation capable of high resolving power, at present only FT-MS systems, the cost of these instruments could be a limitation for some researchers.
Applications of NeuCode SILAC
Since 2013, NeuCode SILAC has been applied to a number of different experimental models including yeast4,11, adherent cell lines19, nematodes20, and mice21. In this protocol we highlight the use of NeuCode for adherent cell lines and mouse models; however, application of the method to other model systems is straight forward and simply requires the dietary replacement of normal lysine with NeuCode lysine isotopologues.
So far we have discussed NeuCode lysine isotopologues containing 8 additional neutrons (i.e., M+8). NeuCode isotopologues with alternate nominal masses (e.g., +4, +12 Da) exist and may be employed (Figure 3). With these additional isotopologues one can perform up to 7-plex NeuCode (Figure 4) which would have three isotopic clusters (three isotopic envelopes) per peptide, spaced 4 Da apart. In theory, additional custom lysine isotopologues would enable even greater NeuCode multi-plexing. When deciding on which multi-plexing strategy to use, there are two main considerations: 1) the resolving power needed for the spacing of the isotopologues, and 2) the potential loss of MS2 sampling depth with increasing number of isotopic clusters. For all the multiplexing options listed in Figure 4, the minimal spacing between isotopologues listed is compatible with 480,000 resolving power. The only exception is that 2-plex NeuCode (36 mDa spacing) can be performed with 240,000 resolving power and the instrument set-up as listed in Supplementary Tables 1 and 2. For multi-plexing options listed in Figure 4 that have more than one isotopic cluster (i.e., 4- through 7-plex), one should anticipate some reduction in sampling depth due to the presence of multiple isotopic clusters, just as in traditional SILAC. In turn, however, additional multiplexing within each isotopic cluster is achieved. With new instrumentation like the Orbitrap Fusion, the MS2 sampling rates are higher22, reducing the effect multiple isotopic clusters have on sampling depth. Thus, the trade-off between sampling depth and higher multi-plexing will be dependent upon the instrument used and the mode in which it is operated.
Figure 3. Commercially available lysine isotopologues.
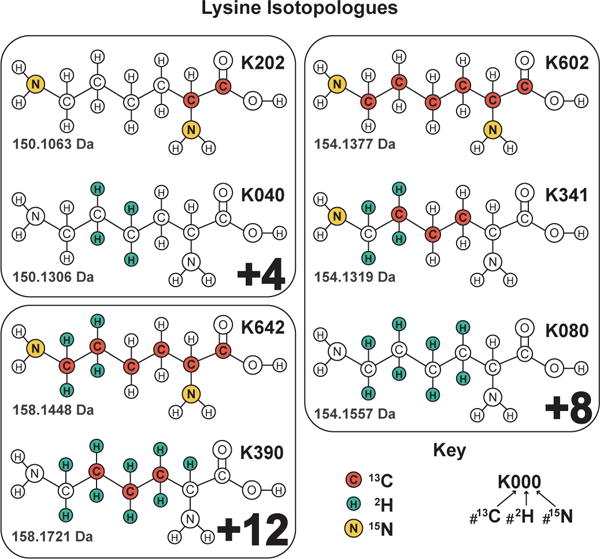
For multi-plexing NeuCode, there are 7 available lysine isotopologues: K202 and K040 with 4 additional neutrons, K602, K341, and K080 with 8 additional neutrons, and K642 and K390 with 12 additional neutrons.
Figure 4. Multi-plexing options with NeuCode labels.
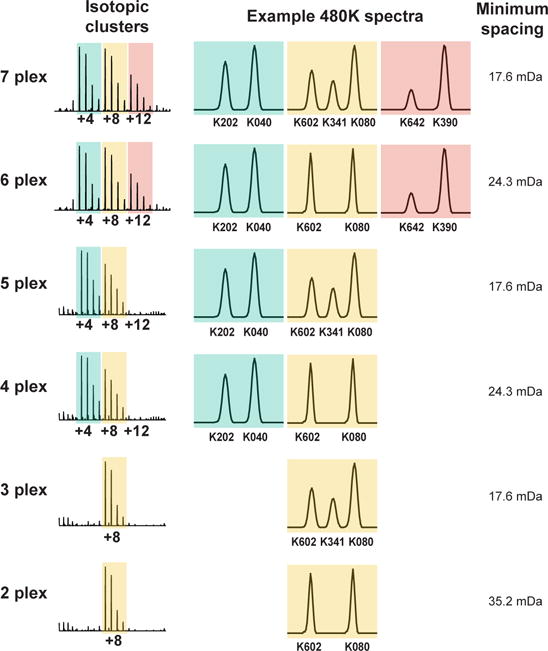
Multi-plexing options with the commercially available lysine isotopologues range from 2-plex in one isotopic cluster to 7-plex with three isotopic clusters.
An added benefit of NeuCode metabolic labeling derives from the comparison of labeled vs. labeled spectral features unlike traditional SILAC which typically compares labeled-to-unlabeled features. While traditional SILAC could compare labeled vs. labeled - and comparing +4 to +8 has been done in plant studies where 100% labeling is not possible23 - it is rare to find an application of traditional SILAC that is not comparing the labeled to unlabeled form. NeuCode has labeled-to-labeled comparison inherent to the experimental design. The advantage of comparing labeled-to-labeled is that metabolic incorporation of the isotopologue does not need to be 100% (assuming equal efficiency of label incorporation across all isotopologues). Thus, metabolic labeling in primary cells becomes feasible (since multiple generations of labeling are not required), and metabolic labeling in animals becomes faster and more economical. For example, NeuCode labeling of mice can be done with ~ 2-4 weeks of feeding21 compared to the traditional stable isotope labeled amino acids in mice (SILAM), which requires several generations of isotopologue feeding24. Note a caveat of incomplete labeling is that the MS1 spectral complexity is increased due to the presence of unlabeled peptides.
For researchers considering incomplete incorporation of NeuCode isotopologues, e.g. for animal models or primary cells, it is important to verify that the isotopologue incorporation rates and the time for incorporation are the same. For animal models, incorporation rates can be verified on a small sample of the population before proceeding to the full experimental design. Because incorporation rates differ by tissue, it is important to confirm sufficient incorporation time for the tissue of interest. We found that incorporation of isotopologue into liver is faster than into brain or muscle and that 2 weeks of isotopologue incorporation would be sufficient for studying the liver while 4 weeks of incorporation is needed for studying brain or muscle21. Experimental models where growth or protein synthesis is severely affected are likely not good candidates for NeuCode labeling approaches for quantitation of relative protein abundance.
NeuCode can also be used for other proteomics strategies including data-independent acquisition19, targeted proteomics25, and even top-down approaches26,27. In this protocol we will focus only on data-dependent shotgun proteomic applications and refer readers to the documents cited above for alternative proteomics applications.
Experimental design
The experimental design will depend on the number of conditions and replicates needed. In this protocol we provide the basic workflow and instructions for a single 3-plex NeuCode experiment (Figure 5). For more replicates or experimental conditions, one can a) add additional 3-plex NeuCode replicates or b) increase multi-plexing with additional lysine isotopologues (Figure 4). The choice to increase multi-plexing will likely depend on the complexity of the experimental design and the extent of downstream processing (i.e., PTM enrichment). Higher multi-plexing (>4) reduces the number of vials for downstream processing steps and MS analysis time but can also result in reduced sampling depth due to the presence of multiple isotopic clusters.
Figure 5. Suggested workflow for NeuCode metabolic labeling.
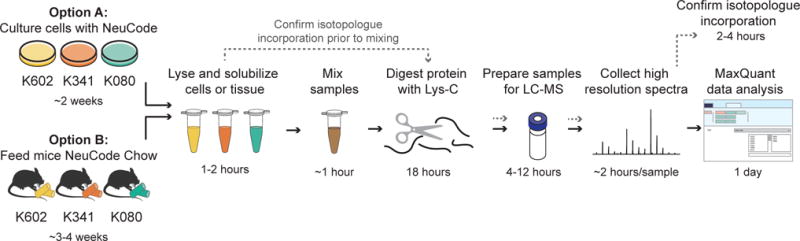
First introduce lysine isotopologues to cells (option A) or mice (option B). Next lyse cells or tissue and solubilize protein. To check for isotopologue incorporation do not mix samples but proceed with mass spectrometry analysis; for NeuCode analysis mix samples at equal ratios of protein. Digest samples with Lys-C enzyme, and then prepare samples for LC-MS analysis. Acquire high-resolution mass spectra, and analyze data in MaxQuant.
After choosing the multi-plexing scheme, the first step in the protocol is to introduce NeuCode isotopologues to cells or mice via culture media or diet; we describe both cell and mouse options in this protocol (option A and B, respectively). With the cell culture protocol, we first make media containing one of each isotopologue (see reagent setup). For the mouse protocol, mouse chow containing one of each isotopologue is available for purchase from Cambridge Isotope Laboratories; animals can be introduced to isotopologue chow at any age after weaning. During the incorporation time (~ 2 weeks for cells and ~2-4 weeks for mice), NeuCode media or chow should replace the usual growth media or chow. With any new model system, we recommend confirming growth rates and viability on the customized NeuCode diets.
For best results, we aim for near-complete incorporation of the isotopologue into the proteome; in cell culture systems near-compete incorporation can be achieved in approximately 5-6 doublings. In some cases, i.e., in primary cells or mouse models, it is not feasible to completely turnover the proteome; in these cases, ~ 50% incorporation is sufficient. Animals can be feed chow for longer than the suggested time of ~4 weeks if higher percent labeling is desired. To check isotopologue incorporation, samples containing unique isotopologues should be processed and analyzed separately on an LC-MS system with a standard single-shot bottom-up proteomics work flow28. We then quantify the relative M+8 to M+0 for each peptide, this is similar to quantification for a traditional SILAC experiment29. The average heavy-to-light peptide ratio should be similar for all isotopologues and confirmed prior to mixing NeuCode samples together. For animal experiments, a small cohort can be used to confirm similar labeling efficiency of isotopologues within specific mouse models.
Once isotopologue incorporation is confirmed, samples containing different isotopologues can be mixed at any stage in the sample processing prior to LC-MS analysis. We recommend mixing NeuCode samples as soon as possible to guard against variation introduced during the processing steps. For sample processing, proteins are extracted from the cells or tissue and then digested into peptides using Lys-C. Digesting with Lys-C is critical for testing isotopologue incorporation into the proteome because Lys-C digestion ensures at least one lysine residue per peptide. When performing the main study using mixtures of experimental samples, it is possible to use alternative enzymes for digestion, i.e., trypsin, e.g. to get peptides that would compare directly with those from previous experiments. Note while complex peptide mixtures resulting from trypsin digestion often result in more overall identifications following LC-MS/MS analysis, only peptides having at least one lysine can be quantified using this method.
Proper LC-MS/MS set-up is critical for success with NeuCode (Equipment Setup and Tables 1 and 2). The chromatography setup can be adapted as needed to optimize the number of quantified peptides. Here we use a 25 cm reversed-phase column made in-house and use flow rates of approximately 0.350 μL/min28. Commercially available nano-flow LC columns and optimized flow settings would be an alternative option for chromatography. The MS setup will also depend on the instrument available, but high resolving power is required for quantifying NeuCode labeled peptides. To acquire high resolution spectra on the Orbitrap Elite systems, the Thermo Developer’s kit must be installed and is available through Thermo Fisher Scientific. As shown in Figure 2, we define two MS1 scan events; the first with moderate resolution (30,000 resolving power) and the second with high resolution (480,000 resolving power), and then schedule MS2 in a data-dependent fashion off of the previous moderate resolving power MS1 scan. Additionally, the automatic gain control (AGC) target should be set to 1e6, or lower. We recommend not exceeding these AGC settings as large ion populations can induce a phenomenon known as peak coalescence30,31. Even with the recommended AGC settings, a highly abundant peptide may have a peak that coalesces with the peak(s) immediately adjacent to it. In these instances the MaxQuant algorithm excludes peaks that show coalescence (i.e. if the mass differences deviate from expected) so that high quality quantitative data is still obtained.
Table 1.
Orbitrap Elite method settings with 480,000 MS1 resolving power.
| Scan Event | Method Parameter | Value |
|---|---|---|
| Scan Event 1 | Analyzer | FTMS |
| Mass Range | Normal | |
| Resolution | 30000 | |
| Scan Type | Full | |
| Polarity | Positive | |
| Data Type | Profile | |
| Scan Range | 300-1250 m/z | |
| Scan Event 2 | Analyzer | FTMS |
| Mass Range | Normal | |
| Resolution | 480,000 | |
| Scan Type | Full | |
| Polarity | Positive | |
| Data Type | Profile | |
| Scan Range | 299-1250 m/z | |
| Scan Event 3-22 | Analyzer | Ion Trap |
| Mass Range | Normal | |
| Scan Rate | Rapid | |
| Data Type | Centroid | |
| Dependent Scan | Yes | |
| Mass determined from | Scan Event 1 | |
| Activation Type | CID | |
| Default charge state | 2 | |
| Minimum Signal Required | 500 | |
| Isolation width m/z | 2 | |
| Normalized collision energy | 35 | |
| Activation Q | 0.25 | |
| Activation time (ms) | 5 | |
| Dynamic Exclusion | Enabled | |
| Repeat count | 1 | |
| Repeat duration (s) | 45 | |
| Exclusion list size | 500 | |
| Exclusion duration | 45 | |
| Exclusion mass width low | 25 ppm | |
| Exclusion mass width high | 10 ppm |
Table 2.
Orbitrap Fusion and Fusion Lumos method settings with 500,000 MS1 resolving power.
| Experiment | Method Parameter | Value |
|---|---|---|
| Experiment 1 | Cycle time (sec) | 2 |
| MS OT | ||
| Detector Type | Orbitrap | |
| Orbitrap Resolution | 30000 | |
| Mass Range | Normal | |
| Use Quadrupole Isolation | True | |
| Scan Range (m/z) | 350-1100 | |
| RF Lens (%) | 30 | |
| AGC Target | 1.0e6 | |
| Maximum Injection Time (ms) | 100 | |
| Microscans | 1 | |
| Data Type | Profile | |
| Polarity | Positive | |
| Source Fragmentation | Disabled | |
| Use EASY-IC | False | |
| Monoisotopic Precursor Selection (MIPS) Filter | ||
| Monoisotopic Peak Determination | Peptide | |
| Relax restrictions when too few precursors are found | True | |
| Exclude undetermined Charge States | True | |
| Charge State Filter | ||
| Include charge state(s) | 2-6 | |
| Include undetermined charge states | False | |
| Include charge states 25 and higher | False | |
| Dynamic Exclusion Filter | ||
| Exclude after n times | 1 | |
| Exclusion duration (sec) | 5 | |
| Mass Tolerance | m/z | |
| Low | 0.55 | |
| High | 1.55 | |
| Exclude Isotopes | False | |
| Perform dependent scan on single charge state per precursor only | False | |
| Decisions | ||
| Data dependent mode | TopSpeed | |
| Precursor Priority | Most Intense | |
| Number of Scan Event Types | 1 | |
| Scan Event Type 1 | ddMS2 IT HCD | |
| MSn Level | 2 | |
| Isolation Mode | Quadrupole | |
| Use isolation m/z offset | False | |
| Activation Type | HCD | |
| HCD Collision Energy (%) | 30 | |
| Stepped Collision Energy | False | |
| Detector Type | Ion Trap | |
| Scan Range Mode | Define m/z range | |
| Ion Trap Scan Rate | Turbo | |
| Scan Range (m/z) | 200-1200 | |
| AGC Target | 1.0e4 | |
| Injection ions for all available parallelizable time | False | |
| Maximum Injection Time (ms) | 15 | |
| Microscans | 1 | |
| Data Type | Centroid | |
| Experiment 2 | Cycle time (sec) | 3 |
| MS OT | ||
| Detector Type | Orbitrap | |
| Orbitrap Resolution | 500000 | |
| Mass Range | Normal | |
| Use Quadrupole Isolation | True | |
| Scan Range (m/z) | 350-1100 | |
| RT Lens (%) | 30 | |
| AGC Target | 1.0e6 | |
| Maximum Injection Time (ms) | 100 | |
| Microscans | 1 | |
| Data Type | Profile | |
| Polarity | Positive | |
| Source Fragmentation | Disabled | |
| Use EASY-IC | False |
Resulting NeuCode spectra are processed using NeuCode-enabled MaxQuant software (version 1.5.7.0 or later), which is freely available for download at http://www.biochem.mpg.de/5111795/maxquant. The MaxQuant software provides a sophisticated processing pipeline for peak detection, database searching, peptide and protein quantification, and a variety of quality control filtering18. Since NeuCode quantitation relies on distinguishing small mass differences, special care is needed to accurately quantify peptides. The MaxQuant tool described here allows the user to designate the multi-plexing scheme and channels that should be quantified (i.e., K602, K341, K080), and MaxQuant can be adapted to any of the multi-plexing options listed in Figure 4.
Materials
Reagents
Metabolic labeling of cells (Step 1A):
-
-
Cell line of interest; HepG2 (American Type Culture Collection, cat. no. HB-8065). We have also used C2C12 (American Type Culture Collection, cat. no. CRL-1772) myoblasts and differentiated myotubes19, and in theory any cell that is auxotroph for lysine would be suitable for NeuCode labeling experiments.
<CAUTION> The cell lines used in your research should be regularly checked to ensure they are authentic and are not infected with mycoplasma.
-
-
SILAC DMEM Flex Media, no glucose, no phenol red (Thermo Fisher Scientific, cat. no. A2493901)
-
-
L-arginine (Sigma-Aldrich, cat. no. A5006)
-
-
NeuCode Lysine Isotopologues (K602, K341, K080, Thermo Fisher Scientific)
-
-
Dialyzed Fetal Bovine Serum for SILAC (Thermo Fisher Scientific, cat. no. 88212)
-
-
D-Glucose for cell culture (Sigma-Aldrich, cat. no. G7021)
-
-
Sodium Pyruvate for cell culture (100 mM, Thermo Fisher Scientific, cat. no. 11360070)
-
-
L-Glutamine for cell culture (200 mM, Thermo Fisher Scientific, cat. no. 11360070)
-
-
Penicillin-Streptomycin (10,000 U/mL, Thermo Fisher Scientific, cat. no. 15140163)
-
-
Phosphate-Buffered Saline (PBS), pH 7.4 (Thermo Fisher Scientific, cat. no. 10010-023)
-
-
Trypsin-EDTA (0.05 (wt/vol) %), phenol red (Thermo Fisher Scientific, cat. no. 25300054)
Metabolic labeling of animals (Step 1B):
-
-
NeuCode Mouse Chow (K602, K341, K080; Cambridge Isotope Laboratories)
-
-
Mice; 10-week old male C57BL/6J (Jackson Laboratory, stock no. 000664)
CAUTION: All procedures involving animals must conform to governmental and institutional animal care guidelines. For the mouse data presented in this document, the Genentech Institutional Animal Care and Use Committee approved the protocol21.
Sample work-up and mass spectrometry:
-
-
2-Chloroacetamide (CAA; Sigma-Aldrich, cat. no. C0267)
-
-
Acetonitrile, HPLC grade (ACN; Fisher Scientific, cat. no. A955-4)
-
-
Bicinchoninic acid (BCA) protein assay kit (Pierce, cat. no. 23227)
-
-
Formic acid (FA; Thermo Scientific, cat. no. 28905)
-
-
Lysyl endopeptidase (Lys-C, Wako Pure Chemical Industries, cat. no. 129-02541)
-
-
Liquid nitrogen
-
-
Methanol, HPLC grade (Fisher Scientific, cat. no. A454SK-4)
-
-
Quantitative Colorimetric Peptide Assay (Pierce, cat. no. 23275)
-
-
Sep-Pak C18 cartridge (50 mg sorbent; Waters, cat. no. WAT054955)
-
-
Sodium chloride (NaCl; Sigma-Aldrich, cat. no. S3014)
-
-
Trifluoroacetic acid (TFA; Thermo Scientific, cat. no. 28904)
-
-
Tris(2-carboxyethyl)phosphine hydrochloride (TCEP, Sigma-Aldrich, cat. no. C4706)
-
-
Tris-base (EP154-1, cat. no. EP154-1)
-
-
Urea (Sigma-Aldrich, cat. no. U5378)
-
-
Water, HPLC grade (Sigma-Aldrich, cat. no. 270733-4 L)
-
-
Water, nanopure
Equipment
Metabolic labeling of cells (Step 1A):
-
-
CO2 incubator maintained at 37°C and 5% CO2 for culturing cells
-
-
Serological pipettes for cell culture
-
-
Culture flasks
-
-
Cell scraper
Metabolic labeling of animals (Step 1B):
-
-
Appropriate mouse housing facilities
-
-
Anesthetizing agent (terminal tissue collection).
-
-
Dissection tools.
CAUTION: All procedures involving animals must conform to governmental and institutional animal care guidelines.
Sample work-up and mass spectrometry:
-
-
1.5 ml microcentrifuge tubes (Sarstedt, cat. no. 72.692.005)
-
-
2 ml microcentrifuge tubes (Sarstedt, cat. no. 72.694.005)
-
-
15 mL conical tubes
-
-
Bench-top rocker
-
-
Bench-top microcentrifuge
-
-
C18 reverse phase column for HPLC system (prepared in house12 or purchased through commerical supplier, i.e. New Objective, custom 30-cm capillary columns packed with 1.7 μm bridged ethylene hybrid material)
-
-
HPLC system capable of nl/min flow rates (nanoAcquity UPLC; Waters)
-
-
Hybrid Orbitrap-Ion Trap mass spectrometer (Thermo Fisher Scientific)
-
-
MaxQuant version 1.5.4.0 or greater (http://www.biochem.mpg.de/5111795/maxquant)
-
-
Micro pipette
-
-
pH paper strips, pH range 0-14 (EMD Millipore, cat. no. 1.09535.0001)
-
-
Probe sonnicator
-
-
Spectrophotometer
-
-
SpeedVac (Savant Refrigerated Vapor Trap; Thermo Scientific, cat. no. RVT5105-115)
-
-
Vortex (Vortex Genie 2; Scientific Industries, cat. no. SI-0236)
Reagent Setup
Metabolic labeling of cells (Step 1A): NeuCode media
First, prepare concentrated stocks of the NeuCode lysine isotopologues (100 mM stocks in PBS); store isotopologue stocks at 4°C for 2 months, or −20°C for up to 1 year. Using DMEM flex media as a base, add D-glucose (1 g/L final), L-arginine (42 mg/L final), pyruvate (1 mM final), glutamine (2 mM final), and dialyzed serum (10% vol/vol final), and Penicillin-Streptomycin (10 U/mL final). Split the supplemented base media into 3 equal volumes and add one NeuCode lysine isotopologue (0.798 mM final) to each. Filter the media with 0.22-μm filter flasks and store at 4°C for up to 2 months.
CRITICAL: Insure the same molar concentration of isotopologues in each media. This is especially important when preparing the experimental media which may contain additional components (i.e. supplements).
Metabolic labeling of animals (Step 1B): NeuCode mouse chow
NeuCode mouse chow can be purchased from Cambridge Isotope Laboratories or made in-house by using customized lysine-free diet (available from producers of customized mouse chow) combined with 1% (wt/wt) K602, K341, or K0807. In our lab this is stored under xxx conditions, and is stable for at least xxx months.
Urea buffer
Prepare buffer containing 8 M urea, 75 mM NaCl, 50 mM Tris-Base (pH 8), 40 mM CAA and 10 mM TCEP in nanopure H2O. This buffer should be freshly prepared.
CRITICAL: Urea buffer should be prepared fresh. 10X stocks of 2-Chloroacetamide (CAA, 400 mM) and Tris(2-carboxyethyl)phosphine hydrochloride (TCEP, 100 mM) can be prepared in nanopure H2O and stored up to 1 year at −80°C.
Sep-Pak solvents
Prepare solvents according to Sep-Pak instructions. Wash buffer: 0.02% (vol/vol) formic acid in nanopure H2O; Elution buffer A: 40% (vol/vol) acetonitrile and 0.1% (vol/vol) TFA in nanopure H2O; Elution buffer B: 80% (vol/vol) acetonitrile and 0.1% (vol/vol) TFA in nanopure H2O. Sep-Pak buffers can be stored at room temperature (~22°C) for up to 2 months.
LC-MS/MS solvents
Prepare Mobile Phase A; 0.2% (vol/vol) formic acid in HPLC-grade water. Prepare Mobile Phase B; 0.2% formic acid (vol/vol) in 70% (vol/vol) HPLC-grade acetonitrile. Mobile phase A and B can be stored at room temperature for up to 2 months.
Equipment Setup
HPLC system
Set up the following 90-min chromatography gradient using a C18 reversed-phase column at a constant flow rate of 0.350 μl/min:
|
| |
| Time interval (min) | Gradient: % B (vol/vol) |
|
| |
| 0 | 0 |
| 5 | 8 |
| 75 | 55 |
| 76 | 100 |
| 79 | 100 |
| 80 | 0 |
| 90 | 0 |
|
| |
Mass spectrometer settings
Depending on the instrument, set up the instrument with the settings described in Table 1 (Orbitrap Elite) or Table 2 (Orbitrap Fusion).
Procedure
Metabolic incorporation of isotopologues
-
1|
The NeuCode analysis can be done using samples from cells or mice. For metabolic labeling of cells, follow the steps in option A; for labeling of mice, follow the steps in option B.
Option A: Label cells with lysine isotopologues <TIMING> ~2 weeks depending on cell growth
-
Split cells into 3 new culture flasks at appropriate split-ratios. Grow cells in NeuCode media; each flask should contain a unique lysine isotopologue.
CRITICAL STEP: With new cell lines it is important to confirm cell viability with isotopologue-containing media.
Refresh media every 2-3 days with appropriate lysine isotopologue media.
-
When cells reach ~80% confluency, passage cells into new culture flasks. To passage: remove media and rinse cells with PBS (pH 7.4). Add Trypsin EDTA (0.05% wt/vol) to detach cells. Split cells at recommended split ratio and centrifuge cells at 300 × g for 2 min to pellet cells. Remove trypsin-containing media and resuspend cells in appropriate lysine isotopologue media and transfer to new culture flask.
CRITICAL STEP: Remove trypsin-containing media prior to continued culturing to prevent introduction of unlabeled lysine into the culture medium.
-
After 3 passages (or 5-6 doublings), determine the labeling efficiency. To confirm labeling efficiency, perform steps 2-9 and 11-18, skipping sample mixing. Raw files can be processed like SILAC samples to check for heavy (M+8) to light (M+0) ratio.
CRITICAL STEP: Confirmation of labeling efficiency is necessary when introducing NeuCode isotopologues to a new cell model. Generally, this confirmation of labeling efficiency can be completed once and be skipped for future experiments dealing with the same cell line and growth conditions.
?Troubleshooting
If necessary for experimental design, expand isotopologue-enriched cells by using larger culture flasks.
Treat cells with control and experimental media (i.e. perform Step 1ii with desired experimental conditions). Make sure to that the experimental media contains the appropriate lysine isotopologue at the correct concentration.
Freeze experimental cells. Depending on experimental design and cell type, cells can be frozen as a cell pellet (after detaching from cell plate) or flash frozen on cell plate. In both cases, remove media from cells, wash cells with PBS and freeze with liquid nitrogen. Though only small amounts of material (~ 100 μg protein) are needed for the following proteomics workflow, we recommend beginning with > 1 mg of cellular protein and optimizing further, as needed.
Pause point: Frozen cells can be kept at −80°C for several months.
Option B: Label mice with lysine isotopologues <TIMING> 3-4 weeks
Feed mice with isotopologue-containing mouse chow 20-30 days prior to experimental collection. With a small cohort, confirm that each isotopologue has similar incorporation into the tissue of interest.
At day of collection, follow institution-approved protocols for collecting tissue.
Freeze tissue immediately after collection by snap freezing in liquid nitrogen. Pause point: Frozen tissue can be kept at −80°C for several months.
Lyse and solubilize cells or tissue <TIMING> 1-2 hours
-
2|
Add 1 mL of 80% methanol (vol/vol) prepared in nanopure H2O to frozen cell pellet, cell plate, or 30 mg of frozen tissue. If cells are still attached to the plate, add methanol and use a cell scraper to detach cells, then pipet detached cells and solvent into a microcentrifuge tube for further processing.
-
3|
Vortex and probe sonicate sample for 10 seconds to lyse cells or tissue.
-
4|
Centrifuge samples at 14,000 × g for 5 min at 4°C to pellet protein; discard supernatant.
-
5|
Dissolve pellets in appropriate amount of Urea buffer (see reagent setup) to generate solutions with ~0.5 - 5 mg/mL protein content and vortex or probe sonicate to ensure complete resuspension of protein.
-
6|
Vortex samples for 10 min at room temperature (~ 22°C)
-
7|
Dilute the lysate with 50 mM Tris (pH 8) so that the final urea concentration is 4 M.
-
8|
Perform a BCA assay to determine protein concentration of each sample. Using a small portion of each lysate, follow the standard protocol for performing a BCA assay.
Confirming isotopologues incorporation <TIMING> 1.5 days
-
9|
To confirm isotopologue incorporation, skip step 10| and perform all the steps up to and including the LC-MS analysis (i.e. Steps 11-18) with un-mixed samples. Confirming isotopologue incorporation would require only enough sample for a typical bottom-up single-shot MS-analysis (~100 μg protein). After LC-MS analysis (step 18|); process samples with MaxQuant using SILAC quantitation and confirm that ratio of M+8 to M+0 is equivalent for each isotopologue29.
?Troubleshooting
Sample mixing <TIMING> 1 h
-
10|
Mix equal amounts of protein from one of each of the isotopologue-containing samples. For example, if a final amount of 300 μg of protein is desired, mix 100 μg from the K602 sample, 100 μg from the K341 sample, and 100 μg from the K080 sample). Remaining individual lysates can be stored at −80°C for several months.
Digest sample <TIMING> 15-18 h
-
11|
Add Lys-C at an enzyme:protein ratio of 1:100 and incubate with gentle rocking at room temperature for 15-18 hours.
Prepare samples for LC-MS analysis <TIMING> 4-12 hours depending on sample drying
-
12|
Add a minimum amount of 10% (vol/vol) TFA to reduce the sample to a pH < 2. Confirm approximate pH by pipetting a drop of the sample onto pH paper; adjust the pH of the peptide solution with 10% (vol/vol) TFA until the solution is < pH 2.
-
13|
Centrifuge the sample at room temperature for 5 min at 10,000 × g to pellet any insoluble material.
-
14|
Desalt using a Sep-Pak cartridge size that is ~20 times greater than the protein sample. Follow Sep-Pak instructions, elute peptide into new 2 mL microcentrifuge tube with 1 mL of elution buffer A, followed by 1 mL of elution buffer B.
-
15|
Dry the sample in a SpeedVac.
PAUSE POINT: Dried samples can be stored at −80°C for several months.
-
16|
Resuspend dried samples in 0.2% (vol/vol) formic acid at approximately 1 μg/μL concentration.
-
17|
Determine peptide concentration of sample(s) using Pierce peptide colorimetric assay.
Analyze samples by LC-MS/MS <TIMING> approximately 2 hours per sample
-
18|
Inject 2 μg of peptides onto nano-LC column for LC-MS/MS analysis; refer to the experimental setup for LC-MS/MS settings.
?Troubleshooting
Data Analysis <TIMING> 1 day
-
19|
Starting with the ‘Raw files’ tab, load raw files into MaxQuant. Set experiment(s) or designate ‘No fractions’.
-
20|
In ‘Group-specific parameters’ tab, change the ‘Type’ to NeuCode. Select the appropriate isotopologues from the left column and move these to the right column; alternatively, click the multi-plexing button that is appropriate. If analyzing partially labeled samples, include ‘K000’ in the isotopologue column for assessment of the unlabeled component. Next change the digestion enzyme to ‘LysC/P’.
-
21|
In the ‘Global parameters’ tab, designate the file location for the appropriate fasta database file.
-
22|
Choose the number of threads for parallel computing, then click ‘Start’.
-
23|
Once the analysis is done, proceed with further experimental data analysis and data interpretation using the quantified proteins or peptides. The quantification for each NeuCode channel can be found within the following files: combined/txt/evidence.txt, combined/txt/peptides.txt, combined/txt/proteinGroups.txt, and combined/txt/modificationSpecificPeptides.txt. Typically, if the proteome is of major interest, the combined/tex/proteinGroups.txt file will be the most useful. The other files contain supporting information about specific peptides and MS/MS evidence for the quantification.
?Troubleshooting
Timing
Step 1| Option A: Label cells with lysine isotopologues: ~2 weeks depending on cell growth
Step 1| Option B: Label mice with lysine isotopologues: 3-4 weeks
Steps 2| - 8| Lyse and solubilize cells or tissue: 1-2 hours
Steps 9|, 11| - 18| Confirming isotopologues incorporation: 1.5 days
Step 10| Mix samples: 1 hour
Step 11| Digest protein with Lys-C: 15-18 hours
Steps 12| - 17| Prepare samples for LC-MS analysis: 4-12 hours depending on sample drying
Step 18| LC-MS analysis: approximately 2 hours per sample
Steps 19| - 23| Data analysis: 1 day
Troubleshooting
Troubleshooting guidelines can be found in Table 3.
Table 3.
Troubleshooting
| Step | Problem | Possible reason | Solution |
|---|---|---|---|
| 9| | Differential incorporation of isotopologues into cells | Cell growth is effected by media, or media formulation is incorrect | Confirm cell viability and growth in each media and reformulate media if necessary. |
| A mix of cell lines with different growth rates are being used | Continue to culture the cells until each cell line achieves near complete incorporation of isotopologue, thus mitigating the effect of different rates of incorporation | ||
| Differential incorporation of isotopologues into mice | Feeding behavior and growth differ between animal models (i.e. wild type and knockout) | One option is to mix isotopologue-containing samples such that average isotopologue intensity is the same between samples. This requires running a test equal-ratio mix of the samples and then normalizing based on the observed average isotopologue intensities across all peptides. This option works under the assumption that most of the proteome will not differ in abundance and only a small portion of the protein will be significantly affected by experimental conditions. If the researchers expect extreme differences in protein abundance or protein turnover, we recommend careful control of the incorporation time and defined experimental outcomes (i.e. an incomplete metabolic labeling approach when incorporation rates are extremely different might give evidence for differences in protein turnover, but might not provide sufficient evidence for differential protein abundance). The researchers should | |
| 18| | Coalescence of NeuCode channels in high-abundance peptides | Ion abundance is too high | Optimal AGC targets will vary from instrument to instrument. Reduce AGC target in the high-resolution MS1 scan. |
| Fewer identifications than expected | Poor chromatography | Optimize elution of peptides across the gradient; see28. | |
| Poor signal | Ensure routine maintenance and calibration has been performed for the mass spectrometer. Ensure autosampler is injecting proper volume. If necessary, change the column and clean heated capillary inlet. | ||
| Poor precision or spikey signal | Change column, clean heated capillary, and check electrical connections | ||
| 23| | Intensity ratios of NeuCode channels are different from expected | Incomplete incorporation of isotopologue | Ensure similar incorporation of isotopologue; see troubleshooting for step 1| or step 9|. |
Anticipated Results
MaxQuant ‘Viewer’ enables visualization of the peaks across retention time and m/z range. The ‘Viewer’ tool provides an option to toggle between the low-resolution and high-resolution spectra. With this viewer zoomed-in on a particular peptide from a 3-plex NeuCode sample, we observe the unresolved peak in the low-resolution spectra (Figure 6a) and three resolved NeuCode peaks in the high-resolution spectra (Figure 6b).
Figure 6. Example plots from MaxQuant’s ‘Viewer’ with 3-plex and 2-plex NeuCode samples.
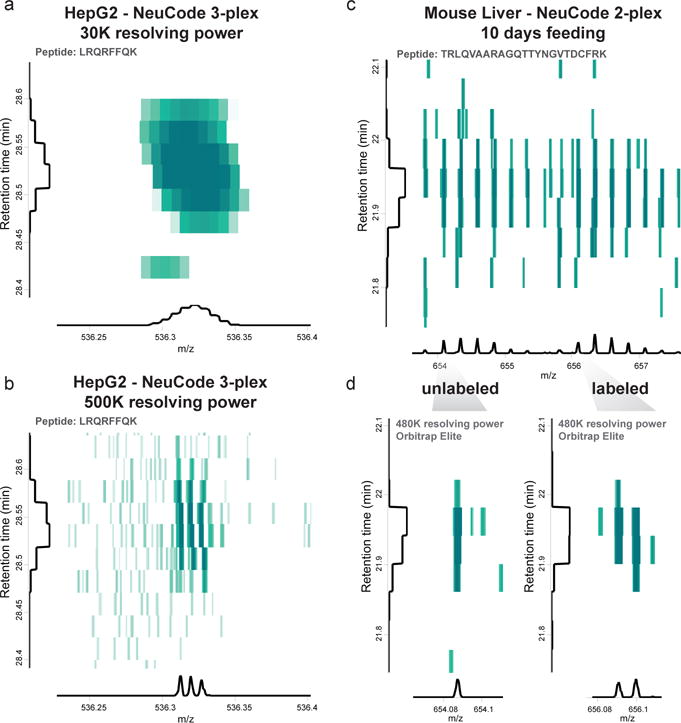
In the first example, HepG2 cells were cultured with 3-plex NeuCode lysine isotopologues and mixed at equal ratios prior to LC-MS analysis on a Thermo Fusion-Lumos instrument (a and b). The viewer can toggle between the low-resolution (a) and high-resolution (b) spectra. In our second example, mice were feed 2-plex NeuCode lysine isotopologues for 10 days, liver peptides were mixed at equal ratios and analyzed by LC-MS with a Thermo Orbitrap Elite instrument (c and d). The liver samples contain both labeled and unlabeled versions of the peptide (c) of which, only the labeled peptide contains the 2 NeuCode peaks (d).
With incomplete or partial NeuCode metabolic labeling in mice (or cells), the spectra will contain both unlabeled and labeled peptides (Figure 6c). The unlabeled peptide will be observed at the expected m/z of the peptide while the labeled peptide will be observe at (m+8)/z. Zoomed-in, the unlabeled peptide will contain one distinct high-resolution peak (Figure 6d) while the labeled peptide will have resolved NeuCode Channels (2-plex example in Figure 6c-d).
Occasionally, high abundance peaks will result in coalescence of NeuCode channels due to frequency shifts of ion clouds in the Orbitrap mass spectrometer30,31. This phenomenon occurs in proportion to the number of ions in the ion cloud, thus is typically restricted to high abundance peaks, see Supplementary Figure 1. The coalescence of NeuCode channels can be reduced by lowering the automatic gain control (AGC) target for the high resolution scan (see ?Troubleshooting). Alternative strategies for quantitation, i.e. quantifying off of the lower-abundance isotopes of the peptides, can also improve accuracy of quantitation when coalescence is present and this is implemented in the MaxQuant version for NeuCode quantitation.
Supplementary Material
Acknowledgments
We are grateful to M. Rush for comments during the writing process. This work was supported by the National Institutes of Health (P41 GM108538). K.A.O. gratefully acknowledges the support from a US National Library of Medicine training grant (5T15LM007359).
Footnotes
Author Contributions
S.T and J.C. developed the MaxQuant analysis tool. K.A.O., A.S.H, and M.S.W. analyzed data. K.A.O., A.S.H., J.C., and J.J.C. wrote the manuscript.
Competing Financial Interests
A.S.H. and J.J.C. are co-inventors on a patent application (U.S. 13/660677) related in part to the material presented here.
References
- 1.Aebersold R, Mann M. Mass spectrometry-based proteomics. Nature. 2003;422:198–207. doi: 10.1038/nature01511. [DOI] [PubMed] [Google Scholar]
- 2.Bantscheff M, Schirle M, Sweetman G, Rick J, Kuster B. Quantitative mass spectrometry in proteomics: a critical review. Analytical and bioanalytical chemistry. 2007;389:1017–1031. doi: 10.1007/s00216-007-1486-6. [DOI] [PubMed] [Google Scholar]
- 3.Cox J, et al. Accurate proteome-wide label-free quantification by delayed normalization and maximal peptide ratio extraction, termed MaxLFQ. Molecular & cellular proteomics : MCP. 2014;13:2513–2526. doi: 10.1074/mcp.M113.031591. [DOI] [PMC free article] [PubMed] [Google Scholar]
- 4.Hebert AS, et al. Neutron-encoded mass signatures for multiplexed proteome quantification. Nature methods. 2013;10:332–334. doi: 10.1038/nmeth.2378. [DOI] [PMC free article] [PubMed] [Google Scholar]
- 5.Ross PL, et al. Multiplexed protein quantitation in Saccharomyces cerevisiae using amine-reactive isobaric tagging reagents. Molecular & cellular proteomics : MCP. 2004;3:1154–1169. doi: 10.1074/mcp.M400129-MCP200. [DOI] [PubMed] [Google Scholar]
- 6.Thompson A, et al. Tandem mass tags: a novel quantification strategy for comparative analysis of complex protein mixtures by MS/MS. Analytical chemistry. 2003;75:1895–1904. doi: 10.1021/ac0262560. [DOI] [PubMed] [Google Scholar]
- 7.Hsu JL, Huang SY, Shiea JT, Huang WY, Chen SH. Beyond quantitative proteomics: signal enhancement of the a1 ion as a mass tag for peptide sequencing using dimethyl labeling. Journal of proteome research. 2005;4:101–108. doi: 10.1021/pr049837. [DOI] [PubMed] [Google Scholar]
- 8.Boersema PJ, Raijmakers R, Lemeer S, Mohammed S, Heck AJ. Multiplex peptide stable isotope dimethyl labeling for quantitative proteomics. Nature protocols. 2009;4:484–494. doi: 10.1038/nprot.2009.21. [DOI] [PubMed] [Google Scholar]
- 9.Ong SE, Mann M. A practical recipe for stable isotope labeling by amino acids in cell culture (SILAC) Nature protocols. 2006;1:2650–2660. doi: 10.1038/nprot.2006.427. [DOI] [PubMed] [Google Scholar]
- 10.Ong SE, et al. Stable isotope labeling by amino acids in cell culture, SILAC, as a simple and accurate approach to expression proteomics. Molecular & cellular proteomics : MCP. 2002;1:376–386. doi: 10.1074/mcp.m200025-mcp200. [DOI] [PubMed] [Google Scholar]
- 11.Merrill AE, et al. NeuCode labels for relative protein quantification. Molecular & cellular proteomics : MCP. 2014;13:2503–2512. doi: 10.1074/mcp.M114.040287. [DOI] [PMC free article] [PubMed] [Google Scholar]
- 12.Sleno L. The use of mass defect in modern mass spectrometry. Journal of mass spectrometry : JMS. 2012;47:226–236. doi: 10.1002/jms.2953. [DOI] [PubMed] [Google Scholar]
- 13.Gu S, Pan S, Bradbury EM, Chen X. Precise peptide sequencing and protein quantification in the human proteome through in vivo lysine-specific mass tagging. Journal of the American Society for Mass Spectrometry. 2003;14:1–7. doi: 10.1016/s1044-0305(02)00799-7. [DOI] [PubMed] [Google Scholar]
- 14.Jekel PA, Weijer WJ, Beintema JJ. Use of endoproteinase Lys-C from Lysobacter enzymogenes in protein sequence analysis. Analytical biochemistry. 1983;134:347–354. doi: 10.1016/0003-2697(83)90308-1. [DOI] [PubMed] [Google Scholar]
- 15.Denisov E, Damoc E, Lange O, Makarov A. Orbitrap mass spectrometry with resolving powers above 1,000,000. International Journal of Mass Spectrometry. 2012;325–327:80–85. doi: http://dx.doi.org/10.1016/j.ijms.2012.06.009. [Google Scholar]
- 16.Harsha HC, Molina H, Pandey A. Quantitative proteomics using stable isotope labeling with amino acids in cell culture. Nature protocols. 2008;3:505–516. doi: 10.1038/nprot.2008.2. [DOI] [PubMed] [Google Scholar]
- 17.Geiger T, et al. Use of stable isotope labeling by amino acids in cell culture as a spike-in standard in quantitative proteomics. Nature protocols. 2011;6:147–157. doi: 10.1038/nprot.2010.192. [DOI] [PubMed] [Google Scholar]
- 18.Cox J, Mann M. MaxQuant enables high peptide identification rates, individualized p.p.b.-range mass accuracies and proteome-wide protein quantification. Nature biotechnology. 2008;26:1367–1372. doi: 10.1038/nbt.1511. [DOI] [PubMed] [Google Scholar]
- 19.Minogue CE, et al. Multiplexed quantification for data-independent acquisition. Analytical chemistry. 2015;87:2570–2575. doi: 10.1021/ac503593d. [DOI] [PMC free article] [PubMed] [Google Scholar]
- 20.Rhoads TW, et al. NeuCode Labeling in Nematodes: Proteomic and Phosphoproteomic Impact of Ascaroside Treatment in Caenorhabditis elegans. Molecular & cellular proteomics : MCP. 2015;14:2922–2935. doi: 10.1074/mcp.M115.049684. [DOI] [PMC free article] [PubMed] [Google Scholar]
- 21.Baughman JM, et al. NeuCode Proteomics Reveals Bap1 Regulation of Metabolism. Cell reports. 2016 doi: 10.1016/j.celrep.2016.05.096. [DOI] [PMC free article] [PubMed] [Google Scholar]
- 22.Shishkova E, Hebert AS, Coon JJ. Now, More Than Ever, Proteomics Needs Better Chromatography. Cell systems. 2016;3:321–324. doi: 10.1016/j.cels.2016.10.007. [DOI] [PMC free article] [PubMed] [Google Scholar]
- 23.Schutz W, Hausmann N, Krug K, Hampp R, Macek B. Extending SILAC to proteomics of plant cell lines. The Plant cell. 2011;23:1701–1705. doi: 10.1105/tpc.110.082016. [DOI] [PMC free article] [PubMed] [Google Scholar]
- 24.Kruger M, et al. SILAC mouse for quantitative proteomics uncovers kindlin-3 as an essential factor for red blood cell function. Cell. 2008;134:353–364. doi: 10.1016/j.cell.2008.05.033. [DOI] [PubMed] [Google Scholar]
- 25.Potts GK, et al. Neucode Labels for Multiplexed, Absolute Protein Quantification. Analytical chemistry. 2016;88:3295–3303. doi: 10.1021/acs.analchem.5b04773. [DOI] [PMC free article] [PubMed] [Google Scholar]
- 26.Rhoads TW, et al. Neutron-encoded mass signatures for quantitative top-down proteomics. Analytical chemistry. 2014;86:2314–2319. doi: 10.1021/ac403579s. [DOI] [PMC free article] [PubMed] [Google Scholar]
- 27.Shortreed MR, et al. Elucidating Proteoform Families from Proteoform Intact-Mass and Lysine-Count Measurements. Journal of proteome research. 2016;15:1213–1221. doi: 10.1021/acs.jproteome.5b01090. [DOI] [PMC free article] [PubMed] [Google Scholar]
- 28.Richards AL, et al. One-hour proteome analysis in yeast. Nature protocols. 2015;10:701–714. doi: 10.1038/nprot.2015.040. [DOI] [PMC free article] [PubMed] [Google Scholar]
- 29.Cox J, et al. A practical guide to the MaxQuant computational platform for SILAC-based quantitative proteomics. Nature protocols. 2009;4:698–705. doi: 10.1038/nprot.2009.36. [DOI] [PubMed] [Google Scholar]
- 30.Gorshkov MV, Fornelli L, Tsybin YO. Observation of ion coalescence in Orbitrap Fourier transform mass spectrometry. Rapid communications in mass spectrometry : RCM. 2012;26:1711–1717. doi: 10.1002/rcm.6289. [DOI] [PubMed] [Google Scholar]
- 31.Werner T, et al. Ion coalescence of neutron encoded TMT 10-plex reporter ions. Analytical chemistry. 2014;86:3594–3601. doi: 10.1021/ac500140s. [DOI] [PubMed] [Google Scholar]
Associated Data
This section collects any data citations, data availability statements, or supplementary materials included in this article.