Abstract
Leptin, a hormone produced in white adipose tissue, acts in the brain to communicate fuel status, suppress appetite following a meal, promote energy expenditure, and maintain blood glucose stability1,2. Dysregulations of leptin or its receptors (LepR) result in severe obesity and diabetes3–5. Although intensive studies on leptin have transformed obesity and diabetes research2,6, clinical applications of the molecule are still limited7 which, at least in part, is due to the complexity and our incomplete understanding of the underlying neural circuits. The hypothalamic neurons expressing agouti-related peptide (AgRP) and proopiomelanocortin (POMC) were posited as the first-order leptin-responsive neurons. Selective deletion of LepR in these neurons with Cre-loxP system, however, failed to or marginally recapitulated obesity and diabetes in LepR-deficient Leprdb/db mice, suggesting that AgRP or POMC neurons are not directly required8–10. The primary neural targets for leptin are thus still unclear. Here, we conduct a systematic, unbiased survey of leptin-responsive neurons in streptozotocin (STZ)-induced diabetic mice and exploit CRISPR/Cas9-mediated genetic ablation of LepR in vivo. Unexpectedly, we find that AgRP neurons but not POMC neurons integrate the primary action of leptin to regulate both energy balance and glucose homeostasis. Leptin deficiency disinhibits AgRP neurons, and their chemogenetic inhibition reverses both diabetic hyperphagia and hyperglycemia. In sharp contrast with prior studies, we show that CRISPR-mediated deletion of LepR in AgRP neurons causes severe obesity and diabetes, fatefully replicating the phenotype of Leprdb/db mice. We also uncover divergent mechanisms underlying leptin’s acute and chronic inhibition of AgRP neurons (i.e., presynaptic potentiation of GABAergic neurotransmission and postsynaptic activation of ATP-sensitive potassium channels, respectively). Our findings provide the framework underlying the neurobiological mechanisms of leptin and associated metabolic disorders.
Keywords: leptin, AgRP, GABA, KATP, fuel metabolism, blood glucose, obesity, and diabetes
Main
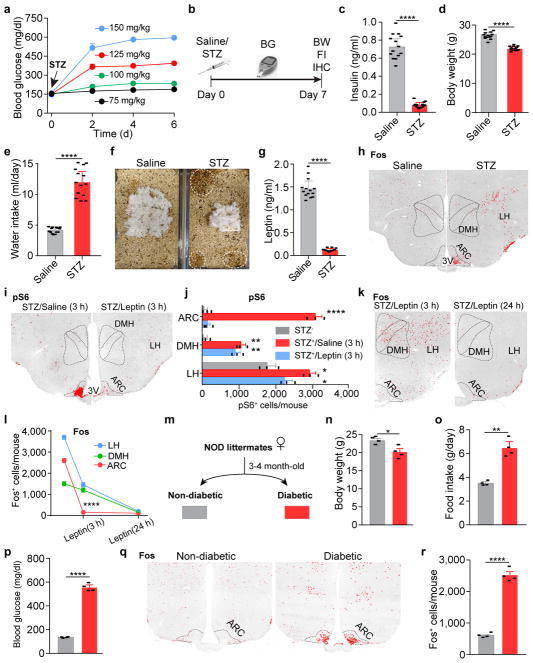
Leptin deficiency developed secondary to body weight loss in mice treated with streptozotocin (STZ), a chemical agent that selectively destroys pancreatic β-cells and causes the loss of insulin (Extended Data Fig. 1a–g); centrally-administered leptin corrects catabolic consequences and reverses hyperglycemia11,12. As the synthesis and deposit of fat require insulin, weight gain does not occur despite the lack of leptin in these animals (Extended Data Fig. 1d). We reasoned that STZ-treated diabetic mice retain leptin sensitivity and can be an alternative animal model to profile leptin-responsive neurons, exempted from the secondary effects of obesity. We systematically analyzed two surrogate markers of neuronal activity, Fos, an immediate early gene product, and ribosome protein S6, which becomes phosphorylated (pS6) in excited neurons13. Changes in the expression of Fos and pS6 were largely paralleled in the brain of STZ-treated mice, being increased in 53 and decreased in 10 brain regions (Extended Data Table 1), including discrete nuclei in the hypothalamus that enrich Lepr-expressing, leptin-responsive neurons (Fig. 1a, b, Extended Data Fig. 1h–j). In addition, similar expression patterns were seen in the brain of non-obese diabetic (NOD) mice (Extended Data Fig. 1m–r), in which diabetes is caused by insulitis14.
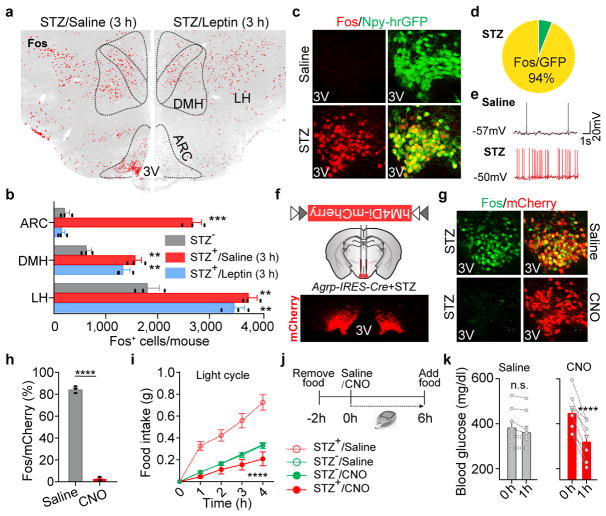
Figure 1. Overactivation of AgRP neurons induces diabetic hyperphagia and hyperglycemia.
a, b, Fos immunostaining in the mediobasal hypothalamus of STZ-treated C57BL/6 mice 3 hours after the administration of saline/leptin (n=3 mice per group). ARC, arcuate nucleus; DMH, dorsomedial hypothalamus; LH, lateral hypothalamus; 3V, 3rd ventricle. c, d, Fos::hrGFP co-immunostaining in the ARC of Npy-hrGFP transgenic mice following saline/STZ treatment (n=4 mice per group). e, Representative traces of brain slice whole-cell current clamp recordings in AgRP neurons of Npy-hrGFP mice treated with saline/STZ (n=10 neurons per group from 3 mice). f, Diagram of AAV pSyn-FLEX-hM4Di-mCherry injected into the ARC of STZ-treated Agrp-IRES-Cre mice and mCherry immunostaining. g, h, mCherry::Fos co-immunostaining in STZ-treated Agrp-IRES-Cre mice following the administration of saline/CNO (n=4 mice per group). i, Food intake (10 a.m.-2 p.m.) in ad libitum fed, virus-transduced Agrp-IRES-Cre mice following the administration of saline/CNO (n=8 mice per group). j, k, Experimental design and blood glucose before and 1 hour after Saline/CNO treatment in STZ-treated, virus-transduced Agrp-IRES-Cre mice (n=8 mice per group). Data are mean ± s.e.m. and representative of three independent experiments; **P<0.01, ***P<0.001, ****P<0.0001; Student’s two-tailed, unpaired t-test (b, h), paired t-test (k) or two-way ANOVA analysis (i).
To identify neurons primarily affected by leptin deficiency, we administered leptin in STZ-treated mice. Remarkably, the neuronal activity changes in STZ-treated mice as labeled by molecular markers were broadly corrected 24 hours following leptin infusion, while leptin treatment as brief as 3 hours reversed only those in the arcuate nucleus (ARC), not those in the adjacent lateral hypothalamus (LH) or the dorsomedial hypothalamus (DMH) (Fig. 1a, b, Extended Data Fig. 1i–l), indicating that the ARC contains the majority of neurons that directly respond to leptin stimulation.
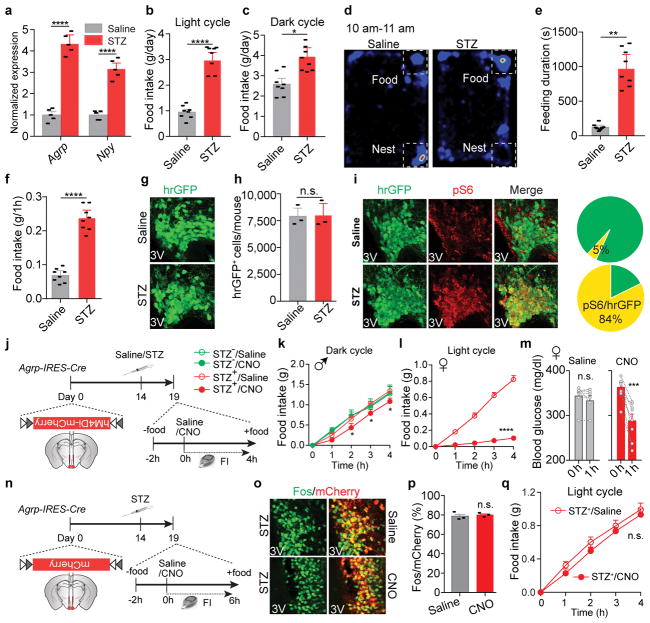
We postulated that Fos- and pS6-expressing neurons in the ARC are, at least in part, agouti-related peptide (AgRP)-expressing neurons, given that STZ induces: 1) the loss of insulin and leptin (Extended Data Fig.1c, g), both of which inhibit AgRP neurons15–17; 2) increased expression of Agrp and Npy mRNA in the mediobasal hypothalamus (Extended Data Fig. 2a); and 3) severe diabetic hyperphagia during both light and dark cycles (Extended Data Fig. 2b–f, Supplementary Video 1), mirroring the voracious feeding in mice with activated AgRP neurons18,19. To investigate this, STZ-treatment was repeated in Npy-hrGFP transgenic mice given the faithful co-expression of AgRP and neuropeptide Y (NPY) in the ARC20. Indeed, AgRP neurons were significantly activated as judged by intensive expression of Fos and pS6, depolarization, and increased firing rates (Fig. 1c–e, Extended Data Fig. 2g–i). To determine the pathological relevance of activated AgRP neurons, we bilaterally injected AAV carrying a Cre-dependent hM4Di-mCherry transgene19 into the ARC of Agrp-IRES-Cre mice, followed by STZ-treatment (Extended Data Fig. 2j). Stimulation of hM4Di with clozapine-N-oxide (CNO), thereby inhibiting AgRP neurons, attenuated FosARC expression (Fig. 1g, h), suppressed diabetic hyperphagia (Fig. 1i, Extended Data Fig. 2k, l), and significantly reduced hyperglycemia (Fig. 1j, k, Extended Data Fig. 2m). CNO injection into STZ-treated, AAV-FLEX-mCherry virus-transduced animals elicited no significant changes in these parameters (Extended Data Fig. 2n–q). These results demonstrate that AgRP neurons represent the major ARC neurons that are primarily disinhibited by leptin deficiency, and that their enhanced firing rate contributes essentially to both diabetic hyperphagia and hyperglycemia.
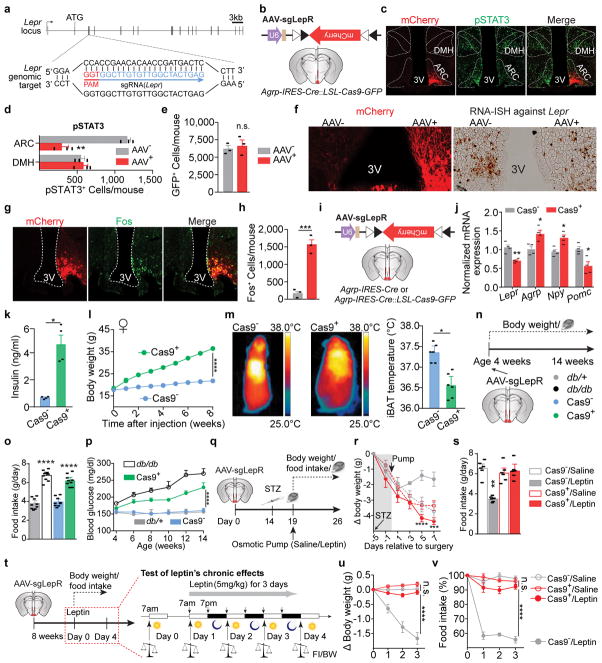
The aforementioned findings, however, contradict the prevailing view that AgRP neurons are dispensable for leptin’s action in the brain, since selectively disrupting LepR on AgRP neurons previously failed to recapitulate either obesity or diabetes of Leprdb/db mice9. To revisit leptin action and avoid potential compensatory effects21,22, we employed CRISPR gene-editing technology23. We constructed an AAV carrying a single-guide RNA (sgRNA) targeting the mouse Lepr locus and a Cre-dependent mCherry reporter to indicate virus-transduced neurons (AAV-sgLepR, Fig. 2a, Extended Data Fig. 3a). To examine the efficacy of CRISPR-mediated deletion of LepR, we mated Agrp-IRES-Cre with Cre-enabled Rosa26-LSL-Cas9-GFP knockin mice24 to specifically express Cas9 endonuclease in AgRP neurons, then carried out unilateral injection of AAV-sgLepR into the ARC of Agrp-IRES-Cre::LSL-Cas9-GFP offspring (Extended Data Fig. 3b). Of note, reduced expression of Lepr mRNA, attenuated leptin-induced phosphorylation of STAT3 (pSTAT3, a marker for LepR activity), and increased Fos (a marker to indicate disinhibition of neurons) were restricted in the virus-transduced ARC, but not in the contralateral ARC without AAV, nor in the adjacent DMH without Cre-activity (Extended Data Fig. 3c–h), suggesting an effective, neuron type-specific disruption of LepR with CRISPR.
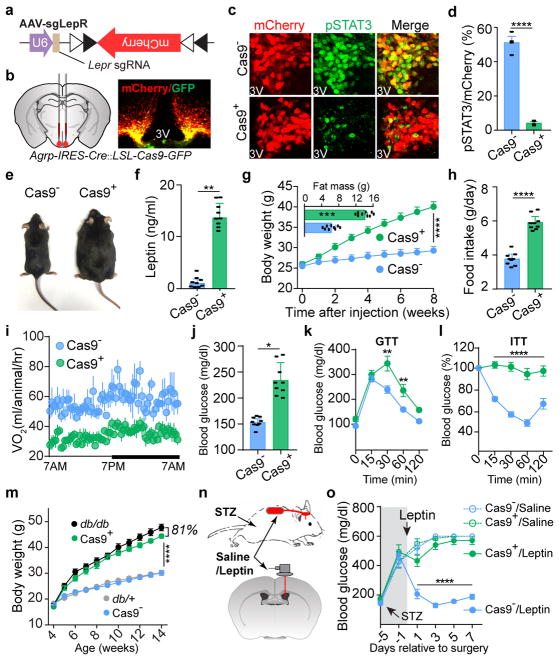
Figure 2. CRISPR-mediated deletion of leptin receptors in AgRP neurons results in severe obesity and diabetes.
a, b, Schematic diagram of AAV pU6-sgRNALepr::pEF1α-FLEX-mCherry (AAV-sgLepR) injected bilaterally into the ARC of Agrp-IRES-Cre::LSL-Cas9-GFP mice and mCherry::GFP co-immunostaining. c, d, Coimmunostaining of mCherry and leptin-induced phosphorylated STAT3 (Tyr705, pSTAT3) in virus-transduced Agrp-IRES-Cre (Cas9−, upper panel) and Agrp-IRES-Cre::LSL-Cas9-GFP mice (Cas9+, lower panel) (n=4 mice per group). e–l, Representative littermates (e), serum leptin levels (f), body weight and analysis of fat mass (insert) (g), daily food intake (h), oxygen consumption (i), ad libitum fed blood glucose levels (j), Glucose-tolerance test (k), and Insulin-tolerance test (l) at 8 weeks post-viral injection (n=9 mice per group). m, Growth curve following viral injection into the ARC of 4-week-old Agrp-IRES-Cre (Cas9−), Agrp-IRES-Cre::LSL-Cas9-GFP (Cas9+), Leprdb/+ (db/+), and Leprdb/db (db/db) mice (n=9 mice per group). n, o, Schematic diagram and blood glucose measurement in STZ-treated, virus-transduced Agrp-IRES-Cre (Cas9−) and Agrp-IRES-Cre::LSL-Cas9-GFP mice (Cas9+) mice following chronic administration of saline/leptin into the lateral ventricle with implanted osmotic pump (n=9 mice per group). Data are mean ± s.e.m. and representative of three independent experiments; *P<0.05, **P<0.01, ***P<0.001, ****P<0.0001; Student’s two-tailed, unpaired t-test (d, f, g-insert, h, j) or two-way ANOVA (g, k, l, m, o) with Šidák post hoc test (k).
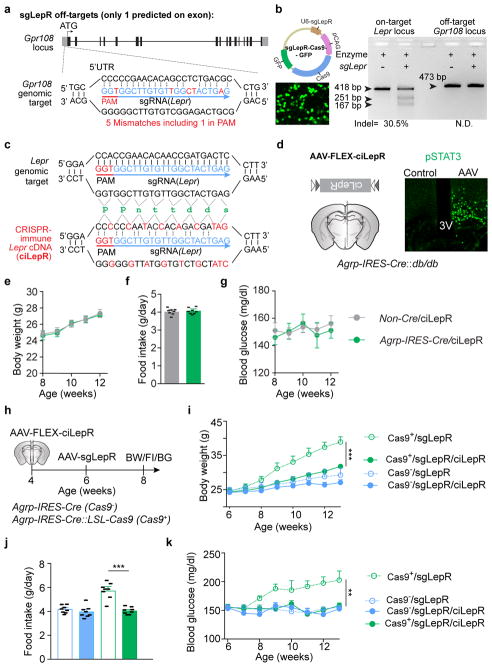
To assess the functional relevance of LepR on AgRP neurons, we performed bilateral AAV injection (Fig. 2b). Intensive co-localization of Cre-enabled mCherry and leptin-induced pSTAT3 was largely diminished in virus-transduced AgRP neurons expressing Cas9 (Fig. 2c, d). Importantly, CRISPR-mediated deletion of LepR on AgRP neurons induced severe hyperleptinemia, obesity, and diabetes, as evidenced by elevated fat mass, increased body weight and daily food intake, reduced energy expenditure and brown adipose tissue activity, elevated serum levels of leptin, insulin and blood glucose, impaired glucose tolerance, and extreme insulin resistance, in both male and female mice (Fig. 2e–l, Extended Data Fig. 3i–m). Of note, these effects are not due to CRISPR-mediated off-site mutagenesis, since AgRP neuron-specific expression of a CRISPR-immune Lepr transgene (ciLepr) encoding the long-form LepR completely prevented such changes in body weight, feeding, and blood glucose (Extended Data Fig. 4a–k). As an additional comparison, we injected AAV in parallel into the ARC of Leprdb/db mice of the same age. Remarkably, the weight gain in mice with disrupted LepR on AgRP neurons is ~81% of that in mice with a total lack of LepR (Leprdb/db) (Fig. 2m), together with ~85% of hyperphagia and ~61% of hyperglycemia (Extended Data Fig. 3n–p), demonstrating that the lack of LepR on AgRP neurons plays a major role in the development of obesity in Leprdb/db mice. To determine whether LepR on AgRP neurons is also required for leptin to reverse STZ-induced diabetes, we transduced these neurons with AAV-sgLepR, followed by STZ-treatment and implantation of an osmotic pump to chronically infuse leptin centrally (Fig. 2n, Extended Data Fig. 3q). In control diabetic mice, leptin infusion reversed the extreme hyperglycemia, consistent with prior findings11; this effect, however, was abolished in mice expressing Cas9 in AgRP neurons, as was leptin’s ability to restore other catabolic consequences (Fig. 2o, Extended Data Fig. 3r, s). Leptin-induced chronic effects on body weight and food intake was also impaired in animals without STZ-treatment (Extended Data Fig. 3t–v). Lastly, we performed CRISPR-mediated deletion of LepR on the ARC POMC neurons and observed no effects either on body weight or on blood glucose, indicating that LepR on POMC neurons is dispensable (Extended Data Fig. 5a–j). Taken together, our findings demonstrate that leptin acts primarily on AgRP neurons to maintain energy and glucose homeostases, preventing both obesity and diabetes.
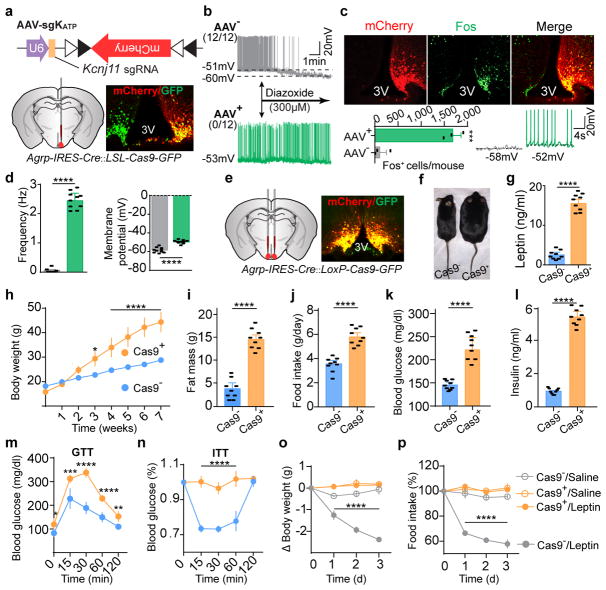
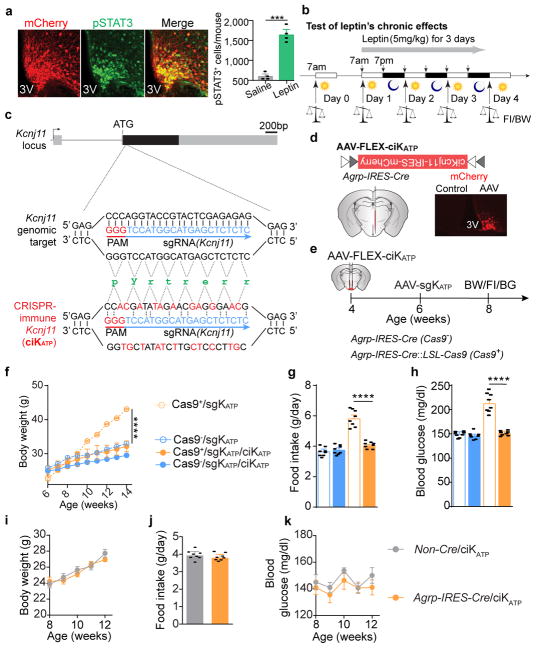
How does leptin inhibit AgRP neurons? Leptin has been shown to hyperpolarize the hypothalamic neurons by opening ATP-sensitive potassium channels (KATP) in acute rat brain slices25; however, global deletion of KATP channel subunits Kir6.2 or SUR1 in mice results in slightly impaired glucose tolerance, without notable changes in body weight26,27. To interrogate the functional relevance of KATP in AgRP neurons, we constructed an AAV carrying a sgRNA targeting the mouse Kcnj11 locus and a Cre-dependent mCherry transgene (AAV-sgKATP) to achieve CRISPR-mediated deletion of the pore-forming subunit Kir6.2 (Fig. 3a). Following unilateral injection of AAV-sgKATP into the ARC of Agrp-IRES-Cre::LSL-Cas9-GFP mice, virus-transduced AgRP neurons exhibited significantly increased Fos expression, depolarization, and firing rates in ad libitum fed mice, and no responses to a KATP opener, diazoxide, which significantly induced hyperpolarization and reduced firing of AgRP neurons in fasted animals, compared to the contralateral control neurons (Fig. 3b–d), suggesting functional disruption of K+ efflux. Leptin-induced expression of pSTAT3 was not obviously affected (Extended Data Fig. 6a). Following bilateral AAV injection, development of severe hyperleptinemia, obesity, and diabetes was observed in mice with Cas9 expressed in AgRP neurons (Fig. 3e–n), comparable to the phenotypes observed in mice following AgRP neuron-specific LepR disruption (Fig. 2e–l). Since expression of a CRISPR-immune Kcnj11 transgene (ciKcnj11) in AgRP neurons prevented the changes in body weight, feeding, and blood glucose, contributions from CRISPR-mediated off-site mutagenesis were excluded (Extended Data Fig. 6c–k). To determine whether KATP channels in AgRP neurons are required for leptin’s actions, changes in body weight and food intake were monitored following 3-day consecutive injection of leptin or saline (Extended Data Fig. 6b). While leptin significantly reduced body weight and food intake in the control group, it had no effects on mice with disrupted KATP channels in AgRP neurons (Fig. 3o, p). These results demonstrate that KATP channels negatively regulate AgRP neurons and deletion of them in these neurons significantly attenuates leptin’s action to maintain energy balance and glucose homeostasis.
Figure 3. KATP channels in AgRP neurons are required for leptin regulation of body weight and blood glucose.
a, Schematic diagram of AAV pU6-sgRNAKcnj11::pEF1α-FLEX-mCherry (AAV-sgKATP) unilaterally injected into the ARC of Agrp-IRES-Cre::LSL-Cas9-GFP mice and mCherry::GFP co-immunostaining. b, Representative traces of whole-cell current-clamp recordings in AgRP neurons from non-virus-transduced (gray, AAV−) and virus-transduced sides (green, AAV+) in 24-hour fasted Agrp-IRES-Cre::LSL-Cas9-GFP mice. KATP channel opener diazoxide was applied as indicated (n=12 neurons per group from 4 mice). c, d, mCherry::Fos co-immunostaining and representative traces of brain slice whole-cell current-clamp recordings in AgRP neurons of Agrp-IRES-Cre::LSL-Cas9-GFP mice with unilaterally-injected virus into the ARC (c), and quantification of frequency and membrane potential (d) (n=10 neurons per group from 3 mice). e–n, Schematic diagram of AAV-sgKATP bilaterally injected into the ARC of Agrp-IRES-Cre::LSL-Cas9-GFP mice and mCherry::GFP co-immunostaining (e), representative littermates (f), serum leptin levels (g), body weight (h), fat mass (i), daily food intake (j), ad libitum fed state blood glucose levels (k), serum insulin levels (l), Glucose-tolerance test (m), and Insulin-tolerance test (n) at 8 weeks post-viral injection (n=9 mice per group). o, p, Body weight and daily food intake changes during 3-day consecutive treatment with saline/leptin (n=9 mice per group). Data are mean ± s.e.m. and representative of three independent experiments; *P<0.05, **P<0.01, ***P<0.001, ****P<0.0001; Student’s two-tailed, unpaired t-test (b, c, g, i–l) or two-way ANOVA (o, p) with Šidák post hoc test (h, m–n).
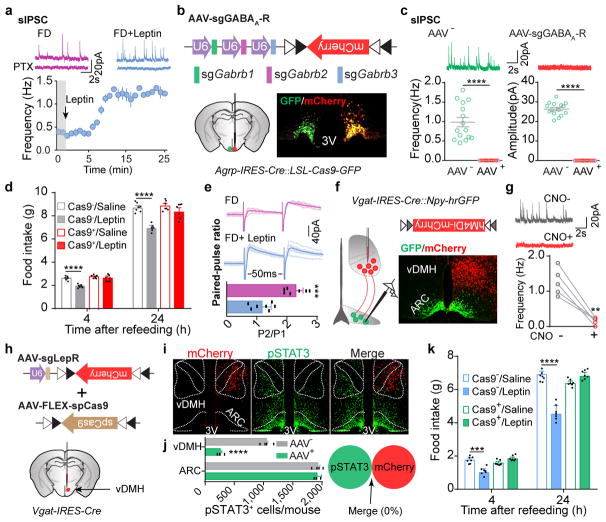
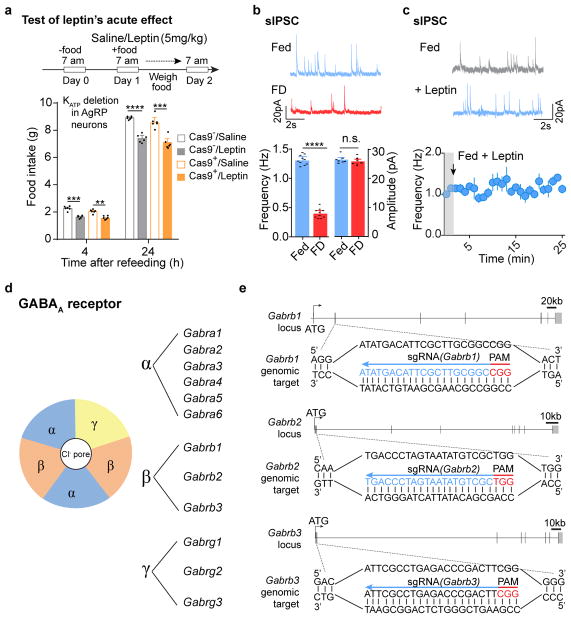
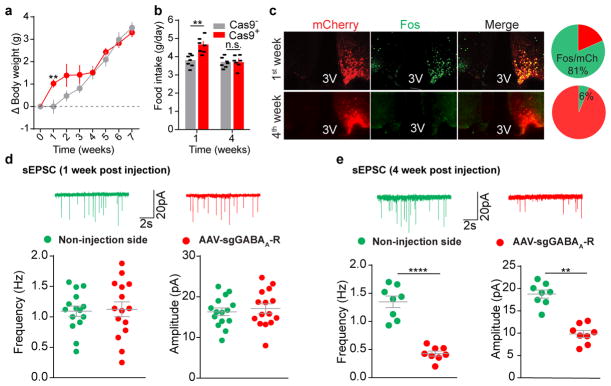
Leptin inhibits hunger-induced appetite and suppresses overeating following an acute fasting period. This effect of leptin, however, was unchanged in mice with disrupted KATP channels in AgRP neurons (Extended Data Fig. 7a), suggesting an alternative mechanism. Since picrotoxin-sensitive spontaneous inhibitory postsynaptic currents (sIPSCs) in AgRP neurons were markedly reduced following fasting when circulating leptin levels were low, and were restored by further leptin incubation (Fig. 4a, Extended Data Fig. 7b, c), we considered GABAergic afferent modulation on AgRP neurons as an additional option28. Given the complex composition of GABAA receptors, genetic ablation of total ionotropic GABAergic neurotransmission in neurons is not yet possible29 (Extended Data Fig. 7d). To investigate the physiological relevance of GABAergic neurotransmission on AgRP neurons, we constructed an AAV carrying three concatenated sgRNAs targeting the mouse loci (Gabrb1/2/3) encoding all three GABAA-R β subunits, respectively, and a Cre-dependent mCherry transgene (AAV-sgGABAA-R) (Fig. 4b, Extended Data Fig. 7e). Following unilateral injection of AAV into the ARC of Agrp-IRES-Cre::LSL-Cas9-GFP mice, sIPSCs were eliminated from virus-transduced AgRP neurons (Fig. 4b, c), suggesting a rapid, effective disruption of postsynaptic GABAA-Rs with CRISPR. Bilateral deletion of GABAA-Rs in AgRP neurons induced transient body weight gain and a short-term increase in daily food intake, both of which disappeared 4 weeks following AAV injection, likely due to a compensated balance established between excitatory and inhibitory synaptic transmission (Extended Data Fig. 8a–e). Of note, during the experimental period, leptin’s acute suppression of hunger-induced appetite was consistently missing in virus-transduced mice with Cas9 expression (Fig. 4d), but its chronic effects on body weight and food intake remained unaffected (Extended Data Fig. 9a, b). This loss-of-function was prevented by expression of a CRISPR-immune Gabrb3 transgene (ciGABAA-R) in AgRP neurons, with persisting GABAergic neurotransmission (Extended Data Fig. 9c–k), illustrating that GABAergic afferents on AgRP neurons are necessary.
Figure 4. Presynaptic GABAergic afferents to AgRP neurons mediate acute leptin inhibition of feeding.
a, Representative traces and frequency of sIPSCs recorded with or without leptin incubation in AgRP neurons of 24-hour fasted Npy-hrGFP mice. Picrotoxin (PTX) was added to verify GABAergic chloride efflux (n=7 neurons from 3 mice). b, Schematic diagram of AAV pU6-sgRNAGabrb1/2/3::pEF1α-FLEX-mCherry unilaterally injected into the ARC of Agrp-IRES-Cre::LSL-Cas9-GFP mice and mCherry::GFP co-immunostaining. c, Representative traces and quantification of frequency and amplitude of sIPSCs recorded in AgRP neurons from the virus-injected (red) or non-injected sides (green) (n=15 neurons per group from 3 mice). d, Post-fast refeeding study in virus-transduced Agrp-IRES-Cre (Cas9−) and Agrp-IRES-Cre::LSL-Cas9-GFP mice (Cas9+) mice, following the administration of saline/leptin (n=7 mice per group). e, Representative traces and quantification of electrically-evoked IPSCs (eIPSC) paired-pulse ratio in AgRP neurons from 24-hour fasted Npy-hrGFP mice (n=7 neurons per group from 3 mice). f, g, Schematic diagram of Cre-dependent AAV pSyn-FLEX-hM4Di-mCherry unilaterally injected into the ventral DMH (vDMH) of Vgat-IRES-Cre::Npy-hrGFP mice and mCherry::GFP co-immunostaining (f), as well as representative traces and quantification of sIPSCs recorded in AgRP neurons upon CNO incubation (g, n=5 neurons). h–j, Schematic diagram of AAV pU6-sgRNALepr::pEF1α-FLEX-mCherry and Cre-dependent AAV pMeCP2-FLEX-spCas9 unilaterally injected into the vDMH of Vgat-IRES-Cre mice to disrupt presynaptic leptin receptors (h), mCherry and leptin-induced pSTAT3 co-immunostaining (i) and quantification (j, n=4 mice). k, Post-fast refeeding study in bilaterally, dual virus-transduced Vgat-IRES-Cre (Cas9−) and Vgat-IRES-Cre::LSL-Cas9-GFP (Cas9+) mice, following the administration of saline/leptin (n=7 mice per group). Data are mean ± s.e.m. and representative of three independent experiments, **P<0.01, ***P<0.001, ****P<0.0001; Student’s two-tailed, unpaired t-test (c, d, e, j, k) or student’s two-tailed, paired t-test (g).
Finally, we investigated leptin’s modulation of GABAergic afferents on AgRP neurons. In fasted but not ad libitum fed mice, leptin significantly suppressed paired-pulse ratio of electrically-evoked IPSCs (eIPSCs), suggesting presynaptic potentiation of GABA release (Fig. 4e, Extended Data Fig. 9l). Since some LepR-expressing neurons in the ventral DMH (vDMH) are GABAergic10 and monosynaptically innervate AgRP neurons30 (Extended Data Fig. 9m, n), we injected AAV-FLEX-hM4Di-mCherry into the vDMH of Vgat-IRES-Cre::Npy-hrGFP mice to specifically transduce GABAergic neurons in this nucleus (vGATvDMH neurons, Fig. 4f). Inhibition of these neurons upon incubation with CNO eliminated the majority of sIPSCs recorded on AgRP neurons (Fig. 4g), suggesting that vGATvDMH neurons represent a dominant source of GABAergic afferents. We simultaneously transduced vGATvDMH neurons with AAV-sgLepR and a Cre-dependent AAV carrying a spCas9 transgene, and effectively deleted LepR as revealed by reduced immunoactivity of leptin-induced pSTAT3 (Fig. 4i, j). Residual LepR-activity is presumably from the DMH non-GABAergic neurons10. Disruption of LepR in vGATvDMH neurons prevented leptin’s inhibition of fasting-induced overeating (Fig. 4k), replicating the results obtained in mice following postsynaptic GABAA-R deletion (Fig. 4d). These results indicate that leptin also engages presynaptic potentiation of GABA release to inhibit AgRP neurons and to suppress hunger-induced appetite.
Taken together, our current study, as summarized in Extended Data Fig. 9o, identifies the fundamental component of the neural circuits governing energy and blood glucose regulation and will greatly facilitate future studies seeking therapeutic interventions for obesity and diabetes. The disparity in phenotypes following CRISPR-mediated gene-editing also highlight the need for a careful re-examination of prior conclusions drawn from conventional genetic ablation studies.
Online Content Methods, along with additional Extended Data display items and Source Data, are available in the online version of the paper; references unique to these sections appear only in the online paper.
Online Methods
Mice
All animal care and procedures were performed in accordance with national and international guidelines and were approved by the Tufts University/Tufts Medical Center Institutional Animal Care and Use Committee (IACUC), in accordance with NIH guidelines. Mice were group housed (2–5 siblings) at 22°C–24°C with a 12-h light/dark cycle, and with ad libitum access to a regular chow diet and water. All diets were provided as pellets. Mice were euthanized by CO2 narcosis. Agrp-IRES-Cre31 (Jax Stock No: 012899), Npy-hrGFP32 (Jax Stock No: 006417), Pomc-hrGFP33 (Jax Stock No: 006421), Pomc-Cre34 (Jax Stock No: 010714), Vgat-IRES-Cre35 (Jax Stock No: 016962) were previously generated at the BNORC transgenic core and are available at the Jackson Laboratory. Rosa26-LSL-Cas9-GFP36 (Jax Stock No: 024857) knock-in mice, NOD37 (Jax Stock No: 001976) mice, Leprdb/db (Jax Stock No: 000642) mice, C57BL/6 (Jax Stock No: 000664) mice were obtained from the Jackson Laboratory. Male mice of every mouse line were used for all experiments, and some female mice were used for clinically relevant experiments, particularly with the Agrp-IRES-Cre and NOD mouse lines. Following stereotaxic injection to express AAVs, mice were individually housed with ad libitum access to regular chow diet and water. Littermates of the same sex were randomly assigned to either experimental or control groups.
Virus production
Cre-dependent adeno-associated virus (AAV) viral vectors were constructed based on pAAV-pEF1α-FLEX-mCherry-WPRE-pA plasmid38. For the AAVs to deliver single-guide RNAs (sgRNAs) into the hypothalamus, sgRNAs were designed using online CRISPR tools (http://crispr.mit.edu/39 and http://chopchop.cbu.uib.no/)40. The pU6-sgRNA-scaffold cassettes to express single or concatenated sgRNAs, including those in AAV vectors AAV-pU6-sgRNALepr::pEF1α-FLEX-mCherry, AAV-pU6-sgRNAKcnj11::pEF1α-FLEX-mCherry, and AAV-pU6-sgRNAGabrb1/2/3::pEF1α-FLEX-mCherry, were constructed using a lab-designed “Snap-Ligation” kit (Xu and Kong, unpublished), followed by cloning into the MluI site on pAAV-pEF1α-FLEX-mCherry-WPRE-pA plasmid. For the AAVs to express CRISPR-immune (ci) cDNAs in cre-expressing neurons, including AAV-pEF1α-FLEX-ciLepr, AAV-FLEX-ciKATP, and AAV-pEF1α-FLEX-ciGabrb3, cDNAs were generated from the total RNAs extracted from the hypothalamus of C57BL/6 mice by reverse transcription. The DNA fragments containing coding DNA sequences (CDS) of Lepr (encoding the long form leptin receptor, LepR-b), Kcnj11 (encoding Kir6.2), and Gabrb3 (encoding GABAA-receptor β3 subunit) were amplified with the following pairs of PCR primers: Lepr-Fwd: tttaaaaggatttgcagcgg and Lepr-Rev: atgacaggctctactggaat; Kcnj11-Fwd: ggtagacttatcccgccgtg and Kcnj11-Rev: cctaggccaagccagtgtag; Gabrb3-Fwd: gaagggatgtggggctttgcg and Gabrb3-Rev: agcccatcacagagaagcca. Second PCR reactions were performed to introduce silent mutations in sgRNA-binding sites with the following primers: ciLepr-Fwd: atgatgtgtcagaaattctatgtggttttgttacactgggaatttctttatgtgatagctgcacttaacctggcatatccaatctctccctggaaatttaagttgttttgtggaccccccaataccacagacgatagctttctctcacctgctggagcccc and ciLepr-Rev: attacacagttaagtcacac; ciKcnj11-Fwd: atgctgtcccgaaagggcattatccctgaggaatatgtgctgacccggctggcaggggaccctgcagagccacgatatagaacgagggaacggagggcccgcttcgtgtccaagaaaggcaac and ciKcnj11-Rev: tcaggacaaggaatctggag; ciGabrb3-Fwd: atgtggggctttgcgggaggaaggcttttcggcatcttctcggccccggtgctggtggcggtggtttgctgcgctcagagcgtaaacgaccccgggaacatgtcctttgtgaaggagacggtcgacaagctgttgaaaggctacgacataagattacgtccagattttgggggtcccccagtctgcgtggggatg and ciGabrb3-Rev: tcagttaacatagtacagccag. Following Sanger DNA sequencing to verify the mutations, the obtained DNA fragments were ligated into the AscI and NheI restriction enzyme sites of pAAV-pEF1α-FLEX-mCherry-WPRE-pA plasmid. The above listed AAV vectors were packaged at the Boston Children’s Hospital Viral Core. For “CRISPR-immune” GABAA-R subunit re-expression experiments following CRISPR-mediated deletion in AgRP neurons, cDNA encoding GABAA-R β3 subunit was selected since this subunit is abundantly expressed in AgRP neurons according to a recent gene-profiling study41.The construction and generation of AAV-FLEX-spCas9 virus was reported elsewhere (Chieng et al, unpublished). AAV-pSyn-FLEX-hM4Di-mCherry42 virus was generated from University North Carolina Vector Core. AAV-pEF1α-FLEX-Synaptophysin-mCherry43 virus was obtained from MIT Viral Gene Transfer Core. In addition, the following AAV coat serotypes and titer (viral molecules/ml) were used: pU6-sgRNALepr::pEF1α-FLEX-mCherry (2/8, 1.9×10¹⁴), pU6-sgRNAKcnj11::pEF1α-FLEX-mCherry (2/8, 7.2×10¹⁴), pU6-sgRNAGabrb1/2/3::pEF1α-FLEX-mCherry (2/8, 1.7×10¹⁵), AAV-FLEX-ciLepR (DJ, 8.5×10¹³), AAV-FLEX-ciKATP (DJ, 2.2×10¹⁴), AAV-FLEX-ciGABAA-R-GFP (DJ, 1.9×10¹⁴), AAV-FLEX-SpCas9 (DJ, 1.8×10¹⁴), AAV-hSyn-FLEX-hM4Di-mCherry (2/8, 6.7×10¹²). Viral aliquots were stored at −80 °C before stereotaxic injection.
Stereotaxic surgery
Stereotaxic surgeries to deliver AAV into the hypothalamus of mice were performed as previously described44. Briefly, 4–8 week-old mice were anesthetized with ketamine (75 mg/kg) and xylazine (5 mg/kg) diluted in saline (0.9% NaCl in water) and fixed on a stereotaxic apparatus (KOPF model 922) with ear-bars. After exposing the skull via a small incision, a small hole was drilled for injection based on coordinates to bregma. A pulled-glass pipette with 20–40 μm tip diameter was inserted into the brain and AAV viruses (50–150 nl per injection site) were injected by a lab-built air-puff system. A micromanipulator (Grass Technologies, Model S48 Stimulator) was used to control injection speed at 25 nl/min and the pipette was left in position for another 5 min before being withdrawn to allow enough absorption and spreading of AAVs. For postoperative care, mice were injected intraperitoneally with meloxicam (0.5 mg/kg) for two continuous days. All stereotaxic injection sites were verified under electrophysiological microscopy (for electrophysiology-related studies) or by immunohistochemistry (for anatomy and in vivo studies). All ‘missed’ or ‘partial-hit’ animals were excluded from data analyses. Animals were allowed to recover from surgery for 1 week and their body weight and health conditions were closely monitored during recovery. Coordinates and injection volume used in the studies are: the ARC (AP: −1.40 mm, DV: −5.80 mm, LR: ±0.30 mm, 150 nl/side) and the vDMH (AP: −1.80 mm, DV: −5.30 mm, LR: ±0.30 mm, 50 nl/side).
Brain slice preparation and electrophysiology
Mice less than 8 weeks of age were anesthetized by inhalation of isoflurane. 300 μm thick coronal sections were cut with a Leica VT1000S vibratome and then incubated in carbogen saturated (95% O2/5% CO2) ACSF (in mM: 125 NaCl, 2.5 KCl, 1 MgCl2, 2 CaCl2, 1.25 NaH2PO4, 25 NaHCO3, 10 glucose) at 34 °C for 30–45 min before recording. All recordings were obtained within 4 h of slicing at room temperature. Whole-cell recordings were obtained from arcuate AgRP neurons visualized under infrared differential interference contrast (IR-DIC) using patch pipettes with pipette resistance of 2.5–4.5 MΩ. To identify infected AgRP neurons, mCherry or GFP fluorescence or both were detected using epifluorescence illumination. For sIPSC and sEPSC recordings, the internal solution contained (in mM) 135 CsMeSO3, 10 HEPES, 1 EGTA, 3.3 QX-314 (Cl− salt), 4 Mg-ATP, 0.3 Na-GTP, 8 Na2-phosphocreatine (pH 7.3 adjusted with CsOH; 295 mOsm·kg−1). For current clamp recordings, the internal solution consisted of (in mM) 135 KMeSO3, 3 KCl, 10 HEPES, 1 EGTA, 0.1 CaCl2, 4 Mg-ATP, 0.3 Na-GTP, 8 Na2-phosphocreatine (pH 7.3 adjusted with KOH; 295 mOsm·kg−1). For KATP knockout identification, mice were fasted for 24 h to activate AgRP neuronal activities before brain slice preparation. Diazoxide (Sigma #D9035) was added into the bath solution (300 μM). For leptin-induced sIPSC recording, mice were fasted for 24 h and 100 nM mouse leptin (Dr. A. F. Parlow, NHHP, NIDDK) was added into bath solution. Mouse leptin was purchased from Dr. A.F. Parlow (NHHP, NIDDK) as 1 mg powder aliquots. A stock solution of 78 μM was made by dissolving 1 mg leptin with 500 μl 15 mM HCl and 300 μl 7.5 mM NaOH. When bath incubation for brain slices was used, a 1:780 dilution was prepared to achieve the final concentration of 100 nM. 100 μM picrotoxin (PTX, TOCRIS, #1128) was added to block ionotropic GABAA receptors. For inhibitory hM4Di-related assays, clozapine-N-oxide (CNO) (10 μM, supplied by the NIH Drug Supply Program) was added to the bath solution. To assess IPSCs paired-pulse ratio, pairs of electrical microstimulation pulses were delivered at 50-ms inter-pulse intervals and selected low enough to ensure recovery of the presynaptic terminals (30s interval). Recordings were made using an Axoclamp 700B amplifier (Axon Instruments) at room temperature. Data were filtered at 3 kHz and sampled at 10 kHz. Series resistance, measured with a 5 mV hyperpolarizing pulse in voltage clamp, was on average under 20 MΩ and less than 25 MΩ, uncompensated. All voltage-clamp recordings were made from cells held at −60 mV. For current-clamp recordings, membrane potentials were corrected for a ~8 mV liquid junction potential.
Immunohistochemistry
Immunohistochemistry was performed as previously described44. Briefly, mice were transcardially perfused with 10% formalin and the brains post-fixed for 1–2 days. Brains were sectioned coronally at 40 μm using a Leica microtome (Leica SM2010R). Brain sections were washed in PBS with 0.25% Triton X-100 (PBT, pH 7.4) and incubated in 3% normal donkey serum (Jackson ImmunoResearch Laboratories, Inc., West Grove, PA #017-000-121) in PBT-azide for 2 h. Slides were then incubated overnight at room temperature in a primary antiserum. After washing in PBS, sections were incubated in fluorescein conjugated donkey IgG. Primary antibodies used in the current study and their dilutions are: rabbit anti-DsRed (Clontech, 1:2000, Cat#632496), chicken anti-mCherry (EnCor Biotechnology, 1:2000, # CPCA-mCherry), chicken anti-GFP (Aves Labs, 1:2000, GFP-1010), rabbit anti-hrGFP (Agilent Technologies, 1:1000, Cat# 240142), goat anti-Fos (Santa Cruz Biotechnology, 1:150, Cat# sc-52-g), rabbit anti-pSTAT3 (Cell Signaling Technology, 1:1000, Cat# 9145S), rabbit phosphor-S6 ribosomal protein (S235/236) (Cell Signaling Technology, 1:1000, Cat# 4858). Secondary antibodies include Alexa594 Donkey anti-rabbit IgG (Invitrogen, 1:200, Cat#A-21207), Alexa594 Donkey anti-chicken IgG (Jackson ImmunoResearch, 1:200, Code#703-585-155), Alexa488 Donkey anti-chicken IgG (Jackson ImmunoResearch, 1:200, Code#703-545-155), Alexa488 Donkey anti-rabbit IgG (Invitrogen, 1:200, Cat#A-21206), Alexa488 Donkey anti-goat IgG (Invitrogen, 1:200, Cat#A-11055), Alexa594 Donkey anti-goat IgG (Invitrogen, 1:200, Cat#A-11058). For Fos and pS6 staining following leptin treatment, leptin (5 mg/kg) was intraperitoneally (i.p.) injected in STZ-treated mice, and mice were perfused 3 h later. For pSTAT3 staining, mice were fasted overnight for 24 h, followed by 5 mg/kg i.p. leptin injection45. 45 min later, mice were perfused and brains were dissected out. Following PBS washes (3×10 min), brain slices were pre-treated with 1% NaOH for 15 min as previously described. Brain sections were mounted onto SuperFrost (Fisher Scientific Cat No. 22-034-980) slides and then visualized with Leica TCS SPE Confocal Microscopy (Leica Microsystems) using 10X, 20X oil immersion, or 63X oil immersion, or Olympus VS120 Virtual Slide Microscope (Olympus) for whole-brain scanning. Images were imported to ImageJ or Fiji (NIH) software for further analysis.
RNA In Situ Hybridization (ISH)
RNA ISH was performed by using RNAscope 2.5 HD Assay- Brown kit (acdbio, #322300). Briefly, mice were transcardially perfused with 4% paraformaldehyde (PFA) and the brains were post-fixed for 1–2 days. Brains samples were sectioned coronally at 15 μm using a Thermo Scientific cryostat microtome (Thermo Scientific HM 525) and mounted on SuperFrost Plus slides (Fisher Scientific #12-550-15). Slides were washed for 5 min with PBS and treated with hydrogen peroxide for 10 min. After washed in distilled water, slides were submerged into boiling 1x retrieval solution for 5 min and washed with distilled water. A hydrophobic barrier was then created and the probe against Lepr mRNA (Advanced Cell Diagnostics, Mm-Lepr, #402731) was added on slides. After 2 hours incubation at 40°C, Hybridize-Amp probes #1-6 were applied on slides sequentially to amplify signals. Finally, DAB was added on slides to visualize signals and Olympus VS120 Virtual Slide Microscope (Olympus) was used for whole-brain scanning.
Food intake, body weight, and body composition analysis
Food intake, body weight and body composition studies were performed as previously described44. For daily food intake assays, food pellets were weighed at 10 a.m. of each day for 4 continuous days and an average of 3-day food intake was calculated. Light cycle food intake was measured from 7 a.m. to 7 p.m. and dark cycle food intake was from 7 p.m. to 7 a.m.. For virus-transduced knockout experiments, animals were singly housed for 1-week after surgery and allowed for 2 weeks to express sufficient AAV-expressed transgene. Body weight and food intake were measured weekly including the week before surgery. For inhibitory hM4Di-related studies, mice were singly housed and food pellets were weighed before and after CNO i.p. injection (0.3 mg/kg) during light cycle (10 a.m. to 2 p.m.) or dark cycle (8 p.m. to 12 a.m.). For studies in NOD mice, body weight and food intake were measured from 3 months of age, a time before the majority of diabetes develops37. For Leprdb/db mice, food intake and body weight were tracked from 4 weeks of age. Body fat mass was measured using echoMRI analysis, and oxygen consumption was measured using metabolic chambers of a Comprehensive Lab Animal Monitoring system (CLAMS, Columbus Instruments, Columbus, OH) from the Adipose Tissue Biology and Nutrient Metabolism Core at the Boston Nutrition and Obesity Research Center (BNORC). Mice were acclimatized in the chambers for 48 h prior to data collection. Mice with ‘missed’ injections or incomplete ‘hits’ were excluded from analysis after post hoc examination of mCherry or GFP expression. In this way, all measurements were randomized and blind to the experimenter.
Blood glucose, glucose and insulin tolerance test
Blood glucose concentrations were measured using a blood glucose meter and glucose test strips (OneTouch Ultra). For virus-induced knockout experiments, blood glucose was measured weekly following surgery. For inhibitory DREADDs studies, food pellets were removed 2 h prior to CNO injection. Blood glucose was measured at 0, 1, 2, 4, and 6 h following CNO treatment without food presence. For glucose tolerance test (GTT), Mice were fasted for 24 h overnight. After the fasting period, mice received a 20% glucose i.p. injection (1g/kg) and blood glucose levels were measured at 0, 15, 30, 60, and 120 min time points post glucose injection. For insulin tolerance test (ITT), mice were fasted for 4 h and basal blood glucose levels were measured at 0, 15, 30, 60, and 120 min time points following. i.p. injection of insulin (0.75U/kg) and blood glucose levels were measured.
STZ treatment
Streptozotocin (STZ) (Sigma-Aldrich Cat#S0130) was i.p. injected in C57BL/6 mice at varying doses from 75 to 150 mg/kg. 125 mg/kg STZ injection was the chosen dosage for all experiments to induce gradual onset of hyperglycemia and characteristic diabetic symptoms. Health conditions were closely monitored twice a day following STZ injection for two days. Three days after injection, blood glucose was measured to assess the extent of STZ-induced diabetes. Other metabolic studies included body weight, food intake, micturition analysis, serum insulin, and serum leptin levels.
Leptin effects on body weight and food intake
A protocol similar to that previously described was used to assess leptin’s effects on body weight and food intake45. Briefly, mice (6–7 weeks old) were individually housed and acclimated by handling for one week. These mice were then i.p. administered with saline (0.9% NaCl) or leptin (2 mg/kg/injection, 7 a.m. and 7 p.m.) every 12 h for 3 days. Body weight and food intake were measured at baseline and on each day on which saline injections or leptin injections were administered. Body weight and food intake were averaged during the 3 days prior to injections to obtain the baseline values used for calculating percent changes. To assess leptin’s ability to acutely suppress hunger-induced appetite, mice were singly housed and fasted for 24 h. On the second day, a high dose of leptin (5 mg/kg) was injected i.p in mice at 7 a.m. and pre-weighed food was placed back in the cage and monitored in the following 24 h.
Osmotic pump
Intracerebroventricular (i.c.v.) cannula minipump implantation was performed as previously described46. Briefly, a cannula was implanted into the cerebral lateral ventricle (AP: −0.50 mm, ML: ±1.3 mm, DV: −2.3 mm), and a mini-osmotic pump (model 1007D; Alzet) was implanted subcutaneously via a catheter connected to the cannula for icv infusion. The mini-osmotic pump was filled with either leptin (454 ng/μl) or sterile saline solution. Food intake, body weight, and glucose were measured on days 1, 3, 5, and 7 post-surgery.
Serum leptin and insulin measurement
Tail vein blood was collected for ELISA assays as previously described46. Briefly, 20~50 μl tail vein blood was collected in mice that were food restricted for 2 h prior to blood collection procedure. Blood was collected with heparinized capillary tubes (Fisher Scientific, Cat#22-260-950) and then centrifuged at 3,000 x g for 20 min to collect serum and stored at −80°C. For insulin levels, Ultra Sensitive Mouse Insulin ELISA Kit (Crystal Chem #90080) was used. For leptin levels, Mouse Leptin ELISA Kit (Crystal Chem #90030) was used.
Quantitative PCR assay
Brains were dissected and preserved in RNAlater solution (ThermoFisher Scientific AM7020). Total RNA was extracted using TRIzol Reagent (ThermoFisher Scientific #15596-018) and reverse transcribed using AffinityScript QPCR cDNA Synthesis Kit (Agilent Technologies #600559). Taqman probes used for qPCR include those for Agrp (Mm00475829_g1, TaqMan Gene Expression Assays, Applied Biosystems), Npy (Mm00445771_m1, TaqMan Gene Expression Assays, Applied Biosystems), and Pomc (Mm01323842_m1, TaqMan Gene Expression Assays, Applied Biosystems), Lepr (Mm00440181_m1, TaqMan Gene Expression Assays, Applied Biosystems). Expression of the genes was normalized to that of 18S ribosomal RNA (Applied Biosystems #4319413E). qPCR was performed on a StepOnePlus Real-Time PCR System (Applied Biosystems).
Behavioral assays and video analysis
Mice were placed in a 25 × 40 × 20 cm arena to assess feeding duration and 1-h food intake during the light phase (10–11 a.m.). Food and nest zone areas were designated in the opposite ends of the arena. A food bowl was placed containing standard chow diet. The spatial locations were tracked and analyzed using EthoVision XT 10 software (Noldus) and CCD cameras (Motic).
Thermal imaging of BAT activity
Thermal imaging was performed using a calibrated thermal imaging camera attachment (FLIR One). Mice were anesthetized and the fur on their back covering the interscapular brown adipose tissue (iBAT) area was shaved. After a 1-week recovery and acclimation period, freely moving mice were thermally imaged and their subcutaneous iBAT temperatures were calculated accordingly. Thermal signals from flank area were used as control.
Cell culture and Indel analysis
Neuro-2a (N2a) cells (ATCC® CCL131™) were cultured in Dulbecco’s modified Eagle’s medium (Sigma-Aldrich, Cat# D8437) supplemented with 10% Fetal Bovine Serum (Thermo Fisher, Cat# 16000044), 500 ug/ml penicillin-streptomycin-Glutamine (Thermo Fisher, Cat# 10378016) at 37°C with 5% CO2. Cells were routinely tested for mycoplasma using PCR detection kit (ATCC® 30-1012K™) Indel analysis was performed with the GeneArt Genomic Cleavage Detection Kit (Thermo Fisher, Cat# A24372). Briefly, the U6-sgLepR cassette was cloned into the pCas9-GFP backbone (Addgene, Cat# 44719) following MluI (New England Biolabs, Cat# R3198S) digestion. Cells were transfected with Lipofectamine™ 3000 (Thermo Fisher, Cat#L3000008) and fluorescent GFP was used to assess the transfection efficiency after 48 hours. Genomic DNA was extracted and PCR amplification was performed by using the following primers, Lepr on-target primer fwr: cttctctggaaggtagacgctc; rev: gaccttgctcattcccaaag. Gpr108 off-target fwr: tgagagtcagccggtggata; rev: atgcttcgttgcacggatct. PCR products were digested with Detection Enzyme and analyzed with DNA gel electrophoresis. Cleavage efficiency was calculated as: Cleavage Efficiency= 1− [(1− fraction cleaved)1/2]. Fraction Cleaved= sum of cleaved band intensities/(sum of the cleaved and parental band intensities).
Data analysis
Offline data analysis for electrophysiology was performed using custom scripts in Igor Pro 6 (Wavemetrics) and MATLAB (MathWorks). Statistical analyses were performed using GraphPad PRISM 6 software (GraphPad). Imaging data analyses were performed with ImageJ (NIH). For imaging results of Fos staining, ImageJ was used to convert original fluorescent images following a 3-step method (“Grays” → “Invert LUT” → “Merge channels”). All values are reported as mean ± s.e.m.
Data availability
The original and/or analysed data sets generated during the current study, and the codes used to analyse them, are available from the corresponding author upon reasonable request.
Extended Data
Extended Data Figure 1. Characterization of streptozotocin (STZ)-induced diabetic mice; Additional analysis of alterations in neuronal activity in STZ-treated animals and following leptin administration; Similar activation of neurons in the ARC was also observed in NOD diabetic mice.
a, Development of hyperglycemia in C57BL/6 mice after one-time i.p. administration of STZ at different doses from 75 mg/kg to 150 mg/kg (n=4 mice per group). 125 mg/kg was chosen for all of the following STZ-related experiments described in the current study. b, Experimental procedures. c–g, Serum insulin levels (c), body weight (d), daily water intake (e), representative cages in which a saline- and a STZ-treated mouse were housed, respectively (f), and serum leptin levels (g) after 1 week post STZ-injection (n=14 mice per group), suggesting that 125 mg/kg STZ-treatment effectively induces insulin-deficiency and diabetes, as well as emaciation, polydipsia, polyuria, and, importantly, leptin-deficiency. h, Representative sections of Fos immunostaining in the hypothalamus of saline- or STZ-treated mice. ARC, arcuate nucleus; DMH, dorsomedial hypothalamus; LH, lateral hypothalamus; 3V, 3rd ventricle. i, j, Representative sections and quantification of phosphorylated ribosomal protein S6 (Ser235/236, pS6) immunostaining in the mediobasal hypothalamus of saline- or STZ-treated mice 3 hours after the administration of saline/leptin (n=3 mice per group). k, l, Comparison of Fos expression in the mediobasal hypothalamus of STZ-treated mice following 3-hour or 24-hour leptin treatment (n=3 per group). m, Schematic diagram of the development of non-obese diabetic (NOD) mouse model. n–r, Body weight (n), daily food intake (o), ad libitum fed blood glucose levels (p), and representative sections (q) and quantification (r) of Fos immunostaining in the ARC of non-diabetic or diabetic NOD littermates (n=4 mice per group). Data are mean ± s.e.m. and representative of three independent experiments; *P<0.05, **P<0.01, ****P<0.0001; Student’s two-tailed, unpaired t-test (c–e, g, j, n, o, p, r) or two-way ANOVA analysis (l).
Extended Data Figure 2. Characterization of feeding behaviors in STZ-treated diabetic mice; Additional analyses of ectopic activation of AgRP neurons and its pathologic contributions to STZ-induced hyperphagia and hyperglycemia.
a, Quantitative PCR results showing that Agrp and Npy mRNA levels are significantly upregulated in the mediobasal hypothalamus of STZ-treated animals, which is consistent with increased AgRP neuronal activity following STZ-injection (n=5 mice per group). b–f, Food intake during light cycle (7 a.m. to 7 p.m.) (b) and dark cycle (7 p.m. to 7 a.m.) (c), representative 1-hour heat map (10 to 11 a.m.) showing percent occupancy time in food zone (upper right corner) and nesting zone (lower right corner) (d), feeding duration (e), and 1-hour food intake (f) in saline- or STZ-treated C57BL/6 mice (n=8 mice per group). g, h, Representative sections and quantification of hrGFP immunostaining in the ARC of saline- or STZ-treated Npy-hrGFP transgenic mice, suggesting that STZ-treatment does not induce obvious cell loss of AgRP neurons (n=3 mice per group). i, Representative sections and quantification of hrGFP::pS6 co-immunostaining in the ARC of saline- or STZ-treated Npy-hrGFP transgenic mice (n=4 mice per group). j, Schematic diagram of chemogenetic inhibition of AgRP neurons in virus-transduced Agrp-IRES-Cre mice. k, 4-hour food intake measurement during dark cycle (8 p.m.–12 a.m.) following the administration of saline or CNO (n=6 mice per group). l, m, 4-hour food intake assay (10 a.m.–2 p.m.) (l) and blood glucose measurement (m, without food in the cage) in female Agrp-IRES-Cre littermates after AAV pSyn-FLEX-hM4Di-mCherry virus injection into the ARC and upon saline/CNO treatment (n=8 mice per group). n–q, Schematic diagram of experiments to assess CNO’s effects with Cre-dependent AAV-FLEX-mCherry virus injected to into the ARC of Agrp-IRES-Cre mice (n). Representative brain sections (o) and quantification (p, n=3 mice per group) of mCherry::Fos co-immunostaining, and food intake assay (q, 10 a.m. to 2 p.m., n=8 mice per group) in STZ-treated mice following the i.p. injection of saline/CNO, demonstrating that CNO administration without the expression of hM4Di in AgRP neurons induces null effects and the changes observed in Figure 1g–i are caused by the chemogenetic inhibition of AgRP neurons. Data are mean ± s.e.m. and representative of three independent experiments; *P<0.05, **P<0.01, ***P<0.001, ****P<0.0001; Student’s two-tailed, unpaired t-test (a–c, e, f, h, p), paired t-test (m) or two-way ANOVA analysis (l, q) with Šidák post hoc test (k).
Extended Data Figure 3. Additional information and analyses for CRISPR-mediated disruption of leptin receptors (LepRs) in AgRP neurons.
a, sgRNA design for targeting the mouse Lepr genomic locus. b–h, Schematic diagram of AAV pU6-sgRNALepr::pEF1α-FLEX-mCherry (AAV-sgLepR) injected unilaterally into the ARC of Agrp-IRES-Cre::LSL-Cas9-GFP mice (b), representative images (c) and quantification (d) of mCherry and leptin-induced phosphorylated STAT3 (Tyr705, pSTAT3) co-immunostaining in the hypothalamus, cell counting of GFP+ cells from the ARC suggesting that deletion of Lepr in AgRP neurons does not induce cell death (e), representative images of mCherry immunostaining (left) and RNA-ISH against Lepr mRNA (right) indicating efficient deletion of Lepr (f), representative images (g) and quantification (h) of mCherry::Fos co-immunostaining in the ARC of ad libitum fed animals indicating disinhibition of AgRP neurons (n=3 mice per group). i, j, Schematic diagram of AAV pU6-sgRNALepr::pEF1α-FLEX-mCherry (AAV-sgLepR) injected bilaterally into the ARC of Agrp-IRES-Cre::LSL-Cas9-GFP or Agrp-IRES-Cre mice (i), quantitative PCR results of Lepr, Agrp, Npy, and Pomc mRNA expression in the ventromedial hypothalamus of fed mice (j, n=4 mice per group). k, Serum insulin levels in ad libitum fed Agrp-IRES-Cre (Cas9−) and Agrp-IRES-Cre::LSL-Cas9-GFP mice (Cas9+) bilaterally injected with AAV-sgLepR virus (n=4 mice per group). l, CRISPR-mediated deletion of Lepr in AgRP neurons also induces severe obesity in female mice (n=6 mice per group). m, Representative near-infrared thermal images and quantification of interscapular brown adipose tissue (iBAT) temperature in virus-transduced, ad libitum fed Agrp-IRES-Cre (Cas9−) and Agrp-IRES-Cre::LSL-Cas9-GFP male littermates (Cas9+). n, Schematic diagram of assay design to compare mice with global Lepr mutations and mice with specific deletion of Lepr in AgRP neurons. o, p, weekly blood glucose measurement and daily food intake at 8 weeks of age of ad libitum fed, virus-transduced Leprdb/+ (db/+), Leprdb/db (db/db), AgRP-IRES-Cre (Cas9−), and AgRP-IRES-Cre::LSL-Cas9-GFP (Cas9+) mice (n=9 mice per group). q-s, Schematic diagram of experiment (q), changes in body weight (r), and daily food intake (s) (5 days post pump surgery) in STZ-treated, virus-transduced Agrp-IRES-Cre (Cas9−) and Agrp-IRES-Cre::LSL-Cas9-GFP (Cas9+) mice following chronic administration of saline/leptin with osmotic pump (n=6 mice per group). t–v, Schematic diagram of experiment (t), changes of body weight (u) and daily food intake (v) in non-STZ treated, virus-transduced Agrp-IRES-Cre (Cas9−) and Agrp-IRES-Cre::LSL-Cas9-GFP (Cas9+) mice following 3-day leptin i.p. injection (n=7 mice per group). Data are mean ± s.e.m. and representative of three independent experiments; *P<0.05, **P<0.01, ***P<0.001, ****P<0.0001; Student’s two-tailed, unpaired t-test (d, e, h, j, k, m, o, s) or two-way ANOVA analysis (l, p, u, v) with Šidák post hoc test (r).
Extended Data Figure 4. Analysis of off-target effects of CRISPR-mediated genome editing; Expression of CRISPR-immune leptin receptors in AgRP neurons occludes alterations in body weight, food intake, or blood glucose levels caused by CRISPR-mediated disruption of Lepr.
a, Diagram of the predicted off-target site of sgLepR on the first exon of Gpr108 locus. b, Diagram of plasmid expressing both sgLepR and Cas9-GFP proteins (upper panel), fluorescent imaging of GFP following transfection of the plasmid into mouse N2a cells (lower panel), and on-target as well as off-target indel detection results demonstrating that sgLepR effectively induces mutations in Lepr locus but not in Gpr108 locus (right panel). c, sgRNA targeting the mouse Lepr locus (upper panel) and of CRISPR-immune Lepr cDNA encoding the long-form leptin receptors (ciLepR, lower panel) with indicated silent mutations to prevent binding of sgRNA. d, Schematic diagram of Cre-dependent AAV pEF1α-FLEX-ciLepr (AAV-FLEX-ciLepR) injected unilaterally into the ARC of Agrp-IRES-Cre::Leprdb/db mice (left) and representative images of leptin-induced pSTAT3 (Tyr705) immunostaining (right), indicating that ciLepR is fully responsive to leptin stimulation. e–g, Body weight (e), food intake (f), and blood glucose (g) of Non-Cre and Agrp-IRES-Cre littermates following bilateral injection of AAV-FLEX-ciLepR into the ARC (n=8 mice per group), suggesting that AAV-mediated expression of ciLepR in AgRP neurons produces no obvious effects on energy or glucose balances. h–k, Diagram of experiment flow (h), body weight (i), daily food intake (j), and blood glucose measurements (k) in virus-transduced ad libitum fed littermates (n=8 mice per group). Since expression of ciLepR in AgRP neurons totally prevented body weight gain, increased food intake, and hyperglycemia induced by CRISPR-mediated deletion, potential contributions from off-site mutagenesis are excluded. Data are mean ± s.e.m. and representative of three independent experiments; **P<0.01, ***P<0.001; Student’s two-tailed, unpaired t-test (f, j) or two-way ANOVA analysis (e, g, i, k).
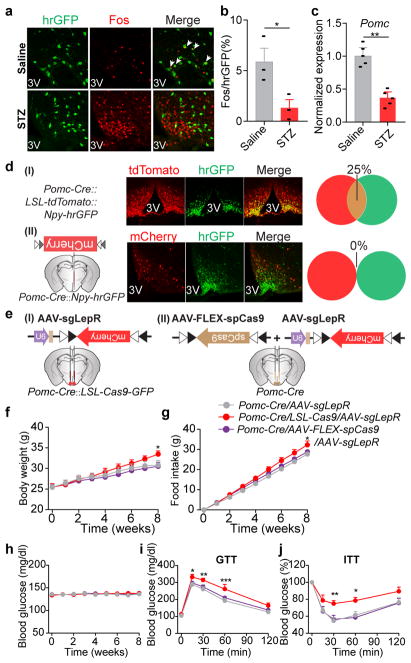
Extended Data Figure 5. CRISPR-mediated disruption of leptin receptors in the hypothalamic POMC neurons does not alter energy or blood glucose balances.
a, b, Representative sections and quantification of hrGFP::Fos co-immunostaining in the ARC of saline- or STZ-treated Pomc-hrGFP transgenic mice (n=3 mice per group). Reduced Fos expression in POMC neurons was observed following STZ treatment. c, Quantitative PCR results showing that Pomc mRNA levels are significantly reduced in the mediobasal hypothalamus of STZ-treated animals, which is consistent with inhibited POMC neuronal activities following STZ-injection (n=5 mice per group). d, Schematic diagrams, representative sections, and quantification of tdTomato::hrGFP co-immunostaining in the ARC of Pomc-Cre::LSL-tdTomato::Npy-hrGFP mice (I, upper panels) and of mCherry::hrGFP co-immunostaining in the ARC of Pomc-Cre::Npy-hrGFP mice with Cre-dependent AAV pEF1α-FLEX-mCherry injected into the ARC (II, lower panels). Considerable co-expression was observed in Pomc-Cre::LSL-tdTomato::Npy-hrGFP mice but not in virus-transduced Pomc-Cre::Npy-hrGFP mice, suggesting that Pomc-Cre ectopically express Cre activity in AgRP neurons during early developmental stage, consistent with prior findings. These data also demonstrate that Cre-dependent AAV injected into the ARC of Pomc-cre transgenic mice provides an efficient approach to specifically express gene-of-interest in POMCARC neurons, without perturbing intermingled AgRP neurons (n=3 mice per group). e, Schematic diagrams of two approaches to achieve CRISPR-mediated deletion of Lepr in POMCARC neurons. (I) AAV-sgLepR virus was bilaterally injected into the ARC of Pomc-Cre::LSL-Cas9-GFP mice. (II) A viral mix of AAV-sgLepR and Cre-dependent AAV pMeCP2-FLEX-spCas9 (AAV-FLEX-spCas9, see online methods for the details) was bilaterally injected into the ARC of Pomc-Cre mice. f–j, Body weight (f), accumulated weekly food intake (g), ad libitum fed state blood glucose levels (h), Glucose-tolerance test (i), and Insulin-tolerance test (j) of the virus-transduced animals (n=6 mice per group). Of note, mildly-increased body weight and food intake, as well as slightly-impaired glucose tolerance and insulin sensitivity, were observed only in single virus-transduced Pomc-Cre::LSL-Cas9-GFP mice, but not in dual virus-transduced Pomc-Cre mice. Since Cas9 protein is expected to express in some AgRP neurons in Pomc-Cre::LSL-Cas9-GFP animals, the difference observed between the two approaches was likely explained by the ectopic Cre-activity of Pomc-Cre in AgRP neurons. The phenotypes observed in Pomc-Cre::LSL-Cas9-GFP mice mimic those following genetic ablation of Lepr with conventional Cre-loxP system. Inactivation of LepR in POMC neurons of adult mice does not appear to affect energy balance or glucose homeostasis under the conditions assayed. Data are mean ± s.e.m. and representative of three independent experiments; *P<0.05, **P<0.01, ***P<0.001; Student’s two-tailed, unpaired t-test (b, c) or two-way ANOVA analysis with Šidák post hoc test (f–j).
Extended Data Figure 6. Additional information on experimental design related to CRISPR-mediated deletion of Kcnj11 in AgRP neurons; Expression of a CRISPR-immune Kir6.2 in AgRP neurons prevents alterations in body weight, food intake, or blood glucose following CRISPR-mediated deletion.
a, Representative images and quantification of mCherry::pSTAT3 co-immunostaining (n=4 mice per group) following CRISPR-mediated disruption of Kcnj11 in AgRP neurons. b, Schematic diagram of experiment flow to test leptin’s chronic effects in regulating body weight and food intake. c, Diagram of sgRNA design targeting the mouse Kcnj11 locus and of CRISPR-immune Kcnj11 cDNA encoding the mouse KATP channel subunit Kir6.2 (ciKATP) with indicated silent mutations to prevent binding of sgRNA. d, Schematic diagram of Cre-dependent AAV pEF1α-FLEX-ciKcnj11-IRES-mCherry (AAV-FLEX-ciKATP) injected unilaterally into the ARC of Agrp-IRES-Cre::Leprdb/db mice and representative image of mCherry immunostaining. e–h, Diagram of experiment flow (e), body weight (f), daily food intake (g), and blood glucose measurements (h) in virus-transduced ad libitum fed littermates (n=8 mice per group). Expression of ciKATP in AgRP neurons completely prevented body weight gain, increased food intake and hyperglycemia induced by CRISPR-mediated deletion, suggesting that contributions from off-site mutagenesis are excluded. i–k, Body weight (i), food intake (j), and blood glucose (k) of Non-Cre and Agrp-IRES-Cre littermates following bilateral injection of AAV-FLEX-ciKATP into the ARC (n=8 mice per group), suggesting that AAV-mediated expression of ciKATP in AgRP neurons produces no obvious effects on energy or glucose balances. Data are mean ± s.e.m. and representative of three independent experiments; ***P<0.001, ****P<0.0001; Student’s two-tailed, unpaired t-test (a, g, h, j) or two-way ANOVA analysis (f, i, k).
Extended Data Figure 7. Additional assays to characterize leptin’s inhibition of fasting-induced hunger; Fasting- and leptin-induced alterations in GABAergic neurotransmission on AgRP neurons; Experimental design to delete GABAA ionotropic receptors.
a, Assays to test leptin’s acute effects in suppressing 24-hour fasting-induced hunger in Agrp-IRES-Cre (Cas9−) and Agrp-IRES-Cre::LSL-Cas9-GFP (Cas9+) mice, following bilateral injection of AAV-sgKATP into the ARC. These data indicate that KATP channels in AgRP neurons are not required for leptin’s acute inhibition of hunger following fasting (n=6 mice per group). b, Representative traces of spontaneous inhibitory postsynaptic currents (sIPSCs) on AgRP neurons and quantification of their frequency and amplitude in ad libitum fed or 24-hour fasted Npy-hrGFP transgenic mice (n=10 cells from 3 mice per group). No difference was observed in sIPSC amplitude. c, Representative traces and quantification of sIPSCs on AgRP neurons before or 15 min post incubation with leptin in ad libitum fed Npy-hrGFP transgenic mice, suggesting that leptin does not further regulate GABAergic neurotransmission on AgRP neurons in fed animals (n=10 cells from 3 mice per group). d, Schematic illustration of the mouse GABAA receptor complex and the genes encoding its subunits. e, Genomic structures and design of sgRNAs targeting the mouse Gabrb1/2/3 loci encoding GABAA receptor β1-β3 subunits, respectively. Data are mean ± s.e.m. and representative of three independent experiments; **P<0.01, ***P<0.001, ****P<0.0001; Student’s two-tailed, unpaired t-test (a, b).
Extended Data Figure 8. Dynamic changes of neuronal activity and synaptic neurotransmission following CRISPR-mediated deletion of GABAA receptors in AgRP neurons.
a, b, Body weight measurement (a) and daily food intake (b) of Agrp-IRES-Cre (Cas9−) and Agrp-IRES-Cre::LSL-Cas9-GFP (Cas9+) mice following bilateral injection of AAV-sgGABAA-R into the ARC (n=7 mice per group). c–f, Representative sections and quantification of mCherry::Fos co-immunostaining (c, n=3 mice per group), representative traces and quantification of spontaneous excitatory postsynaptic currents (sEPSCs) (d, n=15 neurons from 3 mice, e, n=8 neurons from 2 mice) in AgRP neurons of Agrp-IRES-Cre::LSL-Cas9-GFP mice after 1-week or 4-week unilateral injection of AAV-sgGABAA-R into the ARC. Reduced frequency and amplitude of sEPSCs were observed in AgRP neurons in a later stage following GABAA-R deletion, together with concurrent elimination of the observed disinhibition of these neurons (c), body weight gain (a), and hyperphagia (b), suggesting that excitatory and inhibitory afferents dynamically cooperate to modulate AgRP neuronal activities. In addition, the compensatory reduction in sEPSCs in virus-transduced neurons but not in the neurons from the contralateral side also indicate a cell-autonomous mechanism. Data are mean ± s.e.m. and representative of three independent experiments; **P<0.01, ****P<0.0001; Student’s two-tailed, unpaired t-test (b, d, e) or two-way ANOVA analysis with Šidák post hoc test (a).
Extended Data Figure 9. Additional assays to characterize leptin regulation of energy balance and GABAergic neurotransmission on AgRP neurons following CRISPR-mediated deletion or expression of CRISPR-immune GABAA receptors.
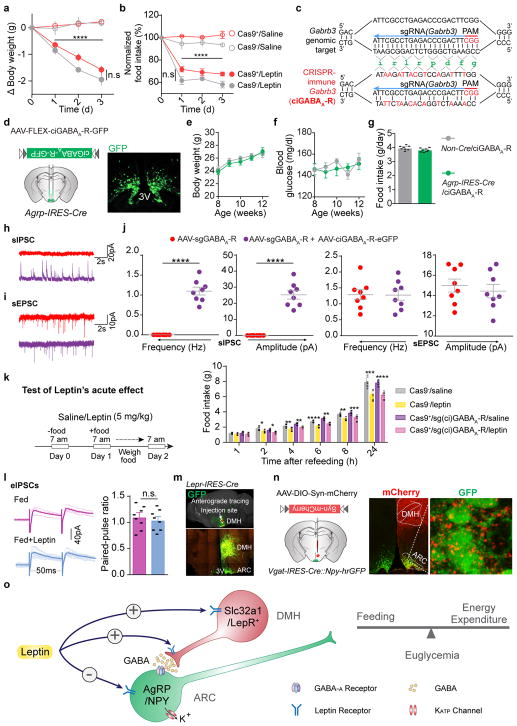
a, b, Body weight and daily food intake changes during 3-day consecutive treatment with saline or leptin in Agrp-IRES-Cre (Cas9−) and Agrp-IRES-Cre::LSL-Cas9-GFP (Cas9+) mice following bilateral injection of AAV-sgGABAA-R into the ARC (n=7 mice per group), suggesting that GABAergic neurotransmission on AgRP neurons is not required for leptin’s chronic effects on regulation of body weight or food intake. c, Diagrams of sgRNA design targeting the mouse Gabrb3 locus and of CRISPR-immune Gabrb3 cDNA encoding the mouse β3 subunit of GABAA receptors (ciGABAA-R) with indicated silent mutations to prevent binding of sgRNA. d, Schematic diagram of Cre-dependent AAV pEF1α-FLEX-ciGABAA-R-GFP (AAV-FLEX-ciGABAA-R) and representative image of GFP immunostaining following bilateral injection of the virus into the ARC of Agrp-IRES-Cre mice. e–g, Body weight (e), food intake (f), and blood glucose (g) of Non-Cre and Agrp-IRES-Cre littermates following bilateral injection of AAV-FLEX-ciGABAA-R into the ARC (n=8 mice per group), suggesting that AAV-mediated expression of ciGABAA-R in AgRP neurons produces no obvious effects on energy or glucose balances. h–j, Representative traces and quantification of sIPSCs and sEPSCs of AgRP neurons in Agrp-IRES-Cre::LSL-Cas9-GFP mice, following bilateral injection of AAV-sgGABAA-R (red) or a mix of AAV-sgGABAA-R and AAV-FLEX-ciGABAA-R (purple) into the ARC (n=8 neurons from 3 mice per group). k, Assays to test leptin’s acute effects in suppressing 24-hour fasting-induced hunger in Agrp-IRES-Cre (Cas9−) and Agrp-IRES-Cre::LSL-Cas9-GFP (Cas9+) mice, following bilateral injection of a mix of AAV-sgGABAA-R and AAV-FLEX-ciGABAA-R into the ARC. These data indicate that expression of CRISPR-immune β3 subunit of GABAA receptor in AgRP neurons following GABAA-R β1/2/3 deletion retains leptin’s acute inhibition of hunger following fasting (n=7 mice per group). Functional contributions from CRISPR-mediated off-site mutagenesis of the triple deletion can thus be excluded. l, Representative traces (left) and quantification (right) of electrically-evoked IPSC (eIPSC) paired-pulse ratios in AgRP neurons of ad libitum fed Npy-hrGFP mice before or after leptin incubation (n=8 neurons from 3 mice per group). m, Representative anterograde tracing image (Image from Allen Institute, experiment #113314337-DMH) showing intensive GFP-labeled projections in the ARC following unilateral viral injections in DMH of Lepr-IRES-Cre mice. n, Schematic diagram of Cre-dependent AAV pEF1α-FLEX-synaptophysin-mCherry unilaterally injected into the ventral DMH (vDMH) of Vgat-IRES-Cre::Npy-hrGFP mice (left) and mCherry::hrGFP co-immunostaining (middle) to anterograde trace the projections of vDMH GABAergic neurons (vGATvDMH neurons). vGATvDMH neurons predominantly project to the ARC and their axon terminal puncta are intensively stained on the soma of AgRP neurons (right). o, Schematic representation to summarize leptin action on AgRP neurons and on GABAergic neurons in the DMH. Data are mean ± s.e.m. and representative of three independent experiments; *P<0.05, **P<0.01, ***P<0.001, ****P<0.0001; Student’s two-tailed, unpaired t-test (g, j, k, l) or two-way ANOVA analysis (a, b, e, f).
Extended Data Table 1.
Summary of Fos expression in saline- or STZ-treated C57BL/6 mice.
| Saline | STZ | ||
|---|---|---|---|
| Cortex | Frontal association cortex | + | − |
| Dorsal peduncular cortex | + | − | |
| Infralimbic cortex | + | +++ | |
| Prelimbic cortex | + | ++++ | |
| Cingulate cortex | ++ | +++ | |
| Orbital cortex, lateral | ++ | +++ | |
| Orbital cortex, ventral/medial | ++ | ++++ | |
| Orbital cortex, dorsal | + | +++ | |
| Motor cortex, primary | ++ | ++ | |
| Motor cortex, secondary | ++ | ++ | |
| Agranular insular cortex | ++ | + | |
| Dysgranular/granular insular cortex | + | + | |
| Somatosensory cortex | ++ | ++ | |
| Auditory cortex | + | ++ | |
| Visual cortex | ++ | ++++ | |
| Entorhinal cortex | + | ++ | |
| Retrosplenial cortex | ++ | + | |
| Perirhinal cortex | + | + | |
| Ectorhinal cortex | + | + | |
| Parietal cortex | ++ | +++ | |
| Olfactory bulb | +++ | +++++ | |
| Olfactory areas | Anterior olfactory nucleus | ++ | ++++ |
| Piriform cortex | +++ | +++++ | |
| Tenia tecta | − | + | |
| Hippocampus/Septum | Hippocampus (CA1, CA2, CA3) | + | ++++ |
| Dorsal Subiculum | − | − | |
| Hippocampus (dentate gyrus) | + | + | |
| Septum | − | − | |
| Diagonal band of Broca | ++ | ++ | |
| Claustrum/endopiriform | Claustrum | ++ | − |
| Endopiriform nucleus | + | − | |
| Olfactory tubercle | ++ | − | |
| Striatum | N.Accumbens, Shell & Core | − | − |
| Dorsal striatum | − | − | |
| Pallidum | Ventral pallidum Globus pallidus | + | − |
| Entopeduncular nucleus | − | − | |
| IPAC | + | + | |
| BNST | + | − | |
| Sublenticular extended amygdala | − | − | |
| Amygdala | Central nucleus | − | +++ |
| Anterior amygdaloid area | − | − | |
| Medial nucleus | − | − | |
| Cortical amygdaloid transition zone | − | − | |
| Basolateral nucleus | ++ | +++ | |
| Basomedial nucleus | + | + | |
| Hypothalamus | Median preoptic area | + | +++++ |
| Medial preoptic area | + | ++++ | |
| Lateral preoptic area | + | +++ | |
| Suprachiasmatic nucleus | ++ | +++++ | |
| Arcuate nucleus | + | +++++ | |
| Magnocellular preoptic area | − | +++ | |
| Anterior hypothalamic area | + | +++ | |
| Paraventricular hypothalamic nucleus | + | +++++ | |
| Ventromedial hypothalamic nucleus | ++ | + | |
| Lateral hypothalamic area | + | +++ | |
| Posterior hypothalamic area | ++ | +++ | |
| Dorsal hypothalamic area | + | ++++ | |
| Tuber cinereum area | − | +++ | |
| Perifornical nucleus | − | ++ | |
| Mammillary nucleus | − | + | |
| Premammillary nucleus | + | ++ | |
| Supramammillary nucleus | + | +++ | |
| Subthalamic nucleus | + | +++ | |
| Zona incerta | − | − | |
| Supraoptic nucleus | + | +++++ | |
| Field of Forel, Prerubral field | − | − | |
| Retrochiasmatic nucleus | + | + | |
| Thalamus/Epithalamus | Lateral habenula | − | ++ |
| Medial habenula | − | − | |
| Parafascicular thalamic nucleus | − | + | |
| Paraventricular thalamic nucleus | +++ | ++++ | |
| Lateral geniculate nucleus | + | ++ | |
| Medial genicuulate nucleus | + | ++ | |
| Mediodorsal thalamic nucleus | − | − | |
| Central medial thalamic nucleus | − | + | |
| Ventromedial thalamic nucleus | − | ++ | |
| Dorsolateral thalamic nucleus | − | − | |
| Olivary pretectal nucleus | − | ++ | |
| Midbrain | Nucleus of posterior commissure | − | + |
| Nucleus of the optic tract | − | + | |
| Anterior pretectal nucleus | − | − | |
| Interpeduncular nucleus | − | + | |
| Substantia nigra pars reticulata | − | − | |
| Substantia nigra pars compacta | − | − | |
| Ventral tegmental area | − | + | |
| Retrorubral field | − | − | |
| Reticular formation | + | + | |
| Periaqueductal gray | + | ++ | |
| Superior coliculus | + | + | |
| Inferior coliculus | ++ | ++ | |
| Red nucleus | − | − | |
| Anterotegmental nucleus | − | − | |
| Median raphe nucleus | − | − | |
| Dorsal raphe nucleus | − | − | |
| Pontine reticular nucleus | − | − | |
| Pedunculopontine tegmental nucleus | − | − | |
| Laterodorsal tegmental nucleus | − | − | |
| Subpeduncular tegmental nucleus | − | − | |
| Retrorubral nucleus | − | − | |
| Cuneiform nucleus | − | − | |
| Parageminal nucleus | − | − | |
| Dorsal tegmental nucleus | − | − | |
| Pontine raphe nucleus | − | − | |
| Locus coeruleus | + | ++++ | |
| Hindbrain | Superior olive | − | − |
| Parabrachial nucleus | + | ++ | |
| Raphe magnus nucleus | − | − | |
| Raphe pallidus nucleus | − | ++ | |
| Solitary nucleus | − | ++ | |
| Paragigantocellular reticular nucleus | − | ++ |
Supplementary Material
Acknowledgments
We thank all members of the Kong lab for helpful discussion and comments on manuscript; Dr. Feng Zhang for providing pX330 plasmid and Rosa26-LSL-Cas9-GFP mice; Tufts CNR for confocal imaging service (supported by NIH/NINDS P30 NS047243); Boston Children’s Hospital Viral Core for AAV virus packaging (supported by NIH/NEI P30 EY012196-17); the Adipose Tissue Biology and Nutrient Metabolism Core and Dr. Andrew Greenberg for help with body mass and oxygen consumption measurement (supported by NIH/NIDDK P30 DK046200-26); BIDMC-FNL and Dr. George Blackburn for equipment support; and Drs. Philip Haydon and Maribel Rios for reading the manuscript. This research is supported by the following grants: to C.B., NINDS T32NS061764-09; to C.H.C., AHA-Postdoctoral Fellowship 17POST33661185; to D.K., NIH/NIDDK K01 DK094943, R01 DK108797, NINDS R21 NS097922, BNORC Transgenic core, BNORC P&F grant, and BNORC small grant program (NIDDK P30 DK046200), and Charles Hood Foundation Award.
Footnotes
The authors declare no competing financial interests. Readers are welcome to comment on the online version of the paper.
Supplementary Information is available in the online version of the paper.
Author Contributions J.X., C.L.B., and D.K. designed the experiments, analyzed data, and wrote the manuscript. J.X and C.L.B. performed the experiments with help of C.S.L., X.Y., C.H.C., and P.W.. J.X. constructed AAV vectors. J.X. and C.H.C. performed electrophysiology. C.L.B. and C.S.L. performed STZ-related studies. J.X., C.L.B., and X.Y. performed surgeries. C.L.B. and P.W. performed ciLepr re-expression study. D.K. conceived and supervised the project.
References
- 1.Friedman J. 20 years of leptin: leptin at 20: an overview. Journal of endocrinology. 2014;223:T1–T8. doi: 10.1530/JOE-14-0405. [DOI] [PubMed] [Google Scholar]
- 2.Flak JN, Myers MG., Jr Minireview: CNS mechanisms of leptin action. Molecular Endocrinology. 2016;30:3–12. doi: 10.1210/me.2015-1232. [DOI] [PMC free article] [PubMed] [Google Scholar]
- 3.Chen H, et al. Evidence that the diabetes gene encodes the leptin receptor: identification of a mutation in the leptin receptor gene in db/db mice. Cell. 1996;84:491–495. doi: 10.1016/s0092-8674(00)81294-5. [DOI] [PubMed] [Google Scholar]
- 4.Zhang Y, et al. Positional cloning of the mouse obese gene and its human homologue. Nature. 1994;372:425–432. doi: 10.1038/372425a0. [DOI] [PubMed] [Google Scholar]
- 5.Farooqi IS, et al. Beneficial effects of leptin on obesity, T cell hyporesponsiveness, and neuroendocrine/metabolic dysfunction of human congenital leptin deficiency. The Journal of clinical investigation. 2002;110:1093. doi: 10.1172/JCI15693. [DOI] [PMC free article] [PubMed] [Google Scholar]
- 6.Morton GJ, Schwartz MW. Leptin and the central nervous system control of glucose metabolism. Physiological reviews. 2011;91:389–411. doi: 10.1152/physrev.00007.2010. [DOI] [PMC free article] [PubMed] [Google Scholar]
- 7.Kelesidis T, Kelesidis I, Chou S, Mantzoros CS. Narrative review: the role of leptin in human physiology: emerging clinical applications. Annals of internal medicine. 2010;152:93–100. doi: 10.1059/0003-4819-152-2-201001190-00008. [DOI] [PMC free article] [PubMed] [Google Scholar]
- 8.Balthasar N, et al. Leptin receptor signaling in POMC neurons is required for normal body weight homeostasis. Neuron. 2004;42:983–991. doi: 10.1016/j.neuron.2004.06.004. [DOI] [PubMed] [Google Scholar]
- 9.Van De Wall E, et al. Collective and individual functions of leptin receptor modulated neurons controlling metabolism and ingestion. Endocrinology. 2008;149:1773–1785. doi: 10.1210/en.2007-1132. [DOI] [PMC free article] [PubMed] [Google Scholar]
- 10.Vong L, et al. Leptin action on GABAergic neurons prevents obesity and reduces inhibitory tone to POMC neurons. Neuron. 2011;71:142–154. doi: 10.1016/j.neuron.2011.05.028. [DOI] [PMC free article] [PubMed] [Google Scholar]
- 11.Fujikawa T, Chuang JC, Sakata I, Ramadori G, Coppari R. Leptin therapy improves insulin-deficient type 1 diabetes by CNS-dependent mechanisms in mice. Proceedings of the National Academy of Sciences. 2010;107:17391–17396. doi: 10.1073/pnas.1008025107. [DOI] [PMC free article] [PubMed] [Google Scholar]
- 12.Perry RJ, et al. Leptin reverses diabetes by suppression of the hypothalamic-pituitary-adrenal axis. Nature medicine. 2014;20:759–763. doi: 10.1038/nm.3579. [DOI] [PMC free article] [PubMed] [Google Scholar]
- 13.Knight ZA, et al. Molecular profiling of activated neurons by phosphorylated ribosome capture. Cell. 2012;151:1126–1137. doi: 10.1016/j.cell.2012.10.039. [DOI] [PMC free article] [PubMed] [Google Scholar]
- 14.Delovitch TL, Singh B. The nonobese diabetic mouse as a model of autoimmune diabetes: immune dysregulation gets the NOD. Immunity. 1997;7:727–738. doi: 10.1016/s1074-7613(00)80392-1. [DOI] [PubMed] [Google Scholar]
- 15.Könner AC, et al. Insulin action in AgRP-expressing neurons is required for suppression of hepatic glucose production. Cell metabolism. 2007;5:438–449. doi: 10.1016/j.cmet.2007.05.004. [DOI] [PubMed] [Google Scholar]
- 16.van den Top M, Lee K, Whyment AD, Blanks AM, Spanswick D. Orexigen-sensitive NPY/AgRP pacemaker neurons in the hypothalamic arcuate nucleus. Nature neuroscience. 2004;7:493–494. doi: 10.1038/nn1226. [DOI] [PubMed] [Google Scholar]
- 17.Cowley MA, Smart JL, Rubinstein M, Cerdán MG. Leptin activates anorexigenic POMC neurons through a neural network in the arcuate nucleus. Nature. 2001;411:480. doi: 10.1038/35078085. [DOI] [PubMed] [Google Scholar]
- 18.Aponte Y, Atasoy D, Sternson SM. AGRP neurons are sufficient to orchestrate feeding behavior rapidly and without training. Nature neuroscience. 2011;14:351–355. doi: 10.1038/nn.2739. [DOI] [PMC free article] [PubMed] [Google Scholar]
- 19.Krashes MJ, et al. Rapid, reversible activation of AgRP neurons drives feeding behavior in mice. The Journal of clinical investigation. 2011;121:1424. doi: 10.1172/JCI46229. [DOI] [PMC free article] [PubMed] [Google Scholar]
- 20.van den Pol AN, et al. Neuromedin B and gastrin-releasing peptide excite arcuate nucleus neuropeptide Y neurons in a novel transgenic mouse expressing strong Renilla green fluorescent protein in NPY neurons. Journal of Neuroscience. 2009;29:4622–4639. doi: 10.1523/JNEUROSCI.3249-08.2009. [DOI] [PMC free article] [PubMed] [Google Scholar]
- 21.Luquet S, Perez FA, Hnasko TS, Palmiter RD. NPY/AgRP neurons are essential for feeding in adult mice but can be ablated in neonates. Science. 2005;310:683–685. doi: 10.1126/science.1115524. [DOI] [PubMed] [Google Scholar]
- 22.Wu Q, Clark MS, Palmiter RD. Deciphering a neuronal circuit that mediates appetite. Nature. 2012;483:594–597. doi: 10.1038/nature10899. [DOI] [PMC free article] [PubMed] [Google Scholar]
- 23.Cong L, et al. Multiplex genome engineering using CRISPR/Cas systems. Science. 2013;339:819–823. doi: 10.1126/science.1231143. [DOI] [PMC free article] [PubMed] [Google Scholar]
- 24.Platt RJ, et al. CRISPR-Cas9 knockin mice for genome editing and cancer modeling. Cell. 2014;159:440–455. doi: 10.1016/j.cell.2014.09.014. [DOI] [PMC free article] [PubMed] [Google Scholar]
- 25.Spanswick D, Smith M, Groppi V, Logan S, Ashford M. Leptin inhibits hypothalamic neurons by activation of ATP-sensitive potassium channels. Nature. 1997;390:521. doi: 10.1038/37379. [DOI] [PubMed] [Google Scholar]
- 26.Seghers V, Nakazaki M, DeMayo F, Aguilar-Bryan L, Bryan J. SUR1 knockout mice A model for KATP channel-independent regulation of insulin secretion. Journal of Biological Chemistry. 2000;275:9270–9277. doi: 10.1074/jbc.275.13.9270. [DOI] [PubMed] [Google Scholar]
- 27.Miki T, et al. Defective insulin secretion and enhanced insulin action in KATP channel-deficient mice. Proceedings of the National Academy of Sciences. 1998;95:10402–10406. doi: 10.1073/pnas.95.18.10402. [DOI] [PMC free article] [PubMed] [Google Scholar]
- 28.Pinto S, et al. Rapid rewiring of arcuate nucleus feeding circuits by leptin. Science. 2004;304:110–115. doi: 10.1126/science.1089459. [DOI] [PubMed] [Google Scholar]
- 29.Rudolph U, Möhler H. Analysis of GABAA receptor function and dissection of the pharmacology of benzodiazepines and general anesthetics through mouse genetics. Annu Rev Pharmacol Toxicol. 2004;44:475–498. doi: 10.1146/annurev.pharmtox.44.101802.121429. [DOI] [PubMed] [Google Scholar]
- 30.Garfield AS, et al. Dynamic GABAergic afferent modulation of AgRP neurons. Nature neuroscience. 2016;19:1628. doi: 10.1038/nn.4392. [DOI] [PMC free article] [PubMed] [Google Scholar]
- 31.Tong Q, Ye CP, Jones JE, Elmquist JK, Lowell BB. Synaptic release of GABA by AgRP neurons is required for normal regulation of energy balance. Nature neuroscience. 2008;11:998–1000. doi: 10.1038/nn.2167. [DOI] [PMC free article] [PubMed] [Google Scholar]
- 32.van den Pol AN, et al. Neuromedin B and gastrin-releasing peptide excite arcuate nucleus neuropeptide Y neurons in a novel transgenic mouse expressing strong Renilla green fluorescent protein in NPY neurons. Journal of Neuroscience. 2009;29:4622–4639. doi: 10.1523/JNEUROSCI.3249-08.2009. [DOI] [PMC free article] [PubMed] [Google Scholar]
- 33.Parton LE, et al. Glucose sensing by POMC neurons regulates glucose homeostasis and is impaired in obesity. Nature. 2007;449:228–232. doi: 10.1038/nature06098. [DOI] [PubMed] [Google Scholar]
- 34.Balthasar N, et al. Leptin receptor signaling in POMC neurons is required for normal body weight homeostasis. Neuron. 2004;42:983–991. doi: 10.1016/j.neuron.2004.06.004. [DOI] [PubMed] [Google Scholar]
- 35.Vong L, et al. Leptin action on GABAergic neurons prevents obesity and reduces inhibitory tone to POMC neurons. Neuron. 2011;71:142–154. doi: 10.1016/j.neuron.2011.05.028. [DOI] [PMC free article] [PubMed] [Google Scholar]
- 36.Platt RJ, et al. CRISPR-Cas9 knockin mice for genome editing and cancer modeling. Cell. 2014;159:440–455. doi: 10.1016/j.cell.2014.09.014. [DOI] [PMC free article] [PubMed] [Google Scholar]
- 37.Leiter EH. The NOD mouse: a model for analyzing the interplay between heredity and environment in development of autoimmune disease. ILAR Journal. 1993;35:4–14. [Google Scholar]
- 38.Liu T, et al. Fasting activation of AgRP neurons requires NMDA receptors and involves spinogenesis and increased excitatory tone. Neuron. 2012;73:511–522. doi: 10.1016/j.neuron.2011.11.027. [DOI] [PMC free article] [PubMed] [Google Scholar]
- 39.Ran FA, et al. Genome engineering using the CRISPR-Cas9 system. Nature protocols. 2013;8:2281–2308. doi: 10.1038/nprot.2013.143. [DOI] [PMC free article] [PubMed] [Google Scholar]
- 40.Montague TG, Cruz JM, Gagnon JA, Church GM, Valen E. CHOPCHOP: a CRISPR/Cas9 and TALEN web tool for genome editing. Nucleic acids research. 2014;42:W401–W407. doi: 10.1093/nar/gku410. [DOI] [PMC free article] [PubMed] [Google Scholar]
- 41.Henry FE, Sugino K, Tozer A, Branco T, Sternson SM. Cell type-specific transcriptomics of hypothalamic energy-sensing neuron responses to weight-loss. Elife. 2015;4:e09800. doi: 10.7554/eLife.09800. [DOI] [PMC free article] [PubMed] [Google Scholar]
- 42.Krashes MJ, et al. Rapid, reversible activation of AgRP neurons drives feeding behavior in mice. The Journal of clinical investigation. 2011;121:1424. doi: 10.1172/JCI46229. [DOI] [PMC free article] [PubMed] [Google Scholar]
- 43.Opland D, et al. Loss of neurotensin receptor-1 disrupts the control of the mesolimbic dopamine system by leptin and promotes hedonic feeding and obesity. Molecular metabolism. 2013;2:423–434. doi: 10.1016/j.molmet.2013.07.008. [DOI] [PMC free article] [PubMed] [Google Scholar]
- 44.Kong D, et al. A postsynaptic AMPK→ p21-activated kinase pathway drives fasting-induced synaptic plasticity in AgRP neurons. Neuron. 2016;91:25–33. doi: 10.1016/j.neuron.2016.05.025. [DOI] [PMC free article] [PubMed] [Google Scholar]
- 45.Kong D, et al. GABAergic RIP-Cre neurons in the arcuate nucleus selectively regulate energy expenditure. Cell. 2012;151:645–657. doi: 10.1016/j.cell.2012.09.020. [DOI] [PMC free article] [PubMed] [Google Scholar]
- 46.Fujikawa T, Chuang JC, Sakata I, Ramadori G, Coppari R. Leptin therapy improves insulin-deficient type 1 diabetes by CNS-dependent mechanisms in mice. Proc Natl Acad Sci U S A. 2010;107:17391–17396. doi: 10.1073/pnas.1008025107. [DOI] [PMC free article] [PubMed] [Google Scholar]
Associated Data
This section collects any data citations, data availability statements, or supplementary materials included in this article.
Supplementary Materials
Data Availability Statement
The original and/or analysed data sets generated during the current study, and the codes used to analyse them, are available from the corresponding author upon reasonable request.


