Figure 3.

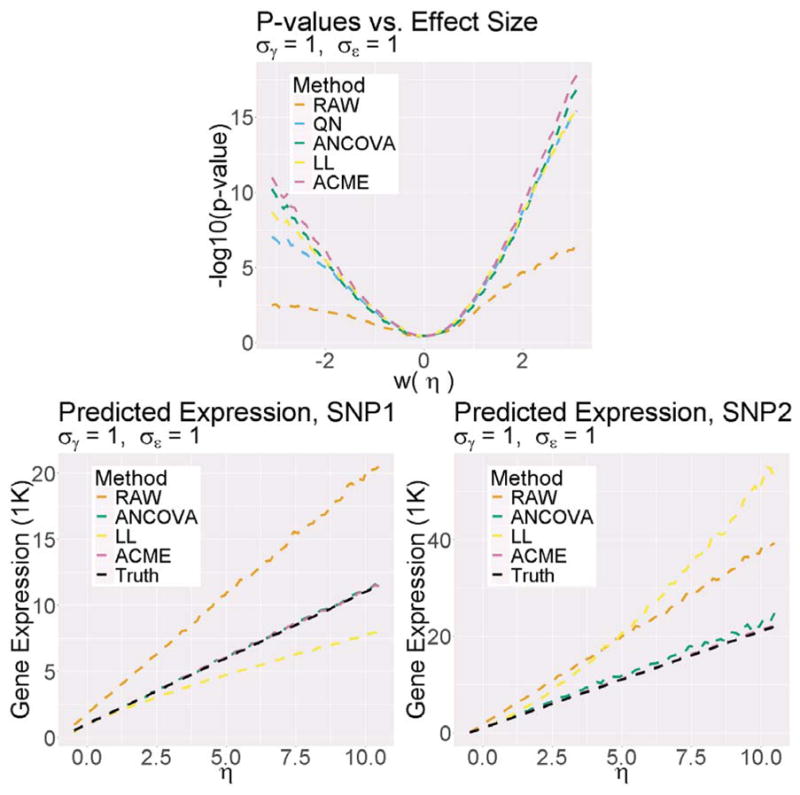
Results of large-scale simulation experiment. Middle: −log 10 F-test p-values as a function of η. Left and right: predicted raw expression with one and two reference alleles, respectively.

Results of large-scale simulation experiment. Middle: −log 10 F-test p-values as a function of η. Left and right: predicted raw expression with one and two reference alleles, respectively.