Abstract
Tropomyosin-1 (TPM1), a widely expressed actin-binding protein, is downregulated in many tumors and associated with cancer progression. A previous study from our group suggested that TPM1 could be involved in renal cell carcinoma (RCC) apoptosis, but the mechanisms and details remained unknown. The present study aimed to further examine the proapoptotic effects of TPM1 and investigate the underlying mechanisms in RCC cell lines. Results from cell viability, DAPI staining and apoptosis assays demonstrated that TPM1 upregulation inhibited cell proliferation and promoted cell apoptosis in both 786-O and ACHN RCC cell lines. However, TPM1 knockdown in the two RCC cell lines did not result in the opposite effects on cell proliferation or cell apoptosis. Comet assay and western blotting results demonstrated that TPM1 overexpression induced DNA damage and decreased the expression levels of the antiapoptotic factor BCL2 apoptosis regulator, while increasing the expression levels of the proapoptotic factors BCL2 associated X, Caspase-3 and p53 in 786-O and ACHN cells. The present findings suggest that TPM1 overexpression in RCC cell lines can induce tumor cell apoptosis via the p53-mediated mitochondrial pathway. Further studies are needed to fully elucidate the potential of TPM1 as a candidate for RCC targeted therapy in the future.
Keywords: tropomyosin-1, renal cell carcinoma, cell apoptosis, mitochondrial pathway
Introduction
Renal cell carcinoma (RCC) is a common urological tumor which accounts for ~2% of all adult malignancies. There were 62,700 newly diagnosed kidney and renal pelvis cancer cases and 14,240 related deaths in the US in 2016 (1). The latest Chinese cancer epidemiology study reported 67,100 newly diagnosed kidney cancer cases and 24,100 related deaths in China in 2013 (2). The RCC incidence rates were 4.4 and 2.2 per 100,000 in urban and rural China, respectively, in 2013 (2). RCC diagnosis rose steadily over recent decades, mainly due to the increasing use of medical imaging methods (3). By contrast, with the development of operation techniques and molecular targeted therapies, the overall 5-year survival rates of RCC has improved significantly from 50 to 74% during the past three decades (1). Apoptosis resistance is a key cell biological behavior of RCC and many other malignant tumors, which can result in uncontrolled tumor growth. Therefore, a systemic investigation of the molecules that affect apoptosis and proliferation in RCC is necessary for the development of novel therapeutic candidates and improved treatment strategies.
Tropomyosin-1 (TPM1) belongs to the tropomyosin family of actin-binding proteins that are widely expressed in various cells. In muscle cells, tropomyosins mainly function with the troponin complex to regulate muscle contraction in a calcium-dependent manner, while in non-muscle cells tropomyosins work as microfilaments to stabilize the cell skeleton (4). Four TPM genes express a group of tropomyosin proteins, which are consisted by either 248 amino acids (low molecular weight, LMW) or 284 amino acids (high molecular weight, HMW). HMW tropomyosins are commonly downregulated upon cell transformation and dedifferentiation in cancer development (5). In one of the most representative studies, Bharadwaj and Prasad (6) demonstrated that TPM1 was downregulated in breast cancer and functioned as a tumor suppressor gene. Similar findings were observed in many other types of tumors, including colorectal cancer, glioma and neuroblastoma (7–9). A previous study by our group has demonstrated that TPM1 is downregulated in RCC and associated with tumor cell apoptosis, invasion and migration (10). However, to the best of our knowledge, the molecular mechanisms by which TPM1 promotes apoptosis have not been fully investigated in RCC.
The aim of the present study was to reveal in more detail the molecular mechanisms by which TPM1 expression affects tumor cell apoptosis and proliferation in RCC. These effects were assessed by TPM1 overexpression and knockdown in two different RCC cell lines.
Materials and methods
Cell culture and reagents
Human clear cell renal cell carcinoma cell lines, 786-O and ACHN, were purchased from Procell Life Science and Technology Co,. Ltd. (Wuhan, China). 786-O cells were cultured in RPMI-1640 medium (Gibco; Thermo Fisher Scientific, Inc., Waltham, MA, USA) and ACHN cells were cultured in MEM (Gibco; Thermo Fisher Scientific, Inc.). Both media were supplemented with 10% fetal bovine serum (Hyclone; Healthcare Life Sciences, Logan, UT, USA), 100 U/ml penicillin and 100 mg/ml streptomycin in a 5×7 cm flask in a moist atmosphere containing 5% CO2 at 37°C. The anti-TPM1 (cat. no. 3910S), anti-Bax (cat. no. 2774), anti-Bcl-2 (cat. no. 4223), horseradish peroxidase (HRP) conjugated goat-anti-rabbit IgG (cat. no. 7074) and HRP-conjugated horse-anti-mouse IgG (cat. no. 7076) antibodies were purchased from Cell Signaling Technology, Inc. (Danvers, MA, USA). Anti-Caspase-3 (cat. no. ab44976), anti-p53 (cat. no. ab26) and anti-β-actin (cat. no. ab8226) antibodies were purchased from Abcam, Inc. (Cambridge, MA, USA).
Plasmid construction and transient transfection
Plasmids were designed, constructed and purchased from Suzhou GenePharma Co., Ltd. (Suzhou, China), and included the overexpression vector pEX4-TPM1, the overexpression negative control empty vector pEX4, the knockdown vector pGPU6/GFP/Neo-shTPM1-Homo-975, and the knockdown negative control vector pGPU6/GFP/Neo-shNC. One day prior to transfection, 786-O and ACHN cells were seeded in 24-well microplates (4×10⁴ cells/well) and cultured for 24 h at 37°C and 5% CO2. When the density of cells grew to ~70–80% in the following day, cells were transfected with the indicated plasmids using Lipofectamine 2000 (Invitrogen; Thermo Fisher Scientific, Inc.), according to the manufacturer's instructions. The ratio of plasmid (169 µg/µl) to transfection reagent was 1 µg:1.5 µl. The transfected cells were incubated at 5% CO2 at 37°C for 4 h prior to being changed to complete media containing 10% serum.
Cell viability assay
The 786-O and ACHN cells were cultured in 24-well plates at a density of 4×10⁴ cells/well for 24 h following transfection. After 24 h, MTT dissolved in PBS was added to each well at a final concentration of 5 mg/ml, and the samples were incubated at 37°C for 4 h. Water-insoluble crystals of formazan that formed during MTT cleavage in actively metabolizing cells were then dissolved in dimethyl sulfoxide. Absorbance was measured at 490 nm, using a microplate reader (Bio-Rad Laboratories, Inc., Hercules, CA, USA).
DAPI staining
786-O and ACHN cells were washed with PBS at 36 h post-transfection and then fixed in 4% paraformaldehyde for 30 min. PBS supplemented with 0.1% Triton X-100 was added for 2 min on ice, and cells were stained with 50 µl DAPI for 10 min. Following three washes with PBS, images were captured using a fluorescence microscope. Stage IIb apoptotic cells, which contain fragments of splitting nucleus, were easily distinguished from other cells. The apoptosis rate was calculated in each high power field (HPF) as follows: Stage IIb apoptotic cells in one HPF/all cells in the same HPF. A total of five HPFs were randomly selected per group.
Single cell gel electrophoresis (comet assay)
786-O and ACHN cells were harvested 36 h post-transfection and washed with PBS, then the cells were resuspended into low melting point agarose at a ratio of 1:4. A total of 100 µl of cell suspension was added on the slide with 1.0% normal melting point agarose, covered with coverslips, and then stored at 4°C for 30 min in the dark. The coverslips were then removed and the slides were immersed into lysis solution (pH 10, 2.5 M NaCl, 100 mM Na2EDTA, 10 mM 1% Tris-HCl Sodium Sarcosinate; added Triton X-100 and dimethyl sulfoxide to make their final concentration up to 1 and 10% respectively before use) at 4°C for 1–2 h in the dark. After washing, the slides were transferred to an electrophoresis tank filled with alkaline electrophoresis buffer (pH 13, 1 mM Na2EDTA, 300 mM NaOH) for 20 min to allow DNA unwinding. After the electrophoresis procedure, the slides were washed three times using a neutralization buffer (pH 7.5, 0.4 M Tris-HCl). Slides were stained with 50 µl ethidium bromide (10 µg/l) for visualization using a fluorescence microscope. At least 50 cells were randomly selected from each group for observation and analyzed by CASPLab software (version 1.2.3β1, University of Wroclaw, Institute of Theoretical Physics, Wroclaw, Poland). Tail DNA %, tail length and Olive tail moment were adopted as evaluation parameters of DNA damage.
Apoptosis analysis
To measure the extent of 786-O and ACHN cell apoptosis, an Annexin V-fluorescein isothiocyanate (FITC) apoptosis detection kit was used, according to the manufacturer's instructions (eBioscience; Thermo Fisher Scientific, Inc.). At 36 h post-transfection, cells were harvested and centrifuged at 1,200 × g for 5 min at room temperature. Then cells were washed once with PBS, and suspended in 1X binding buffer. A total of 5 µl Annexin V-FITC was added to 100 µl of cell suspension. Cells were washed with 2 ml of binding buffer and suspended in 200 µl of 1X binding buffer. Finally, 200 µl cell suspensions were mixed with 5 µl propidium iodide (PI) staining solution then assessed by flow cytometry (BD FACSCantoII; BD Biosciences, Franklin Lakes, NJ, USA) and analyzed using Cellquest 6.0 (BD Biosciences).
Gel electrophoresis and western blot analysis
786-O and ACHN cell lines were harvested 36 h post-transfection and washed with PBS twice. After centrifugation at 1,000 × g for 5 min at room temperature, the cell pellets were suspended in ice-cold buffer (50 mM Tris-HCl, pH 7.4, 150 mM NaCl, 1 mM PMSF, 1 mM EDTA, 5 µg/ml aprotinin, 5 µg/µl leupeptin, 1% Triton X-100 and 1% Sodium deoxycholate) and homogenized. Homogenates were centrifuged at 10,000 × g at 4°C for 10 min to obtain the supernatant. The protein concentration of the supernatant was measured via Bio-Rad protein assay kit (Bio-Rad Laboratories Hercules, CA, USA). The same weight of protein (50 µg/lane) was electrophoresed on 10% SDS-PAGE and then transferred to polyvinylidene difluoride membranes. The membranes were blocked with PBS/5% bovine serum albumin for 1 h and then incubated overnight at 4°C with the primary antibodies as follows: Anti-TPM1 (dilution, 1:1,000), anti-caspase-3 (dilution, 1:1,000), anti-Bax (dilution, 1:1,000), anti-Bcl-2 (dilution, 1:1,000), anti-p53 (dilution, 1:1,000) and anti-β-actin (dilution, 1:1,000). The membranes were washed with PBST once and then incubated with HRP-conjugated goat-anti-rabbit IgG (dilution, 1:1,500) secondary antibody for TPM1, caspase-3, Bax and Bcl-2 detecting, while incubated with HRP-conjugated horse-anti-mouse IgG (dilution, 1:1,500) secondary antibody for p53 and β-actin detecting for 4 h at room temperature, then washed with PBST again. Finally, immunoreactive proteins were visualized on films with enhanced chemiluminescence (Amersham; GE Healthcare, Chicago, IL, USA). Densitometry was performed with Kodak ID image analysis software (Kodak, Rochester, NY, USA).
Statistical analysis
All statistical analyses were performed using the GraphPad Prism 5.0 software (GraphPad Software, Inc., La Jolla, CA, USA). All data are expressed as the mean ± standard deviation, unless otherwise stated. Comparisons between groups were performed with one-way or two-way analysis of variance followed by Bonferroni test. P<0.05 was considered to indicate a statistically significant difference.
Results
TPM1 upregulation inhibits 786-O cell proliferation
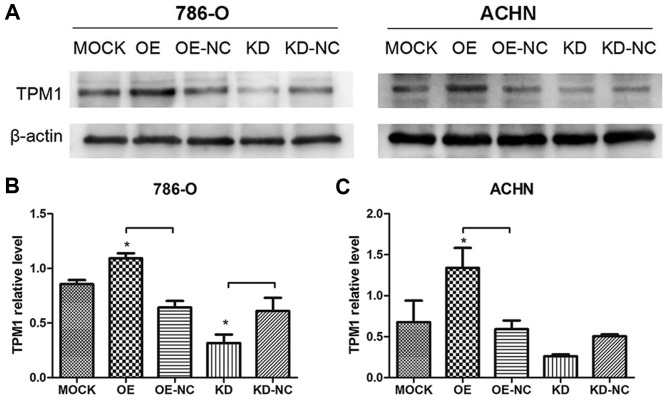
At 24 h post-transfection with the overexpression or the knockdown plasmids, the protein expression levels of TPM1 were examined by western blot analysis (Fig. 1A). The results demonstrated that TPM1 protein levels in the pEX4-TPM1 overexpression group (OE) were markedly increased compared with its negative control pEX4-NC group (OE-NC; P<0.001 in 786-O cells, Fig. 1B; P<0.01 in ACHN cells, Fig. 1C). By contrast, TPM1 protein levels in the pGPU6-shTPM1 knockdown group (KD) were decreased compared with its negative control pGPU6-shNC group (KD-NC) in 786-O cells (P<0.01; Fig. 1B), while no change was observed in ACHN cells (Fig. 1C). These findings demonstrate that nearly all the constructed plasmids were successfully transfected into 786-O and ACHN cell lines.
Figure 1.
TPM1 protein expression in 786-O and ACHN cell lines at 24 h following plasmids transfection. (A) Representative western blot images of the different transfection groups in 786-O and ACHN cell lines. Untransfected cells were used as a control (mock). (B) Quantification of TPM1 protein expression levels in 786-O cells. (C) Quantification of TPM1 protein expression levels in ACHN cells. The values are presented as mean ratios ± standard deviation relative to β-actin values from three independent repeats. *P<0.05, with comparisons indicated by brackets. TPM1, tropomyosin-1; OE, TPM1 overexpression; OE-NC, negative control for overexpression vector; KD, TPM1 knockdown; KD-NC, negative control for knockdown vector.
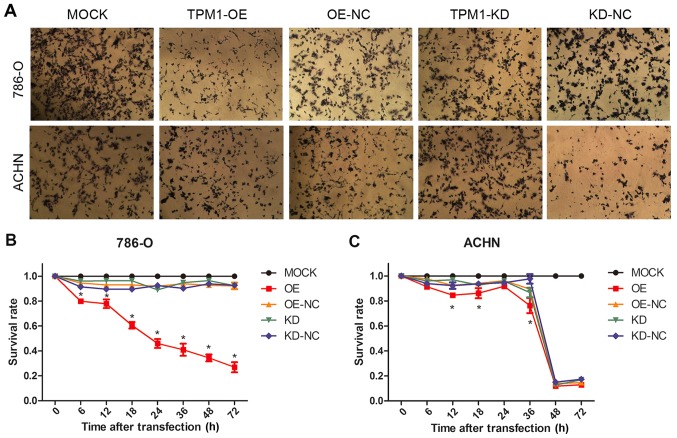
Next, 786-O and ACHN cells were transfected with the various plasmids, and their viability was assessed by MTT assay at 0, 6, 12, 18, 24, 36, 48 and 72 h (representative pictures are illustrated in Fig. 2A). The results demonstrated that TPM1 overexpression gradually decreased the numbers of viable 786-O cells over time, while no significant difference was observed among other groups (P<0.001 for all time points; Fig. 2B). TPM1 overexpression in ACHN cells had similar effects on cell survival rate, while no remarkable difference was observed among other groups in ACHN cells (Fig. 2C).
Figure 2.
TPM1 overexpression inhibits renal cell carcinoma proliferation. (A) MTT assay microscopy images (magnification, ×100) at 24 h post-transfection for 786-O cells and at 36 h post-transfection for ACHN cells. (B) Cell survival rates at different times after transfection in 786-O cells. (C) Cell survival rates at different times after transfection in ACHN cells. The values are presented as mean ± standard deviation from three independent repeats. *P<0.05, compared with the OE-NC group. TPM1, tropomyosin-1; OE, TPM1 overexpression; OE-NC, negative control for overexpression vector; KD, TPM1 knockdown; KD-NC, negative control for knockdown vector.
TPM1 overexpression leads to RCC cell apoptosis
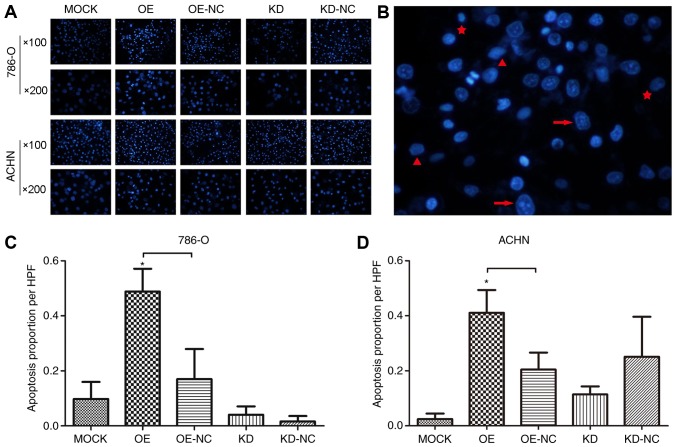
To measure the apoptosis rates of RCC cells following manipulation of TPM1 expression, the DAPI staining assay was used. Fluorescence microscopy images captured of the stained cells demonstrated that nuclei with abnormal margins and condensed chromatin were more markedly observed in the TPM1 overexpression group compared with the other groups (Fig. 3A). Nuclear fragmentation in TPM1-overexpressing RCC cells was marked by tear drop-shaped tubular, irregular and fragmented chromatin (Fig. 3B). By contrast, in the mock, knockdown and two negative control groups, DAPI staining mainly resulted in single, bright, round nuclei and peripheral cell spots (Fig. 3A). Apoptotic cell numbers and proportions were counted and calculated by microscopy observation of 10×20 high power fields (magnification ×10 ocular lens plus magnification ×20 objective lens). Statistical analysis of the results revealed that the TPM1 overexpression groups had significantly higher apoptosis rates compared with their negative control groups in both 786-O and ACHN cells (P<0.001 and P<0.05; Fig. 3C and D, respectively). No significant difference was observed between the TPM1 knockdown and its negative control group in either cell line (Fig. 3C and D).
Figure 3.
TPM1 overexpression increases renal cell carcinoma apoptosis as detected by DAPI staining. (A) Representative fluorescence microscopy images of DAPI-stained cells at 36 h post-transfection (magnification, ×100 and ×200). (B) Morphological changes of nuclear chromatin at 36 h post-TPM1 overexpression in 786-O cells (magnification, ×200). The red triangle indicates stage I apoptosis characterized by a rippled or creased nucleus. The red star indicates stage IIa apoptosis characterized by a highly condensed or marginalized nucleus. The red arrow indicates stage IIb apoptosis characterized by fragments of splitting nucleus. Apoptotic cell proportions per HPF (magnification, ×200) of the different transfection groups in (C) 786-O and (D) ACHN cells. The values are presented as mean ± standard deviation from five randomly selected HPFs. *P<0.05, with comparisons indicated by brackets. TPM1, tropomyosin-1; OE, TPM1 overexpression; OE-NC, negative control for overexpression vector; KD, TPM1 knockdown; KD-NC, negative control for knockdown vector; HPF, high power field.
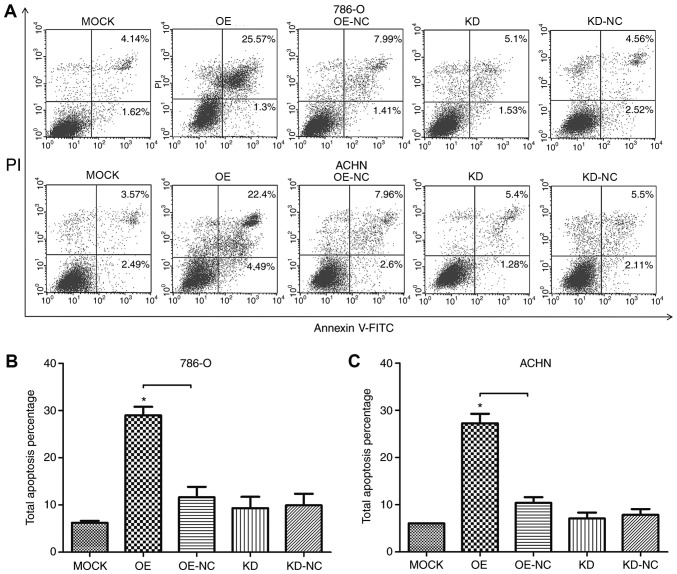
To further examine how TPM1 overexpression and knockdown affect apoptosis in RCC cells, flow cytometry analysis was used based on PI/Annexin-V-FITC staining in the two cell lines. The results demonstrated that TPM1 upregulation promoted cell apoptosis in both cell lines, while TPM1 knockdown did not have any significant effect (Fig. 4A). TPM1 overexpression significantly increased the amount of apoptotic cells (Annexin V-FITC+/PI±) compared with its negative control group in both 786-O and ACHN cells (P<0.001 and P<0.001; Fig. 4B and C, respectively). No significant difference was observed between the TPM1 knockdown and its negative control group (Fig. 4B and C).
Figure 4.
TPM1 overexpression enhances renal cell carcinoma apoptosis as detected by flow cytometry. (A) Representative scatter plots of the different transfection groups at 36 h post-trasfection in 786-O and ACHN cells. (B) Quantification of total apoptotic cell % in 786-O cells. (C) Quantification of total apoptotic cell % in ACHN cells. The values are presented mean ± standard deviation from three independent repeats. *P<0.05, with comparisons indicated by brackets. TPM1, tropomyosin-1; OE, TPM1 overexpression; OE-NC, negative control for overexpression vector; KD, TPM1 knockdown; KD-NC, negative control for knockdown vector; PI, propidium iodide; FITC, fluorescein isothiocyanate.
TPM1 activates p53-mediated mitochondrial apoptosis pathways
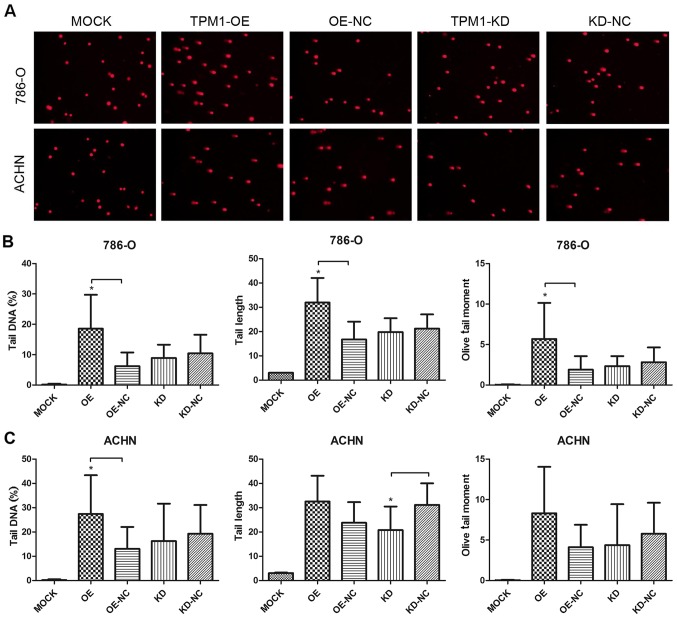
Single cell gel electrophoresis (comet assay) revealed that TPM1 overexpression induced DNA damage in both RCC cell lines. Comet tails, a marker of DNA fragmentation, mainly appeared in the TPM1 overexpression groups rather than the other groups (Fig. 5A). Results from software analyses clearly demonstrated that overexpression of TPM1 significantly induced an increase of tail DNA %, tail length and Olive tail moments in 786-O cells (P<0.001, P<0.001 and P<0.001, respectively; Fig. 5B), and partially in ACHN cells (P<0.05, P>0.05 and P>0.05, respectively; Fig. 5C). For the TPM1 knockdown group, a significant difference was only observed on tail length in ACHN cells compared with its negative control (P<0.05; Fig. 5C). In summary, overexpression of TPM1 resulted in obvious DNA damage in 786-O cells and somewhat in ACHN cells.
Figure 5.
TPM1 overexpression induces DNA damage in renal cell carcinoma. (A) Representative fluorescence microscopy images (magnification, ×10) from comet assay (single cell gel electrophoresis) of the different transfected groups in 786-O and ACHN cells. (B) Quantification of the DNA damage parameters tail DNA%, tail length and Olive tail moment in 786-O cells. (C) Quantification of the DNA damage parameters tail DNA%, tail length and Olive tail moment in ACHN cells. The values are presented as mean ± standard deviation of >50 comet images. *P<0.05, with comparisons indicated by brackets. TPM1, tropomyosin-1; OE, TPM1 overexpression; OE-NC, negative control for overexpression vector; KD, TPM1 knockdown; KD-NC, negative control for knockdown vector.
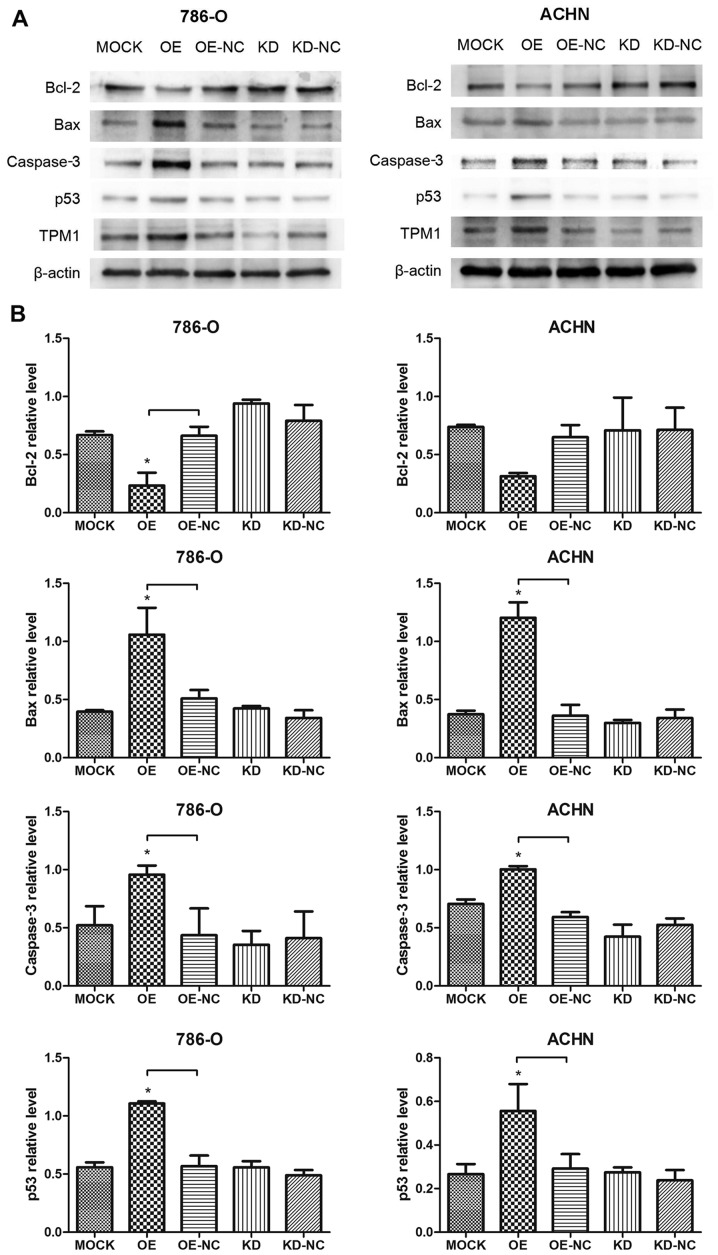
In order to study the molecular mechanisms by which TPM1 protein induces apoptosis in RCC cell lines, western blotting was used in order to analyze the protein expression of key proteins involved in the mitochondrial apoptosis pathway. Representative blot images from the different treatment groups of 786-O and ACHN cells are presented in Fig. 6A. Densitometry results demonstrated that TPM1 upregulation significantly decreased the expression levels of the antiapoptotic factor Bcl-2, while it increased the expression levels of the proapoptotic factors Bax, Caspase-3 and p53 in 786-O and ACHN cells (Fig. 6B). Together, these results suggest that TPM1 overexpression induced DNA damage and then activated p53 to initiate the mitochondrial pathway promoting apoptosis in RCC cell lines.
Figure 6.
Effects of TPM1 in apoptosis-related protein expression in renal cell carcinoma cell lines. (A) Representative western blot images of Bcl-2, Bax, caspase-3, p53, TPM1 and β-actin protein expression levels in 786-O and ACHN cells. (B) Quantification of protein expression levels by densitometry in 786-O and ACHN cells. The values are presented as mean ratio ± standard deviation relative to the β-actin value from three independent repeats. *P<0.05, with comparisons indicated by brackets. TPM1, tropomyosin-1; Bcl-2, BCL2 apoptosis regulator; Bax, BCL2 associated X; p53, tumor protein p53; OE, TPM1 overexpression; OE-NC, negative control for overexpression vector; KD, TPM1 knockdown; KD-NC, negative control for knockdown vector.
Discussion
The role of TPM1 as a tumor suppressor gene in cancer has been extensively studied. Among all tropomyosin family members, TPM1 is the most frequently involved in the progression of cancer (6,8,9). In a previous study, our group revealed the clinical and biological significance of TPM1 expression levels in RCC (10). Restoring the expression levels of TPM1 could hinder the progression of RCC by affecting many malignant biological behaviors including apoptosis. However, the mechanisms by which TPM1 induced RCC cell apoptosis remained unknown. The present study demonstrated that TPM1 overexpression in RCC cell lines induced tumor cell apoptosis via the mitochondria pathway. To our surprise, knockdown of TPM1 by small hairpin RNA had no effect in RCC cell apoptosis. To the best of our knowledge, these results were the first investigations demonstrating that TPM1 promotes RCC apoptosis through the mitochondria pathway.
In the present study, TPM1 overexpression in RCC inhibited tumor cell proliferation and promoted tumor cell apoptosis. The present results are consistent with several previous investigations which have reported an association between TPM1 overexpression and increased apoptosis rate in oral squamous cell carcinoma, cholangiocarcinoma and in some benign diseases, such as congenital heart defects (11–13). In the present study, multiple standard methods were used to detect cell apoptosis, including morphological changes by DAPI staining and fluorescence microscopy, DNA fragments detected by comet assay, cytomembrane instability by flow cytometry, and caspase-3 protein expression by western blotting. Additionally, the effects of TPM1 expression on RCC cell proliferation were measured by MTT assay. All the results have demonstrated that TPM1 overexpression facilitated RCC cell apoptosis and inhibited its proliferation.
To study the effects of TPM1 on the proliferation and apoptosis in RCC, transient transfection of TPM1 overexpression and knockdown plasmids was used in two different RCC cell lines. The results demonstrated that overexpression of TPM1 suppressed cell proliferation and facilitated cell apoptosis in RCC. It has been reported that miR-21 is overexpressed in RCC tissues and modulates the growth, apoptosis and cell cycle progression of RCC cells and regulates the expression of programmed cell death 4 (PDCD4) and TPM1 (14). Other studies have demonstrated that TPM1 is one of target genes of miR-21 and that miR-21 has critical functions in various solid tumors, affecting many malignant biological behaviors, including tumor cell proliferation, apoptosis, invasion, migration, angiogenesis and others (15–18). It is thus possible that TPM1 may be the intermediate link between miR-21 expression and cell proliferation or apoptosis in RCC. Therefore, restoring TPM1 expression may be a feasible approach to suppress tumor cell proliferation and promote tumor cell apoptosis in RCC. Since TPM1 is downregulated or even deleted in RCC, knocking down its expression level did not further contribute to cancer progression.
Apoptosis mainly happens through two major pathways: The extrinsic pathway (death receptor pathway) or the intrinsic pathway (the mitochondrial pathway and endoplasmic reticulum pathway) (19,20). Different molecules are involved in different pathways. The death receptor pathway is activated by ligand-bound death receptors, mainly tumor necrosis factor receptor 1, Fas cell surface death receptor, and death receptor 4 and 5. Then, caspase-8 is activated and forms the death inducing signaling complex with the ligand-bound death receptors (19). The mitochondrial pathway is the central modulator in vertebrate cell apoptosis. Various stimuli can induce the mitochondrial outer membrane permeabilization and release of proteins from the mitochondrial intermembrane space. Among these proteins, the Bcl-2 family members are critical regulators of mitochondrial apoptosis (21). Bcl-2 itself was discovered as an antiapoptotic protein that blocks tumor cell death. Bax, a pro-apoptotic member of the family, can form large openings in lipid bilayers to increase the permeability of mitochondrial membrane and induce apoptosis (21,22). Caspase-9, −3 and −7 are the key molecules among the caspase-dependent mechanism in mitochondria pathway (23). Endoplasmic reticulum (ER) has been demonstrated to be associated with apoptosis after the discovery of the mitochondrial apoptosis pathway theory. Mobilization of ER calcium stores initiates the activation of cytoplasmic death pathways as well as sensitizes mitochondria to direct proapoptotic stimuli (20).
The present western blotting results demonstrated that TPM1 overexpression decreased the expression levels of Bcl-2 and increased the expression levels of Bax, caspase-3 and p53. These molecules, which have key roles in the mitochondrial apoptotic pathway, were thus modulated by TPM1 to initiate apoptosis in RCC cell lines. In addition, the comet assay results demonstrated that TPM1 overexpression induced DNA damage in RCC cells. Therefore, it can be speculated that TPM1 overexpression may induce DNA damage in tumor cells which then activates p53 expression, subsequently regulates Bcl-2 family members, and finally promotes RCC cell apoptosis via the mitochondrial pathway. As aforementioned, those pathways have many interactions with each other or even correlative dependence. Death receptors on the cell surface detect the presence of extracellular death signals, rapidly igniting the intrinsic apoptosis machinery (24). DNA damage caused by TPM1 might be an intrinsic proapoptotic stimulus. A previous study revealed that the regulation of apoptosis by p53 is tightly connected to the mitochondrial outer membrane permeabilization and the induction of and interaction with Bcl-2 family members (25). Recently, it was reported that the mitochondrial apoptotic pathway, activated by BH3-only proteins, is essential for ER stress-induced cell death (26). Further investigation is required for a more detailed understanding of the underlying mechanisms in RCC.
In conclusion, the present investigations demonstrated that TPM1 overexpression in RCC cell lines induced tumor cell apoptosis via the p53-mediated mitochondrial pathway and inhibited cell proliferation, while TPM1 knockdown in RCC had no effect. Unfortunately, many details about the apoptotic mechanisms and the discrepant results between the bidirectional expression regulations remain not fully understood. Additional studies will be needed to gain a better understanding of the functions and mechanisms of TPM1 in vivo, and to examine the potential of TPM1 as a candidate therapy target for RCC in the future.
Acknowledgements
Not applicable.
Funding
The present study was supported by a grant from the Development of Science and Technology Projects of Health and Family Planning Commission of Jilin Province (grant no. 20150204064SF).
Availability of data and materials
The datasets used and/or analyzed during the present study are available from the corresponding author upon reasonable request.
Authors' contributions
JW and CT conceived and designed the experiments. CT performed the experiments. CT and QW performed data collection. JW and YPD performed data analysis and visualization. CT, HPQ and CY wrote the original draft of the manuscript. HPQ and CY performed data analysis. JW and YCH reviewed and modified the manuscript. JW and YCH supervised the project. YCH acquired the funding. All these authors approved the final version to be published.
Ethics approval and consent to participate
Not applicable.
Consent for publication
Not applicable.
Competing interests
The authors declare that they have no competing interests.
References
- 1.Siegel RL, Miller KD, Jemal A. Cancer statistics, 2016. CA Cancer J Clin. 2016;66:7–30. doi: 10.3322/caac.21332. [DOI] [PubMed] [Google Scholar]
- 2.Chen W, Zheng R, Zhang S, Zeng H, Xia C, Zuo T, Yang Z, Zou X, He J. Cancer incidence and mortality in China, 2013. Cancer Lett. 2017;401:63–71. doi: 10.1016/j.canlet.2017.04.024. [DOI] [PubMed] [Google Scholar]
- 3.Turner RM, II, Morgan TM, Jacobs BL. Epidemiology of the Small Renal Mass and the treatment disconnect phenomenon. Urol Clin North Am. 2017;44:147–154. doi: 10.1016/j.ucl.2016.12.001. [DOI] [PMC free article] [PubMed] [Google Scholar]
- 4.Perry SV. Vertebrate tropomyosin: Distribution, properties and function. J Muscle Res Cell Motil. 2001;22:5–49. doi: 10.1023/A:1010303732441. [DOI] [PubMed] [Google Scholar]
- 5.Helfman DM, Flynn P, Khan P, Saeed A. Tropomyosin as a regulator of cancer cell transformation. Adv Exp Med Biol. 2008;644:124–131. doi: 10.1007/978-0-387-85766-4_10. [DOI] [PubMed] [Google Scholar]
- 6.Bharadwaj S, Prasad GL. Tropomyosin-1, a novel suppressor of cellular transformation is down regulated by promoter methylation in cancer cells. Cancer Lett. 2002;183:205–213. doi: 10.1016/S0304-3835(02)00119-2. [DOI] [PubMed] [Google Scholar]
- 7.Petrova DT, Asif AR, Armstrong VW, Dimova I, Toshev S, Yaramov N, Oellerich M, Toncheva D. Expression of chloride intracellular channel protein 1 (CLIC1) and tumor protein D52 (TPD52) as potential biomarkers for colorectal cancer. Clin Biochem. 2008;41:1224–1236. doi: 10.1016/j.clinbiochem.2008.07.012. [DOI] [PubMed] [Google Scholar]
- 8.Ku BM, Ryu HW, Lee YK, Ryu J, Jeong JY, Choi J, Cho HJ, Park KH, Kang SS. 4′-Acetoamido-4-hydroxychalcone, a chalcone derivative, inhibits glioma growth and invasion through regulation of the tropomyosin 1 gene. Biochem Biophys Res Commun. 2010;402:525–530. doi: 10.1016/j.bbrc.2010.10.068. [DOI] [PubMed] [Google Scholar]
- 9.Yager ML, Hughes JA, Lovicu FJ, Gunning PW, Weinberger RP, O'Neill GM. Functional analysis of the actin-binding protein, tropomyosin 1, in neuroblastoma. Br J Cancer. 2003;89:860–863. doi: 10.1038/sj.bjc.6601201. [DOI] [PMC free article] [PubMed] [Google Scholar]
- 10.Wang J, Guan J, Lu Z, Jin J, Cai Y, Wang C, Wang F. Clinical and tumor significance of tropomyosin-1 expression levels in renal cell carcinoma. Oncol Rep. 2015;33:1326–1334. doi: 10.3892/or.2015.3733. [DOI] [PubMed] [Google Scholar]
- 11.Pan H, Gu L, Liu B, Li Y, Wang Y, Bai X, Li L, Wang B, Peng Q, Yao Z, Tang Z. Tropomyosin-1 acts as a potential tumor suppressor in human oral squamous cell carcinoma. PLoS One. 2017;12:e0168900. doi: 10.1371/journal.pone.0168900. [DOI] [PMC free article] [PubMed] [Google Scholar]
- 12.Yang W, Wang X, Zheng W, Li K, Liu H, Sun Y. Genetic and epigenetic alterations are involved in the regulation of TPM1 in cholangiocarcinoma. Int J Oncol. 2013;42:690–698. doi: 10.3892/ijo.2012.1741. [DOI] [PubMed] [Google Scholar]
- 13.England J, Granados-Riveron J, Polo-Parada L, Kuriakose D, Moore C, Brook JD, Rutland CS, Setchfield K, Gell C, Ghosh TK, et al. Tropomyosin 1: Multiple roles in the developing heart and in the formation of congenital heart defects. J Mol Cell Cardiol. 2017;106:1–13. doi: 10.1016/j.yjmcc.2017.03.006. [DOI] [PMC free article] [PubMed] [Google Scholar]
- 14.Lv L, Huang F, Mao H, Li M, Li X, Yang M, Yu X. MicroRNA-21 is overexpressed in renal cell carcinoma. Int J Biol Markers. 2013;28:201–207. doi: 10.5301/JBM.2013.10831. [DOI] [PubMed] [Google Scholar]
- 15.Zhu S, Si ML, Wu H, Mo YY. MicroRNA-21 targets the tumor suppressor gene tropomyosin 1 (TPM1) J Biol Chem. 2007;282:14328–14336. doi: 10.1074/jbc.M611393200. [DOI] [PubMed] [Google Scholar]
- 16.Zhu S, Wu H, Wu F, Nie D, Sheng S, Mo YY. MicroRNA-21 targets tumor suppressor genes in invasion and metastasis. Cell Res. 2008;18:350–359. doi: 10.1038/cr.2008.24. [DOI] [PubMed] [Google Scholar]
- 17.Wang Y, Gao X, Wei F, Zhang X, Yu J, Zhao H, Sun Q, Yan F, Yan C, Li H, Ren X. Diagnostic and prognostic value of circulating miR-21 for cancer: A systematic review and meta-analysis. Gene. 2014;533:389–397. doi: 10.1016/j.gene.2013.09.038. [DOI] [PubMed] [Google Scholar]
- 18.Sekar D, Krishnan R, Thirugnanasambantham K, Rajasekaran B, Islam VI, Sekar P. Significance of microRNA 21 in gastric cancer. Clin Res Hepatol Gastroenterol. 2016;40:538–545. doi: 10.1016/j.clinre.2016.02.010. [DOI] [PubMed] [Google Scholar]
- 19.Jin ZY, El-Deiry WS. Overview of cell death signaling pathways. Cancer Biol Ther. 2005;4:139–163. doi: 10.4161/cbt.4.2.1508. [DOI] [PubMed] [Google Scholar]
- 20.Breckenridge DG, Germain M, Mathai JP, Nguyen M, Shore GC. Regulation of apoptosis by endoplasmic reticulum pathways. Oncogene. 2003;22:8608–8618. doi: 10.1038/sj.onc.1207108. [DOI] [PubMed] [Google Scholar]
- 21.Newmeyer DD, Ferguson-Miller S. Mitochondria: Releasing power for life and unleashing the machineries of death. Cell. 2003;112:481–490. doi: 10.1016/S0092-8674(03)00116-8. [DOI] [PubMed] [Google Scholar]
- 22.Pradelli LA, Bénéteau M, Ricci JE. Mitochondrial control of caspase-dependent and -independent cell death. Cell Mol Life Sci. 2010;67:1589–1597. doi: 10.1007/s00018-010-0285-y. [DOI] [PMC free article] [PubMed] [Google Scholar]
- 23.Tait SW, Green DR. Mitochondrial regulation of cell death. Cold Spring Harb Perspect Biol. 2013;5:pii:a008706. doi: 10.1101/cshperspect.a008706. [DOI] [PMC free article] [PubMed] [Google Scholar]
- 24.Ashkenazi A, Dixit VM. Death receptors: Signaling and modulation. Science. 1998;281:1305–1308. doi: 10.1126/science.281.5381.1305. [DOI] [PubMed] [Google Scholar]
- 25.Dashzeveg N, Yoshida K. Cell death decision by p53 via control of the mitochondrial membrane. Cancer Lett. 2015;367:108–112. doi: 10.1016/j.canlet.2015.07.019. [DOI] [PubMed] [Google Scholar]
- 26.Glab JA, Doerflinger M, Nedeva C, Jose I, Mbogo GW, Paton JC, Paton AW, Kueh AJ, Herold MJ, Huang DC, et al. DR5 and caspase-8 are dispensable in ER stress-induced apoptosis. Cell Death Differ. 2017;24:944–950. doi: 10.1038/cdd.2017.53. [DOI] [PMC free article] [PubMed] [Google Scholar]
Associated Data
This section collects any data citations, data availability statements, or supplementary materials included in this article.
Data Availability Statement
The datasets used and/or analyzed during the present study are available from the corresponding author upon reasonable request.


