Abstract
The aim of the present study was to evaluate the relative functional volume of bilateral lumbar multifidus (LM) muscles across different stages and ages of patients with lumbar disc herniation (LDH). The relative functional volumes of LM muscles in both non-affected and affected sides in the L4-L5 and L5-S1 segmental level were measured in a resting prone position, and visual analogue score (VAS) for pain and Japanese Orthopedic Association (JOA) scores were recorded. The correlation between changes in the relative net volume of LM muscles and times of onset, ages, VAS and JOA scores were analyzed. A total of 327 cases were selected. The affected sides of LM muscles could present a certain degree of atrophy in stages >3 weeks. During the duration of the course, all cases presented different degrees of LM muscle atrophy. In addition, the degree of LM muscle atrophy was positively correlated with its duration. Age could influence the degree of LM muscle atrophy. Patients with unilateral LDH had <10% asymmetry on relative functional volume in the youth group. At the L4-L5 segments, patients with unilateral LDH had >10% asymmetry within the course of 3 months in the elderly group. The reduced rate of the relative functional net LM muscle volume was positively correlated with VAS scores, age, duration and JOA scores. In conclusion, the reduced rate of relative functional net LM muscle volume was positively correlated with age, duration, VAS scores and JOA scores. Although these findings are unreliable markers of lumbar pathology in an individual level for use in clinical or research settings, there is a notable importance of early intervention in LM muscle atrophy.
Keywords: lumbar disc herniation, lumbar multifidus, computed tomography imaging, duration, age
Introduction
According to literature, bilateral lumbar multifidus (LM) muscles are not symmetrical in acute lower back pain (1,2), chronic lower back pain (3,4) and lumbar disc disease in patients (5,6). Research has revealed that the structure and function of LM muscles are associated with lumbar spinal stability, and morphological changes of the LM muscles have been closely related to local pathological changes (7). Research has demonstrated that ~80% of patients with lumbar disc herniation (LDH) have revealed different degrees LM muscle atrophy (8). Some studies have indicated that duration of LDH is positively correlated with atrophy (9,10). Muscle atrophy has also been suggested to occur with ageing (11,12). In addition, it is difficult to define whether LM muscle atrophy is caused by the LM muscle atrophy itself or whether it is dominated by nerve inhibition (13,14). Whether these specific and lateral morphological changes represent a meaningful indicator or consequence of LDH continues to be debated (10,15). In addition, some scholars have taken different periods of the same observation object to study LM muscle changes; however, the existence of interference factors could not be abandoned (16). Whether there are morphological changes in the motion segment of LM muscles among the segments at a certain age and different durations in patients with LDH is rarely documented in literature (9,10,15–17). The deep LM present a single-segment distribution of the muscles, and the majority of clinical assessments of the lumbar spine are usually based on intervertebral motion segments. However, whether it is purely from a single section or the entire LM volume, the evaluation of the morphological changes of the LM muscle may be restricted for clinical applications.
It remains ambiguous whether LM muscle morphological and functional changes are caused by spinal balance disorders or spinal internal and external balance disorders, which result from LM morphology changes and functional changes of the muscle (18,19). However, the internal and external balance of spinal disorders increases intervertebral disc prominence, and causes the mechanical compression of the nerve root or a relatively narrow intervertebral foramen (20). Further study is required to clarify whether level- and side-specific multifidus muscle morphological changes could be used as a marker for disc pathology and whether they are associated with the refined duration and age segmentation in the Chinese population. If LM muscle asymmetry is indeed related to local pathology and refined by the duration and age segmentation, this could represent a substantial advance in helping to adjust and evaluate LM muscle morphological and functional changes as intervention active factors affecting the functional unit of the spine, and in evaluation interventions as an objective evaluation of the curative effect of LDH.
Therefore, the primary aim of the present study was to analyze multifidus muscle size and bilateral symmetry in the refined duration and age segmentation of patients with LDH. The secondary aim was to determine whether different age group patients with LDH with different pain presentations and duration displayed different patterns of LM atrophy.
Materials and methods
Patients
A total of 327 subjects (178 male and 149 female) between the ages of 18 and 65 years were selected through the image archives of patients imaged between April 2013 and November 2014 at the Department of Imaging, The Third Affiliated Hospital of Zhejiang Chinese Medical University (Hangzhou, China), which was part of a cross-scetional observation study of patients receiving lumbosacral computed tomography (CT) with symptoms suggestive of radiculopathy. The referring physicians' requisitions indicated the presence of radiculopathy or leg pain (21). At the CT facility, all patients that had a repeat history of the presenting complaint were also interviewed. The side, type, extent, age, activity level, gender, dextromanuality, treatment measures and duration of pain were documented. The extent and activity level were evaluated by VAS (Visual analogue) and JOA (Japanese Orthopaedic Association Scores) (22). The inclusion criteria were as follows: The interval from symptom onset to imaging was between 1 day and several years; the age of the subject was 18–65 years old; posterolateral disc herniation was only at one disc level; occurrence was either at L4-L5 or L5-S1, verified on imaging by a radiologist; symptoms following a nerve root distribution in the leg on the side of the herniation; recent activity was normal; and a week of physical activity was <180 points (23). Patients who had received previous spinal surgery, who had unclear positioning segment or bilateral lumbocrural pain symptoms, and whose images were of poor quality were excluded from the present study. The study was approved by the Health Ethics Research Board of The Third Affiliated Hospital of Zhejiang Chinese Medical University.
Evaluation of patient groups
According to the time of onset, all patients with LDH were divided into the following stages: Acute stage (within 1 week); remission stage (within 3 weeks); recovery stage (within 1 month); sub-acute stage (within 3 months); and chronic stage (over 3 months). Additionally, all cases were classified based on age: Youth (18–45 years) and elderly (>45–65 years).
Instrumentation and procedures
Physical screening
The purpose of this screening was to characterize each subject's clinical presentation and signs of consistency, in order to confirm the location of pain in the lower lumbar spine, for example either L4-L5 or L5-S1, and identify its consistency with the inclusion criteria.
Image acquisition
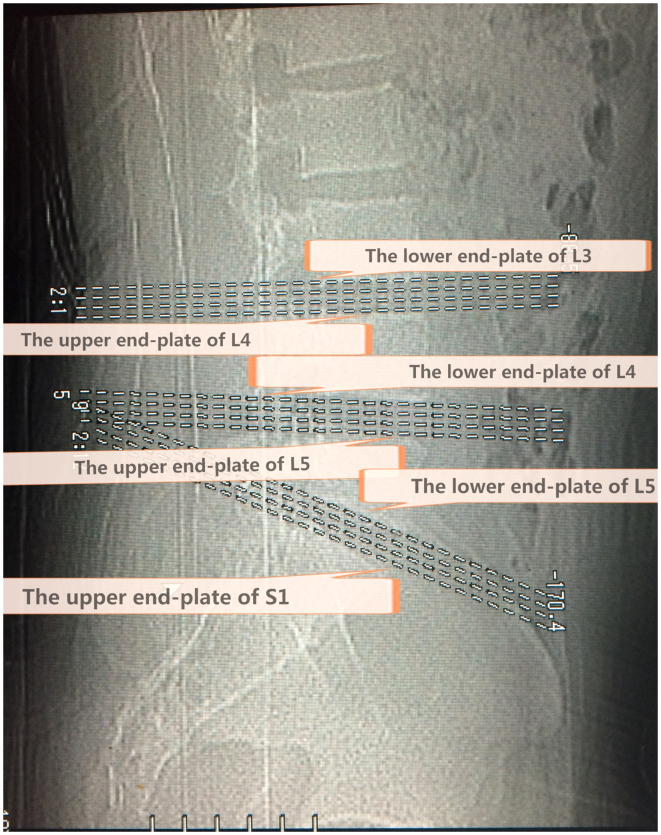
CT images were obtained using a Toshiba 16 row helical CT scanning imaging system (Toshiba Corp., Tokyo, Japan) with exposure factors of 120 Kv/375 mAs and 1.5–3.0 mm/s/3.0×4, and a window level of 35 and window width of 320. The CT procedure in all subjects included intervertebral segments of standardized transaxial images and four levels for each section, which were positioned accurately through the end plate of a vertebral body. The first crossed the lower end plate of L4 and the upper end plate of L5, while the second crossed the lower end plate of L5 and the upper end plate of S1 (Fig. 1).
Figure 1.
A locating window view representing the three standardized views positioned accurately along the lower end plate of L3, the upper and lower end plate of L4, the upper and lower end plate of L5, and the upper end plate of S1. Intervertebral segments standardized transaxial images and four levels for each section, positioned accurately through an end plate of a vertebral body. The L4-L5 segment crosses the lower end plate of L4, and the upper end plate of L5, while the L5-S1 segment crosses the lower end plate of L5 and the upper end plate of S1.
Image analysis
The CT images were obtained by a soft tissue window. The analysis of isolated multifidus consisted of four steps using a computer program (Activion v.16, Toshiba Corp., Tokyo, Japan) written for this purpose. Muscle measurements were obtained at four levels for each section. Quantitative measurements were performed by two investigators blinded to the results of previously obtained information on disc pathology and symptoms, in order to eliminate potential bias. Image segmentation was performed by means of an elimination technique based on differences in the grey values of the pixels. Bone and clear fat deposits were eliminated. Each section was measured separately for both the right and left multifidi, and four levels were counted altogether (Fig. 2). The volumes and average for each side were determined using the following formulae: Volume=Cross sectional area (CSA) × slice thickness × number of slices; net relative volume=the affected side of LM muscle volumes-the unaffected side of the LM muscle volumes; atrophy ratio=the affected side of LM muscle volumes-the unaffected side of the LM muscle/the largest side. With reference to the study results reported by Hides et al (2,24) and combined with the actual situation of the present research, an atrophy ratio of 10% or higher was considered atrophy or asymmetry. The degree of symmetry of the multifidus volume was calculated as a percentage of the difference between sides, relative to the larger side [% difference=(largest side-smallest side/largest side) ×100].
Figure 2.
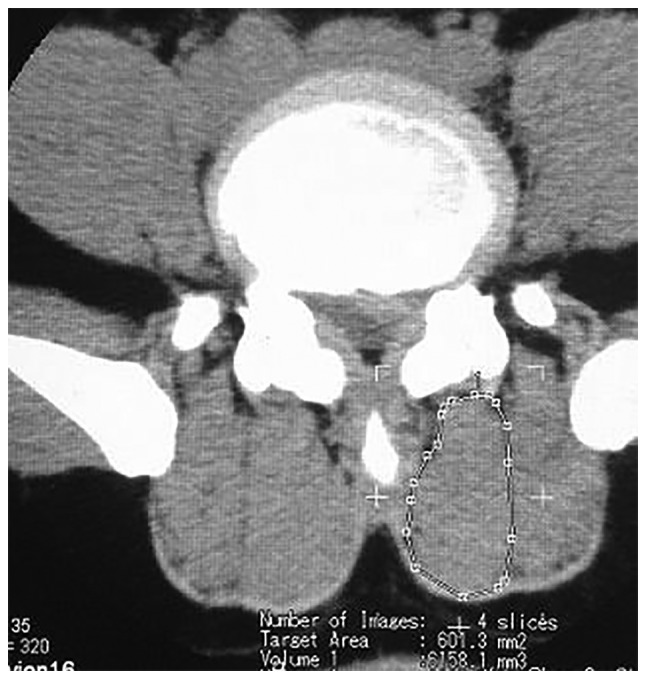
The cross-sectional area of the LM muscles were measured on the transaxial view. The outlines of the region of interest were cursor identified on the computer screen. The relative functional volume of the LMs were calculated through the computer software. LM, lumbar multifidus.
Statistical analysis
Data were expressed as the mean ± standard deviation and were analyzed using SPSS 17.0 software (SPSS Inc., Chicago, IL, USA). Repeated measures analysis of variance (ANOVA) was conducted followed by Bonferroni correction. All measurements and images were recorded by the same observer. The area measurements were repeated by a second analyst for 30 randomly picked subjects to calculate the correlation coefficients in interobserver comparisons. Inter-rater reliability coefficients were high (0.90–0.99), indicating that the current measurement technique could be duplicated by other investigators in a similar fashion. Intraclass correlation coefficients (ICC) for the intra-rater reliability of muscle measurements were determined from an independent sample of 30 comparable clinical CTs that were read twice. The intra-rater ICCs were similar, ranging from 0.90–0.99.. P<0.05 was considered to indicate a statistically significant difference.
Results
Net relative functional multifidus muscle volumes
A total of 327 subjects met the inclusion criteria, including 151 subjects with herniations at L5-S1 levels and 176 at L4-L5 levels (Table I). ANOVA results for the net relative functional multifidus muscle volumes at L4-L5 were significantly higher within 1 week than within 3 weeks for the elderly group (P=0.016; Fig. 3) and within 3 weeks compared with within 1 month for the elderly group (P=0.004; Fig. 3). For the youth group, the multifidus muscle volumes at L4-L5 were significantly higher within 3 weeks than within 1 month (P=0.015; Fig. 4); however there was no significant difference between 1 and 3 weeks (P=0.140; Fig. 4). ANOVA results for the LM muscle net relative functional volumes at L5-S1 were significantly higher at 1 week than 3 weeks in the elderly group (P=0.004; Fig. 5), and between 3 week and 1 month (P=0.001; Fig. 5); however, in the youth group the difference was not significant between 1 and 3 weeks (P=0.285; Fig. 6) and between 3 weeks and 1 month (P=0.002; Fig. 6).
Table I.
Participant characteristics for side of LDH, gender, age, BMI, VAS and JOA score of LDH in the different duration groups.
| Stage of duration of LDH | |||||
|---|---|---|---|---|---|
| Characteristic | Acute (L/R) | Remittent (L/R) | Recovery (L/R) | Sub-acute (L/R) | Chronic (L/R) |
| Side, n (left/right) | |||||
| L4-L5 segment | 21 (8/13) | 15 (9/6) | 13 (10/3) | 12 (8/4) | 10 (5/5) |
| 22 (10/12) | 18 (9/9) | 16 (7/9) | 11 (9/2) | 13 (6/7) | |
| L5-S1 segment | 31 (11/20) | 17 (8/9) | 13 (7/6) | 13 (5/8) | 15 (5/10) |
| 30 (11/19) | 21 (10/11) | 11 (3/8) | 13 (6/7) | 12 (4/8) | |
| Gender, n (male/female) | |||||
| L4-L5 segment | 17/4 | 10/5 | 9/4 | 7/5 | 7/3 |
| 11/11 | 11/7 | 5/11 | 4/7 | 6/7 | |
| L5-S1 segment | 18/13 | 9/8 | 6/7 | 11/2 | 9/6 |
| 13/17 | 8/13 | 5/6 | 6/7 | 6/6 | |
| Age, years | |||||
| L4-L5 segment | 34.71±8.31 | 37.33±7.37 | 35.46±6.50 | 36.25±7.98 | 36.70±7.99 |
| 53.18±6.28 | 53.33±5.60 | 51.13±4.50 | 53.36±5.52 | 52.08±3.55 | |
| L5-S1 segment | 36.10±6.56 | 34.88±9.87 | 34.15±6.43 | 35.85±4.95 | 36.67±5.42 |
| 53.20±5.96 | 52.00±4.50 | 54.64±6.55 | 54.08±4.52 | 52.42±5.76 | |
| BMI, kg/m2 | |||||
| L4-L5 segment | 21.17±1.84 | 21.17±1.58 | 21.05±1.65 | 21.29±1.54 | 21.14±1.96 |
| 21.43±1.85 | 21.35±1.63 | 21.23±1.61 | 21.25±1.89 | 20.55±1.59 | |
| L5-S1 segment | 21.14±1.76 | 21.07±1.68 | 21.34±1.63 | 21.34±1.80 | 20.29±1.36 |
| 21.30±1.88 | 21.35±1.51 | 21.31±1.62 | 20.64±1.84 | 20.86±1.93 | |
| VAS | |||||
| L4-L5 segment | 4.71±1.15 | 4.07±0.70 | 3.23±1.24 | 2.83±1.40 | 2.50±1.08 |
| 4.68±1.23 | 3.89±0.68 | 3.25±1.24 | 2.81±1.17 | 2.62±1.26 | |
| L5-S1 segment | 4.74±1.06 | 3.88±0.70 | 3.08±1.26 | 2.69±1.32 | 2.47±1.36 |
| 4.63±1.19 | 3.80±0.98 | 3.09±1.30 | 2.77±1.24 | 2.50±1.68 | |
| JOA score | |||||
| L4-L5 segment | 11.10±3.69 | 12.13±2.88 | 12.85±3.46 | 13.00±3.52 | 13.7±3.78 |
| 11.00±4.20 | 12.17±2.81 | 12.75±3.49 | 12.91±3.05 | 14.15±4.12 | |
| L5-S1 segment | 11.10±3.69 | 11.59±2.85 | 12.77±4.25 | 12.77±3.96 | 14.8±4.31 |
| 10.87±4.34 | 12.00±3.18 | 12.73±3.95 | 12.92±2.90 | 14.92±4.19 | |
Data are presented as the mean ± standard deviation. L/R, left side/right side; LDH, lumbar disc herniation; BMI, body mass index; VAS, visual analog scale for pain; JOA, Japanese Orthopedic Association.
Figure 3.
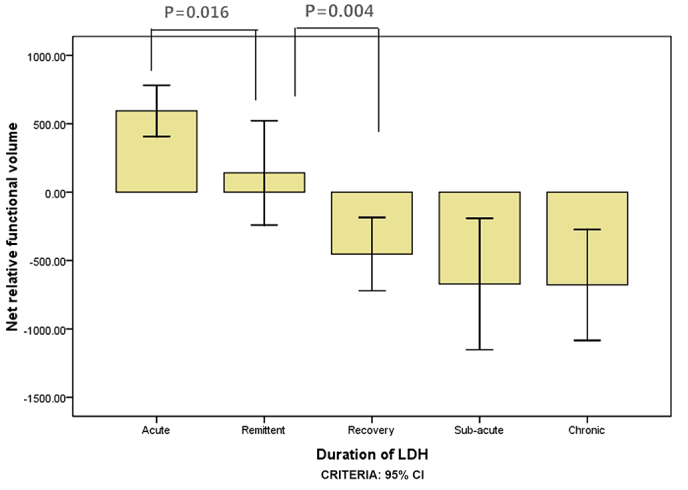
The net relative functional volume of elderly patients with lumbar disc herniation for the L4-L5 segment in the different duration groups.
Figure 4.
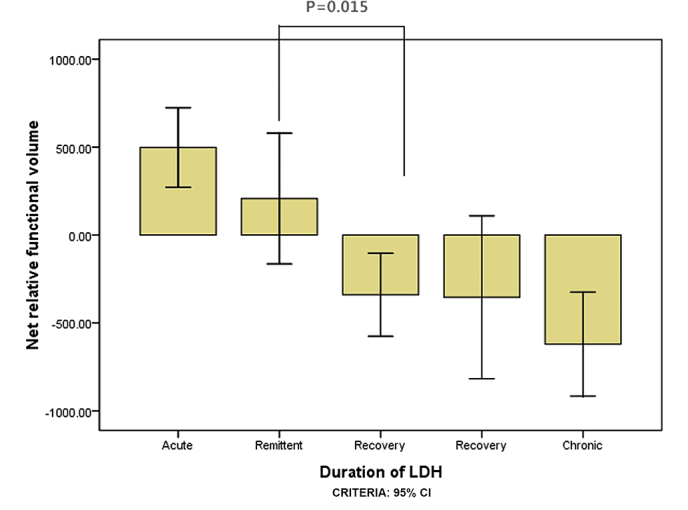
The net relative functional volume of youth patients with lumbar disc herniation for the L4-L5 segment in the different duration groups.
Figure 5.
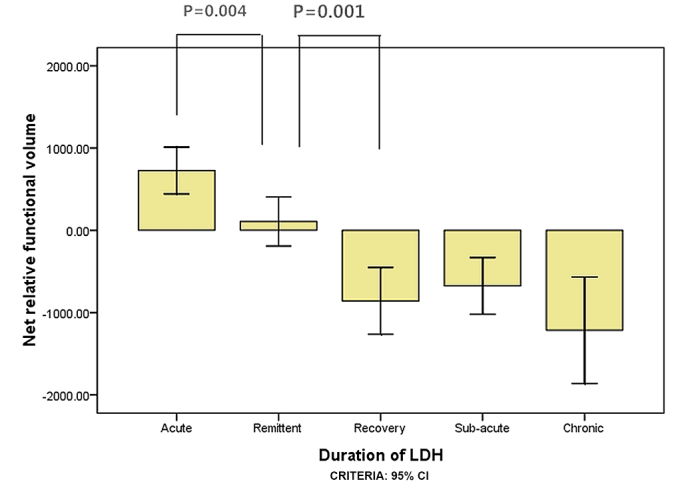
The net relative functional volume of elderly patients with lumbar disc herniation for the L5-S1 segment in the different duration groups.
Figure 6.
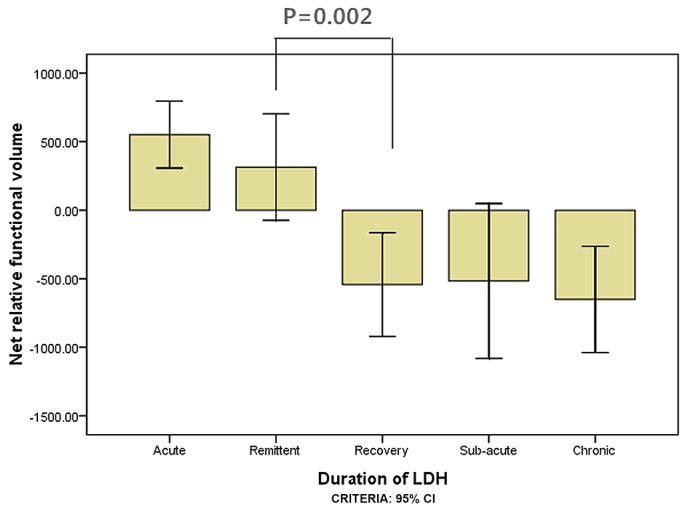
The net relative functional volume of youth patients with lumbar disc herniation for the L5-S1 segment in the different duration groups.
Relative functional atrophy ratio of lumbar multifidus muscles
Results demonstrated that age influenced the degree of LM muscle atrophy in the L5-S1 segment at the chronic stage, with the elderly group having a significantly lower net relative functional volume than the youth group (P=0.048; Table II). At the L4-L5 and L5-S1 segments, all patients with unilateral LDH in the youth group had <10% (vs 0.10) asymmetry for atrophy ratio of LM in the size of their multifidus muscles. At the L4-L5 segment, patients with unilateral LDH in the elderly group had >10% (vs. 0.10) asymmetry for atrophy ratio of LM in the size of their multifidus muscles within the course of 3 months, while in the L5-S1 segment, asymmetry degree reached the standard of asymmetry within the course of 1 month, and reached 16 (vs 0.16) over 3 months (Table II). The reduced rate of the net LM muscle volume was positively correlated with VAS scores, age, duration and JOA scores (P<0.05; Table III).
Table II.
Net relative functional volume and relative functional atrophy ratio of lumbar multifidus muscles for the various stages of LDH duration and ages at the L4-L5 and L5-S1 segmental levels.
| Segmental level | ||||||
|---|---|---|---|---|---|---|
| L4-L5 | L5-S1 | |||||
| Duration of LDH | Youth group | Elderly group | P-value | Youth group | Elderly group | P-value |
| Acute | ||||||
| Net volume | 497.70±510.47 | 593.84±421.64 | 551.23±665.25 | 726.99±759.27 | ||
| Atrophy ratio | 0.08±0.07 | 0.11±0.09 | 0.10±0.13 | 0.12±0.14 | ||
| Remittent | ||||||
| Net volume | 207.42±671.38 | 140.52±767.18 | 314.78±755.11 | 107.52±654.84 | ||
| Atrophy ratio | 0.09±0.06 | 0.11±0.09 | 0.09±0.09 | 0.09±0.08 | ||
| Recovery | ||||||
| Net volume | −340.02±391.26 | −452.62±503.18 | −542.42±626.21 | −857.58±604.20 | ||
| Atrophy ratio | 0.05±0.06 | 0.10±0.06 | 0.09±0.06 | 0.15±0.10 | ||
| Sub-acute | ||||||
| Net volume | −354.10±729.14 | −671.97±672.10 | −516.48±934.97 | −674.87±570.32 | ||
| Atrophy ratio | 0.10±0.11 | 0.13±0.11 | 0.11±0.07 | 0.14±0.09 | ||
| Chronic | ||||||
| Net volume | −620.56±353.97 | −678.97±671.02 | −650.67±699.39 | −1214.99±1019.73 | 0.048 | |
| Atrophy ratio | 0.09±0.05 | 0.13±0.12 | 0.15±0.11 | 0.16±0.13 | ||
Data are presented as the mean ± standard deviation. LDH, lumbar disc herniation.
Table III.
Correlation analysis for the duration of LDH, VAS and JOA scores.
| Age group | ||||
|---|---|---|---|---|
| Youth | Elderly | |||
| Factor | L4-L5 segment | L5-S1 segment | L4-L5 segment | L5-S1 segment |
| Duration of LDH | ||||
| Rho | 0.962 | 0.929 | 0.949 | 0.936 |
| P-value | 0.009 | 0.023 | 0.014 | 0.019 |
| JOA score | ||||
| Rho | 0.973 | 0.920 | 0.970 | 0.961 |
| P-value | 0.005 | 0.027 | 0.006 | 0.009 |
| VAS | ||||
| Rho | 0.984 | 0.969 | 0.975 | 0.971 |
| P-value | 0.002 | 0.006 | 0.005 | 0.006 |
LDH, lumbar disc herniation; VAS, visual analog scale for pain; JOA, Japanese Orthopedic Association.
Discussion
The findings of the present study on muscle relative functional net volume and asymmetry suggest that LM muscles could be used as selective objective indicators of localized nerve root pathologies in LDH patients. The morphological change in LM muscles on the symptomatic side in accord with the protrusion segment was obvious. Furthermore, LM muscle atrophy was obvious with a symptom duration of <1 month, which was earlier than in previous reports (9,15,17). The age considered in future study could influence LM muscle morphology (11). The net LM volume reduction rate was positively correlated with the duration of LDH (Table III). This could be considered as an asymmetry at no less than 10% of the volume of functional asymmetry on the average volume for the atrophy index. The net relative volume of LM changed with age, segment and lumbocrural pain duration. This finding revealed that VAS, JOA score and duration were significantly and positively correlated with age and spinal segment.
However, there were factors that affected CSA measurements, such as the measurement itself, the state of the body and the chosen level of measurement. Compared with CSA, using the volume in the present research had many advantages. For example, the segmental level of the study had a constant volume, the local situation had a smaller influence than it did on CSA and the volume did not easily change. Furthermore, it ensured that the sample was selected for consistency. Against the pathological changes of LM muscles, CSA assumptions may be expected on the basis of the innervation of the intervertebral disc herniation segment below. Furthermore, intervertebral disc volume assumptions may be closer to the actual innervations, including a wider range, at least (10,25). According to the level of the intervertebral disc, the relative volume of LM muscle changes were mostly accompanied by functional changes, which appeared to be closer to clinical practice. Hides et al (24) suggested that the use of a 10% or greater LM muscle asymmetric CSA is a potential indicator of abnormal function of the spine. However, a multifidus muscle asymmetry of no less than 10% of the relative functional volume could also be considered to be atrophy in the present study.
Research has suggested that the duration of LDH is positively associated with the degree of muscle atrophy (9,15,17). Although some researchers have reported that more LM asymmetry was found in acute symptoms, unilateral lumbar back and magnetic resonance determine the segment degeneration of suspicious segmental pathological changes (1). It remains controversial whether morphological changes in specific segments and sides of the LM muscle may be considered as a symbol of the pathological changes of intervertebral disc disease (15).
Research has demonstrated that during the onset of early symptoms of LDH with lower back pain, which affects the opposite side to the muscle, the diameter of the LM muscle was larger than the unaffected side and was positively correlated with duration (17). Durations of LDH of <6 weeks demonstrated a more obvious asymmetrical difference in LM muscle, which could be a local disk or selective indication of sensitive nerve root lesions among patients with LDH (15). With <4 months of pain, LM muscle atrophy was on a specific side and on the local pain area (26). When the duration of LDH was <3 months, LM muscle atrophy was not obvious (26). However, when the duration was >3 months, the CSA of bilateral LM muscles decreased, and the affected side atrophy was more obvious (9). In addition, the studies of some scholars on LM changes in patients with <12 days of acute lower back pain (1) revealed that no lower back pain persisted for >1 day (24). A study by Barker et al (26) used the MR to measure the LM CSA in patients with an average 16-week history of unilateral lower back pain. A study by Hyun et al (27) reported the average duration of lower back pain as >17 months, and a study by Kulig et al (28) reported an average of ~6 months. These subjects were not a research history of the system analysis in these studies, the analysis of age was also not a certain limit, and other merger confounding factors such as body mass index, gender and physical activity index were not comprehensively considered; thus, these conclusions could have differences.
In the present study, the onset of symptoms of subjects ranged from 1 day to >3 months, including the acute stage. These were divided into the acute, remission, recovery, sub-acute and chronic phases, which fully reflected the course of morphological change over the duration. In the duration of <1 week in the acute stage, the affected side of the LM muscle was not atrophic, and this significantly increased with time. It may be interpreted as pseudohypertrophy or spasticity. Some researchers have considered that it may be caused by muscle spasm (17). However, another possible mechanism was hypotrophy (13). In MR images, edema signal changes may occur with the loss of nerve control within a few days or weeks (13). The smaller side was ipsilateral to the reported side of the symptoms within a course of 1 month. The relative volumes and CAS of LM muscles in the bilateral side decreased, and the affected side of muscle atrophy was most obvious with durations of >3 months. However, in actuality, LM muscle atrophy may not be detected through in a larger sample size, and a wider range of the course of the span of cases of clinical symptoms of initial samples should be covered to clarify this problem. Based on this consideration, the present research attempted to eliminate the influence of confounding factors by a more detailed clinical symptoms onset span, respectively, and to study the effect of the duration of LDH on LM morphology.
The correlation analysis on net relative volume changes with age, segment and lumbocrural pain duration, VAS and JOA revealed that VAS, JOA and lumbocrural pain duration was significantly positively correlated with age and spinal segment. Previous research has demonstrated that asymmetric LM was quite common in adults without a history of lower back pain, since asymmetry prior to onset may mask these pathological changes (14). Among various kinds of research on the history of lower back pain, participants were selected without consistent standards, such as no history of lower back pain (29), no more than a day of lower back pain (24) and no limit to the reporting activities of lower back pain (30).
In the present study, the LM of intervertebral disc volume was due to asymmetric lumbar pathological changes, which was supported through the observed asymmetry of muscles in all studies. LM asymmetry was associated with local pathological changes. The present study did not consider the LM change above or below the protrusion level; however, asymmetrical findings suggested that LM may be particularly sensitive, or lumbar pathological changes, such as those described in this article, were >3 weeks after the symptoms of pathological changes. In addition, it may exist by segmental LM muscular atrophy caused by segmental instability, and may aggravate these pathological changes. Considering the composition of muscles, LM had an obvious trend with a fattier infiltration in the affected side than in the unaffected side. In the same course, the elderly group had more fatty infiltration than younger groups. Patients with chronic lower back pain have been demonstrated to be positively associated with different degrees of muscle atrophy at different times (16), this may reflect the effect of age on the muscle function and structure of adaptation. The present study indicated that the occurrence of muscle atrophy occurred more frequently in the elderly group. Studies have demonstrated that age should be given attention and considered, and the age group is influenced by the degree of muscle atrophy (31–33). In other words, the age factor must be taken into consideration in later studies but should be considered in conjuction with other factors, which was similar to previous studies (11).
Future research should include additional samples, further subdivisions of participants into age groups, and provide a more detailed forecast of lumbar muscle size, shape and structure definition of age-related changes. Relative volume changes of muscles of adjacent segments (above and below) should also be considered. In addition, participants should be further investigated through different activity types and intensities. The limitations of the present study were determined by the cross-sectional study, and the sample size was limited by the time span. The subjects were not matched to the right or left side or by gender. The relative volume changes of muscles of the adjacent segments (above and below) were also not considered.
In conclusion, the results of the present study suggest that the multifidus muscle atrophy in LDH was considerable and bilateral. The reduced rate of relative functional net LM volume were positively correlated with the age, duration, VAS scores and JOA scores. The results suggest that the multifidus muscle may be selectively responsive to, or indicative of, localized lumbar disc or nerve root pathology in LDH patients with a symptom duration of less than 1 month. Although the findings observed were not reliable markers of lumbar pathology on an individual level, the importance of early intervention of LM atrophy was obvious and concerns of confounding factors, including age, activity level and gender, were taken into account in clinical or research settings.
Acknowledgements
We would like to thank all of the consultants in the Departments of Orthopedics and Imaging, The Third Affiliated Hospital of Zhejiang Chinese Medical University (Hangzhou, China) for agreeing to allow their patients to be involved in the present study. The present work was supported by grants from the Key Project of Zhejiang Province Science and Technology Plan of Traditional Chinese Medicine (grant no. 2011ZZ007, received by Xin-miao Yao) and the National Project On Inheritance Workshop Of Famous TCM Experts (grant no. 201420).
Competing interests
The authors declare that they have no competing interests.
References
- 1.Hides JA, Stokes MJ, Saide M, Jull GA, Cooper DH. Evidence of lumbar multifidus muscle wasting ipsilateral to symptoms in patients with acute/subacute low back pain. Spine (Phila Pa 1976) 1994;19:165–172. doi: 10.1097/00007632-199401001-00009. [DOI] [PubMed] [Google Scholar]
- 2.Hides JA, Richardson CA, Jull GA. Multifidus muscle recovery is not automatic after resolution of acute, first-episode low back pain. Spine (Phila Pa 1976) 1996;21:2763–2769. doi: 10.1097/00007632-199612010-00011. [DOI] [PubMed] [Google Scholar]
- 3.Gibbons LE, Latikka P, Videman T, Manninen H, Battié MC. The association of trunk muscle cross-sectional area and magnetic resonance image parameters with isokinetic and psychophysical lifting strength and static back muscle endurance in men. J Spinal Disord. 1997;10:398–403. doi: 10.1097/00002517-199710000-00007. [DOI] [PubMed] [Google Scholar]
- 4.Parkkola R, Rytökoski U, Kormano M. Magnetic resonance imaging of the discs and trunk muscles in patients with chronic low back pain and healthy control subjects. Spine (Phila Pa 1976) 1993;18:830–836. doi: 10.1097/00007632-199306000-00004. [DOI] [PubMed] [Google Scholar]
- 5.Yoshihara K, Shirai Y, Nakayama Y, Uesaka S. Histochemical changes in the multifidus muscle in patients with lumbar intervertebral disc herniation. Spine (Phila Pa 1976) 2001;26:622–626. doi: 10.1097/00007632-200103150-00012. [DOI] [PubMed] [Google Scholar]
- 6.Zhao WP, Kawaguchi Y, Matsui H, Kanamori M, Kimura T. Histochemistry and morphology of the multifidus muscle in lum-bar disc herniation: Comparative study between diseased and normal sides. Spine (Phila Pa 1976) 2000;25:2191–2199. doi: 10.1097/00007632-200009010-00009. [DOI] [PubMed] [Google Scholar]
- 7.Danneels LA, Vanderstraeten GG, Cambier DC, Witvrouw EE, De Cuyper HJ. CT imaging of trunk muscles in chronic low back pain patients and healthy control subjects. Eur Spine J. 2000;9:266–272. doi: 10.1007/s005860000190. [DOI] [PMC free article] [PubMed] [Google Scholar]
- 8.Kader DF, Wardlaw D, Smith FW. Correlation between the MRI changes in the lumbar multifidus muscles and leg pain. Clin Radiol. 2000;55:145–149. doi: 10.1053/crad.1999.0340. [DOI] [PubMed] [Google Scholar]
- 9.Zhong YB, Xu HS, Li JH. Cross-sectional area of LMmuscle in different stages of LDH. Clin Edu Gen Pra. 2014;12:256–259. [Google Scholar]
- 10.Beneck GJ, Kulig K. Multifidus atrophy is localized and bilateral in active persons with chronic unilateral low back pain. Arch Phys Med Rehabil. 2012;93:300–306. doi: 10.1016/j.apmr.2011.09.017. [DOI] [PubMed] [Google Scholar]
- 11.Valentin S, Licka T, Elliott J. Age and side-related morphometric MRI evaluation of trunk muscles in people without back pain. Man Ther. 2015;20:90–95. doi: 10.1016/j.math.2014.07.007. [DOI] [PMC free article] [PubMed] [Google Scholar]
- 12.Fortin M, Yuan Y, Battié MC. Factors associated with paraspinal muscle asymmetry in size and composition in a general population sample of men. Phys Ther. 2013;93:1540–1550. doi: 10.2522/ptj.20130051. [DOI] [PMC free article] [PubMed] [Google Scholar]
- 13.Kamath S, Venkatanarasimha N, Walsh MA, Hughes PM. MRI appearance of muscle denervation. Skeletal Radiol. 2008;37:397–404. doi: 10.1007/s00256-007-0409-0. [DOI] [PubMed] [Google Scholar]
- 14.Niemeläinen R, Briand MM, Battié MC. Substantial asymmetry in paraspinal muscle cross-sectional area in healthy adults questions its value as a marker of low back pain and pathology. Spine (Phila Pa 1976) 2011;36:2152–2157. doi: 10.1097/BRS.0b013e318204b05a. [DOI] [PubMed] [Google Scholar]
- 15.Battié MC, Niemelainen R, Gibbons LE, Dhillon S. Is level- and side-specific multifidus asymmetry a marker for lumbar disc pathology? Spine J. 2012;12:932–939. doi: 10.1016/j.spinee.2012.08.020. [DOI] [PubMed] [Google Scholar]
- 16.Wu WW, Hu ZJ, Fan SW, Xu WB, Fang XQ, Zhao FD. Influencing of chronic low back pain on multifidus muscle atrophy. Zhongguo Gu Shang. 2014;27:207–212. (In Chinese) [PubMed] [Google Scholar]
- 17.Du ZF, Chi HJ, Li AH. Study on changes of multifidus in patients with lumber disc herniation. J Clin Exper Med. 2012;11:608–609. [Google Scholar]
- 18.Panjabi MM. A hypothesis of chronic back pain: Ligament subfailure injuries lead to muscle control dysfunction. Eur Spine J. 2006;15:668–676. doi: 10.1007/s00586-005-0925-3. [DOI] [PMC free article] [PubMed] [Google Scholar]
- 19.Mörl F, Bradl I. Lumbar posture and muscular activity while sitting during office work. J Electromyogr Kinesiol. 2013;23:362–368. doi: 10.1016/j.jelekin.2012.10.002. [DOI] [PubMed] [Google Scholar]
- 20.Bergmark A. Stability of the lumbar spine: A study in mechanical engineering. Acta Orthop Scand suppl. 1989;230:1–54. doi: 10.3109/17453678909154177. [DOI] [PubMed] [Google Scholar]
- 21.Schoenfeld AJ, Weiner BK. Treatment of lumbar disc herniation: Evidence-based practice. Int J Gen Med. 2010;3:209–214. doi: 10.2147/ijgm.s12270. [DOI] [PMC free article] [PubMed] [Google Scholar]
- 22.Hiyama A, Watanabe M, Katoh H, Sato M, Sakai D, Mochida J. Evaluation of quality of life and neuropathic pain in patients with low back pain using the Japanese Orthopedic Association Back Pain Evaluation Questionnaire. Eur Spine J. 2015;24:503–512. doi: 10.1007/s00586-014-3723-y. [DOI] [PubMed] [Google Scholar]
- 23.Aadahl M, Jorgensen T. Validation of a new self-report instrument for measuring physical activity. Med Sci Sports Exerc. 2003;35:1196–1202. doi: 10.1249/01.MSS.0000074446.02192.14. [DOI] [PubMed] [Google Scholar]
- 24.Hides J, Gilmore C, Stanton W, Bohlscheid E. Multifidus size and symmetry among chronic LBP and healthy asymptomatic subjects. Man Ther. 2008;13:43–49. doi: 10.1016/j.math.2006.07.017. [DOI] [PubMed] [Google Scholar]
- 25.Boom HP, van Spronsen PH, van Ginkel FC, van Schijidel RA, Castelijns JA, Tuinzing DB. A comparison of human jaw muscle cross-sectional area and volume in long-anf short-face subjects, using MRI. Arch Oral Bio. 2008;153:273–281. doi: 10.1016/j.archoralbio.2007.08.013. [DOI] [PubMed] [Google Scholar]
- 26.Barker KL, Shamley DR, Jackson D. Changes in the crosssectional area of multifidus and psoas in patients with unilateral back pain: The relationship to pain and disability. Spine (Phila Pa 1976) 2004;29:E515–E519. doi: 10.1097/01.brs.0000144405.11661.eb. [DOI] [PubMed] [Google Scholar]
- 27.Hyun JK, Lee JY, Lee SJ, Jeon JY. Asymmetric atrophy of multifidus muscle in patients with unilateral lumbosacral radiculopathy. Spine (Phila Pa 1976) 2007;32:E598–E602. doi: 10.1097/BRS.0b013e318155837b. [DOI] [PubMed] [Google Scholar]
- 28.Kulig K, Scheid AR, Beauregard R, Popovich JM, Jr, Beneck GJ, Colletti PM. Multifidus morphology in persons scheduled for single-level lumbar microdiscectomy: Qualitative and quantitative assessment with anatomical correlates. Am J Phys Med Rehabil. 2009;88:355–61. doi: 10.1097/PHM.0b013e31819c506d. [DOI] [PubMed] [Google Scholar]
- 29.Yanik B, Keyik B, Conkbayir I. Fatty degeneration of multifidus muscle in patients with chronic low back pain and in asymptomatic volunteers: Quantification with chemical shift magnetic resonance imaging. Skelet Radiol. 2012;42:771–778. doi: 10.1007/s00256-012-1545-8. [DOI] [PubMed] [Google Scholar]
- 30.Marras WS, Jorgensen MJ, Granata KP, Wiand B. Female and male trunk geometry: Size and prediction of the spine loading trunk muscles derived from MRI. Clin Biomech (Bristol, Avon) 2001;16:38–46. doi: 10.1016/S0268-0033(00)00046-2. [DOI] [PubMed] [Google Scholar]
- 31.Anderson DE, D'Agostino JM, Bruno AG, Manoharan RK, Bouxsein ML. Regressions for estimating muscle parameters in the thoracic and lumbar trunk for use in musculoskeletal modelling. J Biomech. 2012;45:66–75. doi: 10.1016/j.jbiomech.2011.10.004. [DOI] [PMC free article] [PubMed] [Google Scholar]
- 32.Fortin M, Videman T, Gibbons LE, Battié MC. Paraspinal muscle morphology and composition: A 15-yr longitudinal magnetic resonance imaging study. Med Sci Sports Exerc. 2014;46:893–901. doi: 10.1249/MSS.0000000000000179. [DOI] [PubMed] [Google Scholar]
- 33.Meakin JR, Fulford J, Seymour R, Welsman JR, Knapp KM. The relationship between sagittal curvature and extensor muscle volume in the lumbar spine. J Anat. 2013;222:608–614. doi: 10.1111/joa.12047. [DOI] [PMC free article] [PubMed] [Google Scholar]


