Abstract
The methylotrophic yeast Pichia pastoris is a well-established expression host, which is often used in the production of protein pharmaceuticals. This work aimed to evaluate the effect of various concentrations of ascorbic acid in mixed feeding strategy with sorbitol/methanol on productivity of recombinant human growth hormone (r-hGH). The relevant concentration of ascorbic acid (5, 10, or 20 mmol) and 50 g/L sorbitol were added in batch-wise mode to the medium at the beginning of induction phase. The rate of methanol addition was increased stepwise during the first 12 h of production and then kept constant. Total protein and r-hGH concentrations were analyzed and the results compared with sorbitol/methanol feeding using one-way analysis of variance. Moreover, an effective clarification process using activated carbon was developed to remove process contaminants like pigments and endotoxins. Finally, a three-step chromatographic process was applied to purify the product. According to the obtained results, addition of 10 mmol ascorbic acid to sorbitol/methanol co-feeding could significantly increase cell biomass (1.7 fold), total protein (1.14 fold), and r-hGH concentration (1.43 fold). One percent activated carbon could significantly decrease pigments and endotoxins without any significant changes in r-hGH assay. The result of the study concluded that ascorbic acid in combination with sorbitol could effectively enhance the productivity of r-hGH. This study also demonstrated that activated carbon clarification is a simple method for efficient removal of endotoxin and pigment in production of recombinant protein in the yeast expression system.
Keywords: Pichia pastoris, ascorbic acid, Activated carbon, Pigment removal
INTRODUCTION
Human growth hormone (hGH) also known as somatropin is a protein hormone secreted by the pituitary gland. It plays an important role in growth control, promotion of growth and development of cells, as well as regulation of many metabolic processes (1). Until 1985, GH isolated from human cadaveric pituitaries was administered to children suffering from hormone deficiency (2). The use of pituitary derived hGH was prohibited when its association with Creutzfeldt-Jakob disease was proved. (3,4,5). With the development of recombinant DNA technology, the hGH gene was cloned in 1979 and recombinant hGH was approved for clinical use in 1985, eliminating the requirement for pituitary-derived preparation and avoiding the risk of transfer of human pathogens (6,7).
Pichia pastoris (P. pastoris) is now an established industrial platform for production of recombinant proteins (8,9). The advantages of using this yeast as expression system include: generally recognized as safe (GRAS) status, simple molecular manipulation, high expression level of recombinant proteins, ability to promote post-translational modifications such as folding, the efficient secretion of extracellular proteins and growth to high biomass levels.
The main advantages of P. pastoris over bacterial expression systems such as Escherichia coli are their ability to secrete recombinant proteins into the culture broth as well as the absence of endotoxins. (10,11,12). Moreover, yeasts do not contain potentially oncogenic or viral nucleic acid as sometimes found in mammalian cells (13,14). Due to these advantageous features, P. pastoris is also a useful expression system for production of large amounts of heterologous proteins with relative technical facility and at costs lower than those of most other eukaryotic systems such as mammalian cell cultures (15,16).
On the other hand, recombinant proteins produced during fermentation of P. pastoris may contain process related impurities such as host cell proteins and DNA, other biomolecules which are expressed extracellularly, pigment and pyrogenic components, and fermentation media ingredients (17,18). However, one of the most undesirable impurities resulting from employing P. pastoris is unwanted pigments which are produced normally during methanol induction phase. The pigmentation has a considerable impact on downstream purification process since the pigments may bind to the target proteins and reduce the loading capacity and effective life span of the capturing matrix. This leads to reduced yields and purity (19,20,21).
Despite many existing methods and strategies in production of recombinant hGH (r-hGH), there is still margin for significant improvement in various stages of its production process like removal of process contaminants, simpler and more efficient purification schemes, increased yield and overall cost effectiveness.
In our previous study, a mixed feed strategy using methanol and 50 g/L sorbitol showed a significant increase in the productivity of recombinant hGH (r-hGH) expressed in P. pastoris in which cell biomass reached 108 g/L (dry cell weight (DCW)), total protein was 0.807 g/L and r-hGH concentration was 0.667 g/L following 30 hours induction (22). In the present study we aimed to perform bioprocess optimization of r-hGH production in P. pastoris by addition of ascorbic acid. It has been reported that addition of antioxidant ascorbic acid may lead to higher recombinant protein yields by decreasing damage stress caused by reactive oxygen species. Therefore, optimization of methanol induction phase was conducted using methanol/sorbitol combined with three concentration of ascorbic acid to maximize the productivity of hGH. In order to understand the effect of sorbitol/ascorbic acid feeding strategies on production of hGH, cell density, total protein, and hGH concentration were analyzed and the results compared with the basic methanol feeding using one-way analysis of variance (ANOVA). Moreover, a simple and effective clarification process using activated carbon was optimized to reduce process related impurities such as pigments and endotoxin and increase the efficiency of downstream purification stages.
Furthermore, we established a simple and efficient three-step purification scheme consisting of anion-exchange, hydrophobic interaction (HIC) and cation-exchange chromatography. The purified r-hGH was analyzed for identity, purity and biological activity using appropriate techniques including size-exclusion (SEC) and reverse phase high performance liquid chromatography (RP-HPLC), capillary zone electrophoresis (CZE), and Nb2 cell based assay.
MATERIALS AND METHODS
Microorganism, inoculum, and media preparation
P. pastoris GS 115 strain Mut+ carrying hGH cDNA under the control of alcohol oxidase I (AOX1) which secretes the target protein into the fermentation broth was streaked from glycerol stock onto yeast extract peptone dextrose (YPD)-agar, containing: yeast extract (10 g/L), peptone (20 g/L), dextrose (20 g/L) and agar (20 g/L) and incubated for 48 h at 30 °C (22). A single colony was inoculated into buffered minimal glycerol medium (BMGY) medium containing 10 g/L yeast extract, 20 g/L peptone, 13.4 g/L yeast nitrogen base (YNB), 4 × 10⁻⁵ g/L biotin, 10 g/L glycerol and 0.1 M potassium phosphate buffer (23) and incubated at 30 °C in a shaker incubator at 150 rpm, until the culture reached an optical density (OD600) of 1-2.
Fermentation conditions
The fermentation process consisted of three steps. During the first step, cells were cultured in batches using a defined medium with glycerol as the carbon source to rapidly achieve high cell densities. In the second step, which was a glycerol-limited fed-batch process, is designed to increase biomass production and de-repress the methanol metabolic machinery. Finally in the induction phase, recombinant protein expression was induced by methanol/sorbitol under addition of different concentrations of ascorbic acid.
The culture obtained was used as inoculum for a 13 L fermenter containing 3 L of basal salts medium which consisted of glycerol (40 g/L), K2SO4 (18 g/L), MgSO4.7H2O (14.9 g/L), KOH (4.13 g/L), CaSO4 (0.9 g/L), and 27 mL H3PO4, plus 4.0 mL of a trace metal stock solution that consisted of CuSO4.5H2O (6 g/L), KI (0.09 g/L), MnSO4.H2O (3 g/L), H3BO3 (0.02 g/L), MoNa2O4.2H2O (0.20 g/L), CoCl2 (0.5 g/L), ZnCl2 (20 g/L), FeSO4·7H2O (65 g/L), biotin (0.2 g/L), and H2SO4 (5 mL/L) (23).
The 13 L bioreactor (Infors, Switzerland), had a working volume of 9.0-10.0 L and included temperature, pH, foam, stirring rate, feed inlet rate, and dissolved oxygen (DO) control systems. DO concentration was maintained above 20% air saturation at 400-700 rpm, using air and, when needed, enriching the inlet air with pure oxygen passing through a digital mass flow controller. Temperature was maintained constant at 30.0 ± 0.1 °C throughout the entire bioprocess. In the first two phases, the pH was set at 5.0 ± 0.2 and then in the production phase was lowered to 3.0 ± 0.2. The pH was maintained at the relevant values, by adding 25% ammonia solution.
Evaluation of the ascorbic acid concentration effect on r-hGH productivity
According to the fermentation protocol for both Mut+ and Muts strains of P. pastoris available from Invitrogen (25), the induction phase was performed with methanol feed containing 12 Pichia trace metal (PTM1) trace salts per liter of methanol. The feed rate was set to 3.65 mL/min/L as an initial fermentation volume for six h. Then, the feed rate was doubled to 7.3 mL/min/L initial fermentation volume. After 6 h, feed rate was further increased to 10.9 mL/min/L initial fermentation volume and maintained throughout the remainder of the fermentation up to 30 h.
To conduct a mixed feed strategy, sorbitol at concentration of 50 g/L and ascorbic acid at concentration of 5, 10, or 20 mmol were added in batch-wise mode into the medium at the beginning of the induction phase and methanol fed-batch was continued for 30 h in which the rate of methanol addition was increased stepwise during the first 12 h of production and then kept constant. To determine the optimal yeast growth profile and rhGH production, cell density, total protein concentration, and expression level of cultures grown using sorbitol/ascorbic acid were compared with methanol/sorbitol using ANOVA.
Clarification process step
Pigment-related contaminants generated during the methanol induction phase are one of the major challenges of heterologous protein production using P. pastoris expression system. Hence, subsequent to finding the optimal concentration of ascorbic acid, process optimization was focused on pigment removal. For this purpose, the fermentation broth was centrifuged at 14,000 rpm for 30 min (Sigma 8K10, Germany). The maximum absorbance of the pigment-containing supernatant fluids was then determined spectrophotometrically from 200 to 1000 nm. Then pharmaceutical grade activated carbon (Norit®, CN1) at concentrations of 0.25, 0.5, 1, 2, or 4% (W/V) were added to the supernatant. The mixtures were incubated for 30 min at 8-12 °C with constant stirring and samples were taken at time 0 and 30 min in sterile 50-mL tubes (Falcon®, BD) for further analysis. After incubation, the mixtures were centrifuged at 13,000 rpm for 10 min to precipitate the activated carbon, and the supernatant was filtered using 0.22 μm syringe filter (Minisart®, Sartorius). The efficiency of activated carbon in removal of pigments was evaluated by spectrophotometric reading at 450 nm. Moreover, the effect of activated carbon on endotoxin depletion was evaluated using chromogenic quantitative Limulus amoebocyte lysate (LAL) assay (Kinetic QCL, Lonza). Total protein concentration was determined before and after treatment using Bradford assay. Subsequent to finding the optimal concentration of activated carbon, the clarified supernatant was diafiltered against 10 volumes of 20 mM tris buffer using Millipore ProFlux M12 tangential flow filtration system and Pellicon® 2, 100 kDa, ultrafiltration cassette.
Protein purification
Following the clarification process, the sample with minimum pigment content was subjected to the purification process. The purification process was designed in three sequential steps including (A) weak anion exchange chromatography (I), (B) hydrophobic interaction chromatography, and (C) an additional strong anion exchange chromatography for final polishing. All purification steps were performed using AKTA purifier 100 (GE healthcare, Sweden).
Weak anion exchange chromatography
The first anion exchange chromatography step was conducted with an XK 50/60 column (GE healthcare, Sweden) packed with diethylaminoethyl (DEAE) Sepharose fast flow resin. The supernatant (1.5 L) was loaded on to a column that was equilibrated with 20 mM tris Buffer (pH 7.5). The column was washed with the equilibration buffer and eluted with a linear gradient of 80 to 300 mM tris-HCl buffer (pH 8.2) at a flow rate of 25 mL/min. The eluate was monitored at 280 nm and the active fractions were collected (approximately 2 L).
Hydrophobic interaction chromatography
The pooled DEAE fractions (about 2 L) was brought to a XK 50/40 column packed with phenyl Sepharose fast flow and washed and equilibrated in buffer B (50 mM tris, 2 mM EDTA, and 1.5 M NaCl pH 8) and 3 M ammonium sulfate as eluent. The volume of pooled fraction was about 900 mL.
Strong anion exchange chromatography
The XK 50/20 column for the second anion exchange chromatography was packed with Q Sepharose (50 cm × 25 cm). The column was eluted with a linear pH gradient of 5.0 to 8.2 at a flow rate of 20 mL/min. The concentration of purified hGH was increased to 2 mg/mL using 10 kDa polyethersulfone ultrafiltration system (Amicon, millpore).
Analytical methods
Cell density measurement
The OD of cell suspensions was measured at 600 nm. The wet cell weight (WCW, g/L) was used as a measure of cell density within the bioreactor. A 1-mL sample was centrifuged at 13,000 rpm for 5 minutes (Labnet, USA). The pellet was weighed and the supernatant was stored at 4 °C for further analysis. The DCW (g/L) was calculated using the following equation: DCW = 0.35 × WCW, which was obtained from a calibration curve prepared using 20 samples that were dried for 24 h at 105 °C.
Determination of total protein
The cell suspension was centrifuged at 13,000 rpm for 10 min. Since r-hGH was secreted into the culture media, the supernatant was used for the determination of total protein concentration by the Bradford assay using a UV/Vis spectrophotometer (PerkinElmer, USA), at 595 nm (26). Bovine serum albumin (BSA) was used as the standard protein for this measurement. The total protein concentration of each sample was then estimated from the constructed standard curve.
SDS-PAGE and densitometric analysis
To determine the expression level of r-hGH, sodium dodecyl sulfate polyacrylamide gel electrophoresis (SDS-PAGE) was performed in a Mini-Protean® 3 cell gel apparatus (Bio-Rad, USA) according to the method of Laemmli (27). The samples were dissolved in 10× sample buffer and incubated at 100 °C for 5 min. About 25 μL of each sample was loaded onto the gel of 15% resolving and 5% stacking gel with 0.75 mm thickness at a constant voltage of 100 V. After running, the gel was stained with Coomassie Brilliant Blue R250. Densitometric analysis of the SDS-PAGE gel was performed using TotalLab software (Nonlinear dynamics, USA).
Endotoxin test
To evaluate the effect of activated carbon on endotoxin depletion, LAL assay was performed before and after treatment. Endotoxin was detected using a commercially available system based on the kinetic chromogenic LAL-test (Kinetic QCL, Lonza). In the kinetic chromogenic LAL assay, a sample is mixed with the LAL substrate reagent, placed in an incubating plate reader at 37 ± 1 °C, and the absorbance at 405 nm of each well of the microplate is automatically monitored, using the initial absorbance reading of each well as its own blank. The reader determines the time required for the absorbance to increases 0.200 absorbance units. This time is termed reaction time which is inversely proportional to the amount of endotoxin present. The LAL reagent and the control standard endotoxin (CSE) were prepared by reconstituting the lyophilized vials according to the instructions contained in the Lonza manual. When conducting the test, five serial dilutions of the CSE, starting from 50 EU/mL, were prepared using water for bacterial endotoxin test (BET) as diluent to obtain final endotoxin concentrations of 0.005, 0.050, 0.5, and 5 EU/ mL. The samples were diluted 1:1000 and 1:2000 by water for BET.
Determination of recombinant human growth hormone concentration by ELISA
Concentration of hGH in the fermentation broth was measured by an enzyme-linked immunosorbent assay (ELISA) using a commercially available test kit (hGH ELISA, Roche) according to the manufacturer's protocols. hGH standards were prepared in 1:2 dilution steps from 400 to 12.5 pg/mL. Test samples were diluted in the range of standard concentrations. 200 μL of each standard and sample was added to the pre-coated wells and incubated for 1 h at 37 °C. Then the solution was removed thoroughly and the well rinsed 5 times with 250 μL of washing buffer for 30 s each. Following the washing step, 200 μL of a digoxigenin-labeled antibody was added to each well and incubated for 1 h at 37 °C. The washing step was repeated again and 200 μL of anti-digoxigenin-POD was added to each well and incubated for 1 hour at 37 °C. 200 μL of polymerized horse-radish peroxidase (POD) substrate was added into each well and incubated at 20 °C until color development. The absorbance of the sample was measured at 405 nm with a reference wavelength at 490 nm, using an ELISA reader (Spectrostar Nano, BMG, Germany). The standard curve was constructed by plotting the absorbance for the hGH standards on the y-axis versus the hGH standard concentrations on the x-axis.
Chromatographic analysis
Three types of chromatographic analysis were conducted to evaluate the quality of purified hGH. All methods were performed on an AKTA purifier 10 HPLC system (GE healthcare, USA) equipped with variable-wavelength detector according to the somatropin monograph 28). Somatropin chemical reference standard (CRS) batch number 3 (European Directorate for the Quality of Medicines, Strasbourg, France) with an assigned content of 3.86 mg of somatropin was used as the standard preparation. Each individual chromatogram was analyzed with Unicorn® 5 software (GE healthcare, USA).
Assay and determination of dimer and aggregates
SEC was used for detecting and quantifying hGH monomer, dimer, and aggregates. It was also used for assay and identification of hGH. The separating column was TSK gel G2000SWXL (7.8 mm I.D. x 30 cm, 5 μm; Tosoh®, Japan). The flow rate of the mobile phase was set at 0.6 mL/min. Separately equal volume (20 μL) of 1 mg/mL of test and standard preparations was injected. The UV wavelength was set at 214 nm. The diluent for growth hormone was 0.025 M phosphate buffer pH 7.0. The mobile phase was composed of 0.063 M phosphate buffer solution: 2-propanol (97:3) (28).
Determination of related protein impurities
RP-HPLC was used for identity confirmation and determination of the level of desamido hGH. The separating column was reverse phase butylsilyl silica C4 (4.6 mm I.D. x 25 cm, 5 μm, 300 Å pore size, Vydac 214ATP54, USA) and the column temperature was maintained at 45 °C. The flow rate of the mobile phase was set at 0.5 mL/min and the injection volume was 100 μL. The UV wavelength was set at 220 nm. The sample and standard preparations were diluted with 0.05 M tris-HCL buffer solution pH 7.5 to obtain a 2 mg/mL solution of hGH. The mobile phase was composed of 1-propanol and 0.05 M tris-HCL buffer solution pH 7.5 (30:71 V/V) (28).
Peptide mapping analysis
Peptide mapping was used for identification of purified hGH wherein the protein solution is treated with trypsin at neutral pH for a few hours, and the resulting peptides are separated by RP-HPLC. The separating column was reverse phase octylsilyl silica C18 (4.6 mm I.D. × 25 cm, 5 μm, 300 Å pore size, Vydac, USA). The flow rate of the mobile phase was set at 1.0 mL/min and the injection volume was 100 μL of the test or standard preparations. The detector wavelength was set at 214 nm. Enzymatic digestion was carried out with endoproteinase Glu-C from Staphylococcus aureus V8 (P6181, Sigma, USA). 2.0 mg/mL concentration of test or standard solutions were prepared by diluting with 0.05 M tris-HCL buffer solution pH 7.5. Enzymatic digestion was carried out by adding 30 μL of samples to 1 mg/mL of trypsin solution in 0.05 M tris-HCL buffer solution pH 7.5 followed by incubation in a water-bath at 37 °C for 4 h. The mobile phase was composed of (A) 0.1% (V/V) trifluoroacetic acid (TFA) and (B) 0.1% TFA in acetonitrile (V/V) (28). Volume of injection for both the test sample and the standard solution was 20 μL. Following the chromatographic separation, the profile of the chromatogram obtained from the test solution was compared with the standard solution.
Capillary zone electrophoresis
Capillary zone electrophoresis was used for characterization and evaluation of charged variants including cleaved forms and desamido hGH. The Agilent 7100 capillary electrophoresis system with Chemstation software version, were used for the purified analysis. Uncoated fused silica capillaries, 74.8 cm × 50 μm ID (70.1 cm to the detection window), from Agilent were used for the separation. The CZE experiments were performed in ammonium phosphate buffer 150 mM (19.81 g of (NH4)2HPO4 was dissolved in 950 mL MQ-H2O and titrated to pH 6.0 with ortho-Phosphoric acid 85% and MQ-H2O was added to 1000 mL). The individual experiments were performed at constant voltage (14 kV), giving a maximum current of 110 μA in the capillary. All samples were applied hydrodynamically by pressure (2 p.s.i. × 1 s). The washing procedure for the system between each run was as follows; rinsing with 0.1 M sodium hydroxide for 2 min and with the CZE buffer for 6 min. Absorbance was monitored at 200 nm (29).
Human growth hormone cell-based assay
Biological activity of purified hGH was evaluated by Nb2-11 cell proliferation assay. The rat T-lymphoma cell line, Nb2-11 cells (European Collection of Authenticated Cell Cultures, Cat No: 97041101, UK) were maintained in Fischer's medium (Wellgene, Daegu, Korea) supplemented with 10% fetal bovine serum (FBS) (Biowest, Nuaille´, France), 10% horse serum (Gibco/Invitrogen, Carlsbad, CA), and 1% penicillin-streptomycin (Gibco/Invitrogen) in a 37 °C humidified incubator containing 5% CO2. Cell proliferation was determined using 3-(4,5-dimethyl- thiazol-2-yl)-5-(3-carboxymethoxyphenyl)-2-(4-sulfophenyl)-2H-tetrazolium (MTS) assays (21). Briefly, cells were harvested, rinsed in culture medium without FBS, and then incubated for 48 h in 96-well plates at 20000 cells/mL (100 μL/well) in the presence of various amounts of purified hGH. Following incubation, 20 μL of the MTS reagent (Promega, WI, USA) was added to each well, and cells were incubated for 2 h. The absorbance was recorded on a microplate reader (Bio-Rad, CA, USA) at a wavelength of 490 nm. Cell numbers were determined using a standard curve plotted from a linear relationship between cell number and absorbance (30).
Statistical analysis
Statistical analysis was performed by GraphPad Prism 6.01 software (GraphPad software, La Jolla, USA). Data were analyzed by one-way ANOVA followed by Tukey's post hoc. Differences with P values of < 0.05 were regarded as significant.
RESULTS
Evaluation of the effect of ascorbic acid concentration on cell density
The effect of ascorbic acid concentration in methanol/sorbitol mixed-feed strategy on cell density was investigated during 30 h induction phase and the results obtained were compared with those of methanol/sorbitol. In the methanol/sorbitol fed-batch strategy cell density, as DCW, was 108.3 g/L. In the presence of ascorbic acid, cell density was found to be 128.5, 162.5, and 163.8 g/L at a concentration of 5, 10, and 20 mmol ascorbic acid, respectively. By increasing the concentration of ascorbic acid from 5 to 10 mmol at the beginning of methanol induction phase, a significant increase in cell density was observed. Since, there was no significant difference (P value > 0.05) between ascorbic acid at concentrations of 10 and 20 mmol, so, in terms of cell density a mixed feed containing 10 mmol ascorbic acid was considered as the optimal concentration. The effect of ascorbic acid substrate concentration on cell density is shown in Fig. 1.
Figure 1.
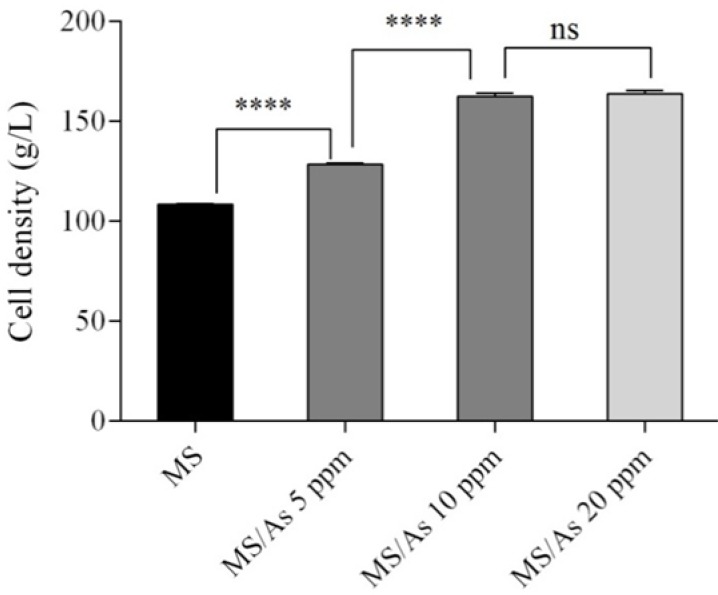
The effect of various ascorbic acid substrate concentrations on cell density. ****P < 0.0001; ns, non-significant, P = 0.6107.
Evaluation of the effect of ascorbic acid concentration on total protein and r-hGH concentration
The effect of ascorbic acid in the sorbitol/methanol feeding strategy on total protein concentration was also investigated. Addition of different concentrations of ascorbic acid resulted in significant (P value < 0.05) increase in total protein concentration in culture medium. According to the obtained results total protein concentration at 5, 10, and 20 mmol of ascorbic acid was 0.967, 1.14, and 1.24 g/L respectively. Statistical analysis using ANOVA revealed a significant difference (P value < 0.05) between the effect of ascorbic acid at concentrations of 5, 10, and 20 mmol on total protein concentration. In other words there is an increase in total protein concentration with an increase in the concentration of ascorbic acid in the range 5 to 20 mmol (Fig. 2).
Figure 2.
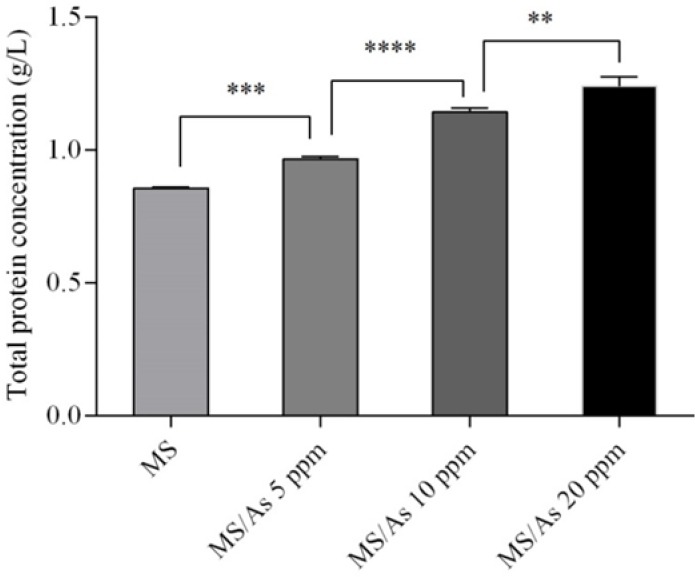
The effect of different concentrations of sorbitol on total protein determined using Bradford protein assay. **P = 0.0018, ***P = 0.0007, ****P < 0.0001.
The effect of ascorbic acid concentration in methanol/sorbitol mixed feeding strategy on the production of r-hGH was also investigated. The r-hGH concentration was 0.688, 0.798, 0.983, and 1.03 g/L respectively for methanol/sorbitol feeding and 5, 10, and 20 mmol of ascorbic acid concentration. Statistical analysis of different concentrations of r-hGH secreted into the culture medium at different concentrations of ascorbic acid, in comparison with methanol/sorbitol, showed significant difference in r-hGH concentration produced (Fig. 3). However, 10 mmol ascorbic acid was found to be the optimal concentration for induction, as beyond this, increasing the concentration of ascorbic acid did not lead to a significant increase in r-hGH concentration.
Figure 3.
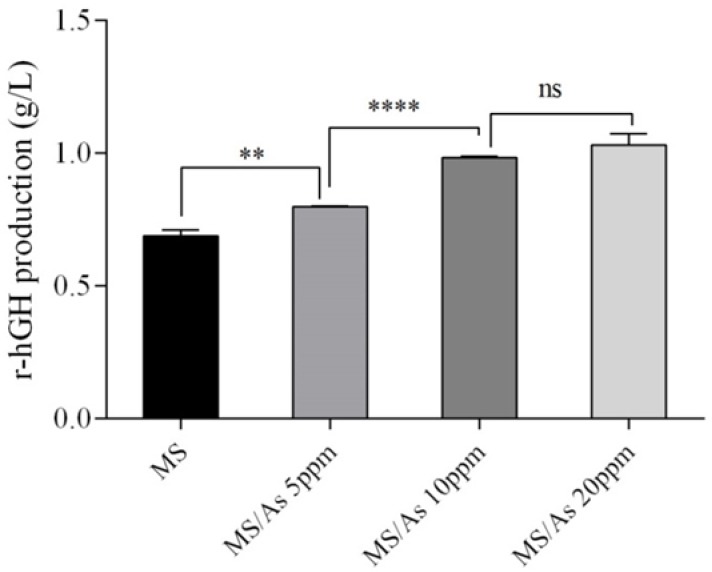
The effect of ascorbic acid concentration on r-hGH production. **P = 0.0029, **** P < 0.0001; ns, non-significant, P = 0.1929.
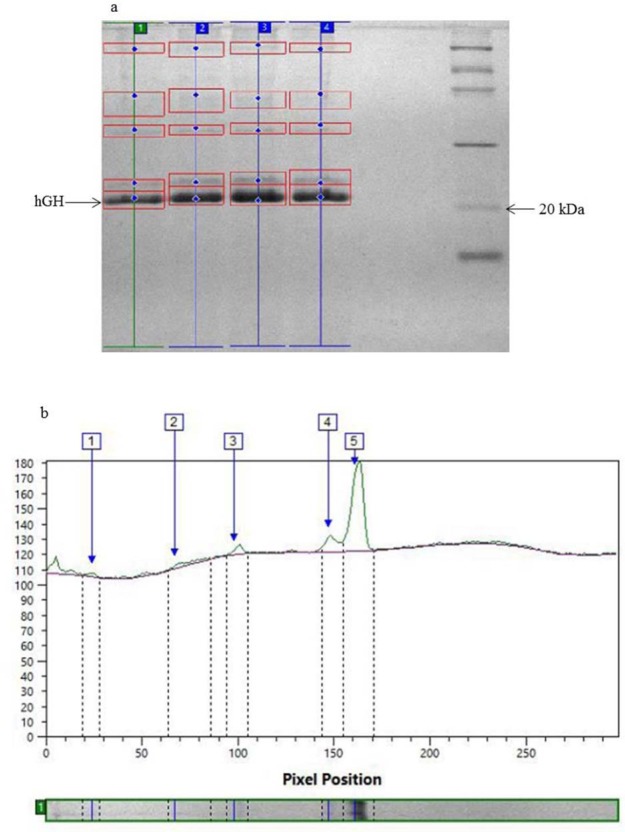
Since, as shown in Fig. 4, the ratio of r-hGH to total protein was the highest value at 10 mmol ascorbic acid and this ratio at 20 mmol ascorbic acid was decreased 10 mmol of ascorbic acid was considered as optimal concentration. Total protein and r-hGH concentration under optimal conditions reached 1.14 and 0.983 g/L, respectively which was approximately 1.33 and 1.43 folds higher than the concentrations obtained with the methanol/sorbitol induction. It should be mentioned that, under optimal conditions, the expression level reached 84.46% which was calculated by densitometric analysis of SDS-PAGE analysis of fermentation broth Fig. 5a and 5b. Fig. 5a shows protein expression of fermentation ran at concentration of 5, 10, and 20 mmol.
Figure 4.
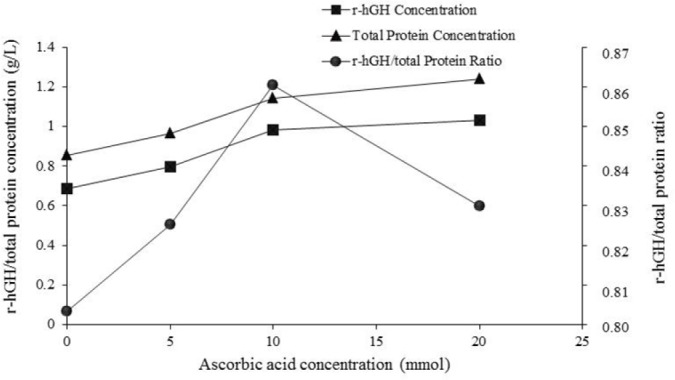
The effect of ascorbic acid concentration on total protein and r-hGH production and r-hGH to total protein ratio
Figure 5.
(a) The effect of various concentrations of ascorbic acid on the level of protein expression, lane 1: methanol/sorbitol mixed-feed strategy, lanes 2, 3, and 4: ascorbic acid 5, 10, and 20 mmol respectively, lane 5: LMW calibration kit for SDS electrophoresis (14.4-97 kDa). (b) Densitometric analysis of fermentation run under optimal condition (lane 3).
The effect of activated carbon treatment on the removal of pigments
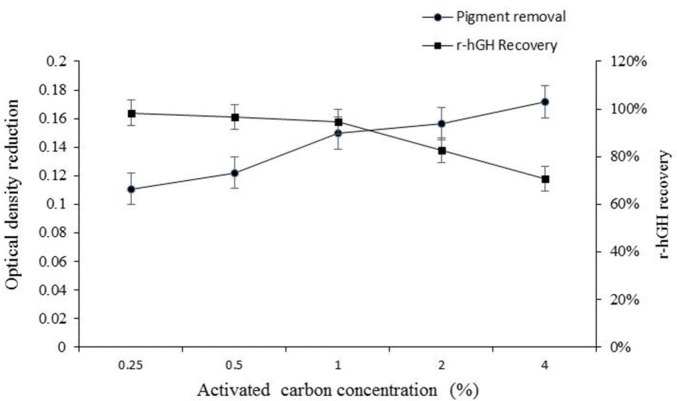
In this study, following the optimization of upstream processing, we developed a simple and rapid method for the removal of pigments using activated carbon. In order to test the efficacy of activated carbon in removal of pigments, pigment-containing supernatant was incubated with 0.25, 0.5, 1, 2, or 4% (W/V) of activated carbon. The effect of activated carbon on potential loss of r-hGH was evaluated using ELISA while pigment removal was determined spectrophotometrically. Since pigment-containing supernatant showed maximum absorbance (λ max) at 450 nm, the efficacy of active carbon was evaluated by measurement of OD450 which was 0.27 before treatment.
The OD reduction as a measure of the effectiveness of activated carbon for removing pigment was evaluated.
According to the obtained results, no statistically significant reduction in the amount of pigments was observed at concentrations of 0.25% and 0.5% activated carbon in comparison to before treatment. However, as shown in Fig. 6, by increasing the concentration of activated carbon from 1% to 4%, pigments decreased significantly. On the other hand, the results of r-hGH assay revealed that there was no significant reduction in r-hGH up to 1% concentration of activated carbon. By increasing the concentration of activated carbon beyond 1%, a significant reduction in r-hGH was observed, as the r-hGH assay was decreased 17.2% and 29.4% at concentrations of 2% and 4% of activated carbon, respectively (Fig.7). Therefore the results indicate that by increasing the concentration of activated carbon to 1% (V/W) a significant decrease in pigment content is obtained without any significant reduction in r-hGH assay.
Figure 6.
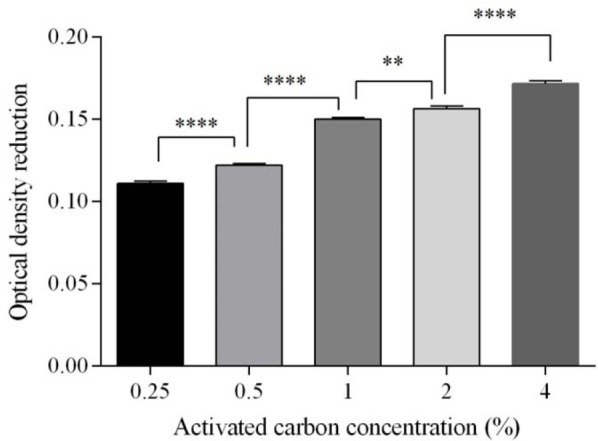
The effect of activated carbon concentration on pigment removal. **P = 0.0011, ****P < 0.0001.
Figure 7.
The effect of activated carbon concentration on pigment removal and r-hGH recovery
However, as there was a significant decrease in r-hGH assay at activated carbon concentrations beyond 1%, so, in terms of pigment removal, 1% concentration was considered as the optimal concentration.
The effect of activated carbon treatment on endotoxin depletion
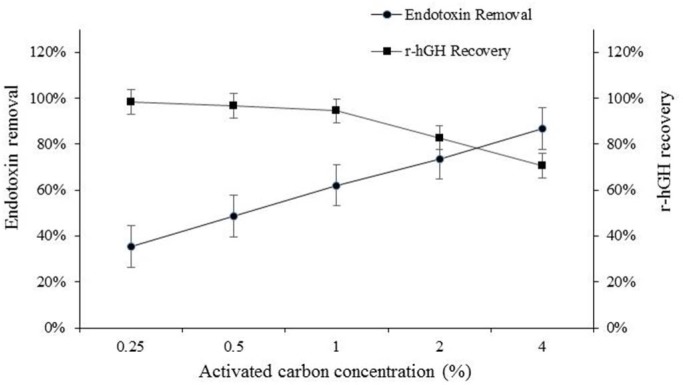
The effect of different concentrations of active carbon on endotoxin reduction was evaluated using chromogenic quantitative LAL assay. The results of this assay showed that endotoxin level in pigment-containing supernatant was about 560 EU. The effect of activated carbon on endotoxin depletion is illustrated in Fig. 8. As can be seen from the results, subsequent to the treatment with activated carbon, endotoxin was reduced by about 35.4%, 48.6%, 62.1%, 73.7%, and 86.8% at concentration of 0.25, 0.5, 1, 2, and 4%, respectively. Since, there was no significant reduction in r-hGH up to 1% concentration of activated carbon and considering the results of endotoxin and pigment contaminants removal, it can be concluded that treatment with 1% activated carbon is an effective and useful purification process. The chromatographic purification process was performed in three sequential steps: (A) anion exchange chromatography (I) to capture the target protein, (B) hydrophobic interaction chromatography that is to purify biologically active hGh, and (C) an additional anion exchange chromatography for final polishing.
Figure 8.
The effect of activated carbon treatment on endotoxin removal.
In the purification process, first, the hGH was captured by DEAE-Sepharose, then this fraction was subjected to phenyl Sepharose fast flow column for further purification. In this step, the hGH related proteins such as deamidated forms were removed. Also, a Q Sepharose anion exchange chromatographic step was applied for final polishing of the target protein.
Quality control of recombinant human growth hormone
Following completion of the final step of anion exchange chromatography purification, quality tests according to were carried out (28). For the test of related proteins, 5 mL samples were placed in sterile tubes. Using RP-HPLC, the quantity of related proteins of r-hGH were determined in normalization mode as the percentage of the peak area of r-hGH against the total peak area of all related proteins. The acceptance criteria for this test require protein purity of r-hGH in excess of 94%. According to the results obtained from RP-HPLC analysis, protein purity of our product was in excess of 98%, thereby fulfilling the acceptance criteria (Fig. 9).
Figure 9.
Shows the reverse phase high pressure liquid chromatography (RP-HPLC) chromatogram indicating the purity of recombinant human growth hormone (r-hGH) ≥ 98%.
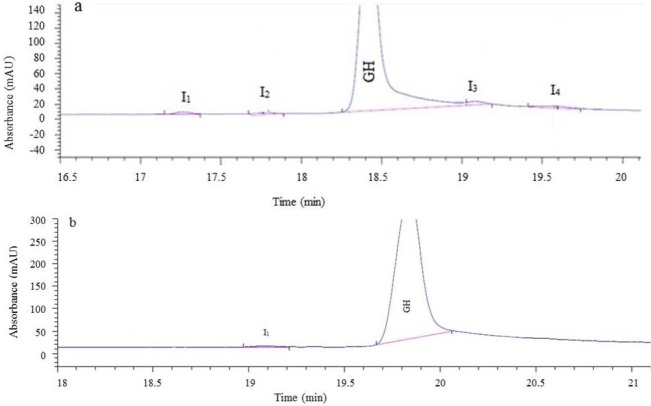
For the hGH assay, the area under the curve of hGH monomer peak was compared with somatropin CRS batch 3 by SEC. Fig. 10b shows the results of purified hGH assay which was 108% and meets the acceptance criteria (90-110%) of the assay in comparison with somatropin CRS batch 3 (Fig. 10a).
Figure 10.
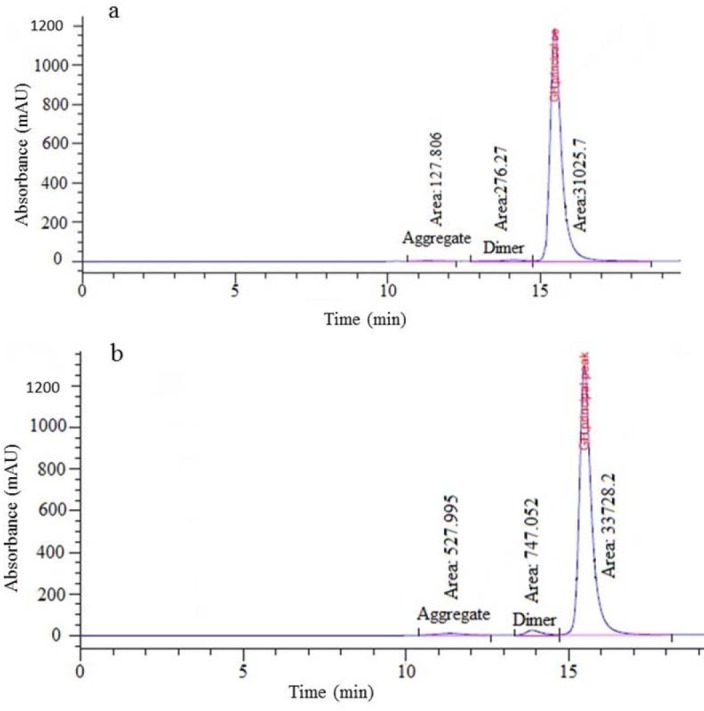
(a) Size-exclusion (SEC) chromatogram of chemical reference standard (CRS) Batch 3. (b) SEC chromatogram of purified recombinant human growth hormone (r-hGH).
The aggregated forms include dimers and the higher molecular weights of hGH, which were also measured by SEC. The hGH monomer protein content was shown to be 96.5% (Fig. 10b), thereby fulfilling the acceptance criteria (over 96%).
For identification, tryptic digestion of purified hGH and somatropin CRS was compared by RP-HPLC.
The peptide mapping analysis is illustrated in Fig. 11 and shows that purified hGH and somatropin CRS exhibited similar peptide fragments.
Figure 11.
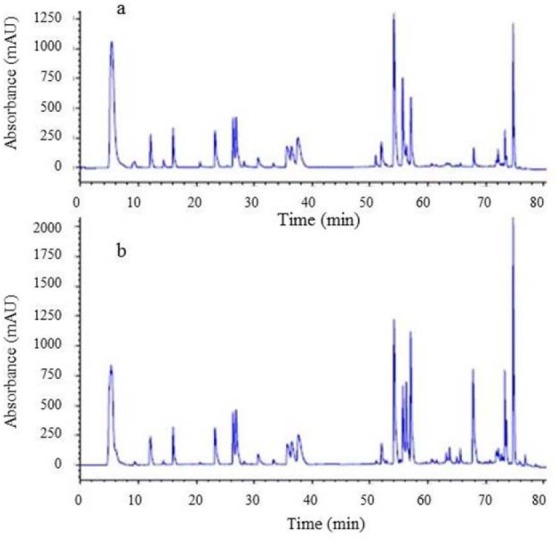
(a) Peptide mapping identification of purified recombinant human growth hormone (r-hGH). (b) Peptide mapping chromatogram of chemical reference standard (CRS) batch 3
Moreover, charged variants of hGH including cleaved forms and desamido were evaluated by CZE. The CZE electropherogram illustrated in Figs. 12a and 12b shows that in terms of charge variants, the purity of purified hGH was 99.46% which meets the acceptance criteria (≥ 89.5%) for this analysis.
Figure 12.
(a) Reference electropherogram of charged variants distribution of somatropin chemical reference standard (CRS) batch 3, (b) Electropherogram of purified recombinant human growth hormone (r-hGH) (1 mg/mL) shows the purity of greater than 99%, I = impurity. I1, I2 (cleaved form), I3 (Gln-18 somatropin), I4 (deamidated forms).
Furthermore, in vitro biological studies were performed using NB2-11 cells, whose growth and replication were stimulated by hGH. These data indicated that specific activity (activity per mg of protein) of purified hGH was 2.8 IU/mg. The specific activity of purified hGH should be equal or more than 2.5 IU/mg.
The result of LAL chromogenic assay showed that endotoxin level in our purified r-hGH was 0.65 EU which lies in the acceptable range of ≤ 5 EU per mg of r-hGH.
Table 1 is a summary of the quality tests and their acceptance criteria for hGH according to the British Pharmacopeia and the results of these tests for our rhGH.
Table 1.
Analytical quality tests, acceptance criteria and results obtained for purified recombinant human growth hormone (r-hGH)

DISCUSSION
The feeding strategy in MIP is one of the key factors for maximizing protein production which is directly or indirectly associated with cell growth. Methanol as both a substrate and inducer is toxic to the cell at high level and may not be adequate for protein expression at low level (31). Thus, different approaches have been proposed to optimize methanol induction phase. Previously, sorbitol as a non-repressive carbon source, has been found as the most promising component in a mixed-feed strategy with methanol and the benefits of methanol/sorbitol co-feeding with various strategies have been reported by other researchers (22,36,37,38,39,40,41). However, reactive oxygen species such as hydrogen peroxide and other peroxidated molecules, which need to be minimized to avoid cell damage, are produced during oxidation of methanol (32). It has been reported that adding antioxidant ascorbic acid may lead to higher recombinant protein yields by decreasing damage stress caused by reactive oxygen species and increasing the viability of P. pastoris cells as well as reducing the proteolytic degradation of heterologous proteins in cultures containing methanol (33,34). In the present study the effects of different concentrations of ascorbic acid on production of r-hGH in sorbitol/methanol mixed-feeding was investigated.
In our previous study using sorbitol/ methanol mixed feed strategy, the cell biomass achieved was 108 g/L (DCW), total protein 0.807 g/L and r-hGH concentration was 0.688 g/L. In the present study, the effect of different concentrations of ascorbic acid was examined. The results obtained indicated that addition of 10 mmol ascorbic acid with 50 g/L sorbitol at the beginning of the induction phase and continuing the induction with methanol for 30 h resulted in maximum biomass and r-hGH production. Under these optimal conditions the cell biomass achieved was 162.5 g/L (DCW), total protein 1.14 g/L, r-hGH expression level 84.46% and r-hGH concentration was 0.983 g/L. When the culture was supplied with 10 mmol ascorbic acid, the biomass was 1.7-fold, total protein 1.33 and r-hGH concentration 1.43 higher than that of methanol/sorbitol feeding strategy. In the sorbitol/methanol mixed-feed strategy reported by Celik et al. the highest rhGH production and cell concentration achieved was 0.64 g/L and 105 g/L, respectively. These results were obtained following 42 h induction time (35).
It is worth noting that these results were obtained following an induction time of 30 h which is considerably shorter in comparison to the previous studies. The shorter induction phase offers numerous advantages such as lower production cost, lower risk of protein degradation, control of process and product-related impurities and thereupon increasing the efficiency of purification processes.
Expression of recombinant protein in P. pastoris is concomitant with generation of pigment-related contaminants during methanol induction phase of fermentation. The level of these pigments is increased with increased methanol concentration (19). It was reported that AOX, at high concentrations, can form crystalloids with yellow-green color which are thought to be made inside the cell. AOX, while not a secreted enzyme, will give color to supernatant because of its constant leakage into the outside environment (42).
These pigments could bind to the resin of most chromatographic media and seriously affect the column lifespan. The pigments in the culture supernatant could also complicate the purification procedure because they are hard to quantify and analyze, as some of these pigments also bind to some of the proteins in the preparation (20,21).
Human growth hormone is composed of a very high density of nonpolar amino acids on the surface which makes it highly hydrophobic in nature. Because of this, growth hormone interacts with hydrophobic surfaces of other proteins. Moreover, Pichia expresses a large amount of AOX crystalloids, resulting in a strong possibility that growth hormone interacts with these crystalloids by multiple interactions which change the hydrophobic and charge properties of this protein (19). Therefore, several methods were employed to remove as much pigments as possible. One of the aims of the present study was to introduce a simplified and optimized clarification process to reduce pigment related impurities as much as possible. The results of the present study revealed that a certain grade of activated carbon could be used to selectively remove pigment from culture supernatant without any significant changes in r-hGH concentration. Activated carbon at concentration of 1% could reduce pigments significantly. Additionally, results obtained from this study revealed that activated carbon at concentration of 1% could reduce the endotoxin content of the product up to 62.1% without any depletion in hGH content.
CONCLUSION
The results of the present study demonstrated that addition of 10 mmol ascorbic acid in a methanol/sorbitol mixed feeding strategy could effectively increase the productivity of r-hGH. This may occur due to the antioxidant properties of ascorbic acid controlling reactive oxygen species levels, which, otherwise, could cause cell damage and then trigger excess protease production. The study also indicates that activated carbon is a successful alternate for efficient removal of endotoxin and pigment in production of recombinant proteins in the yeast expression systems especially P. pastoris. Therefore, its use can be adopted by the biopharmaceutical industry as a cost-effective and sustainable method of clarification of recombinant proteins from high cell density cultures of P. pastoris.
REFERENCES
- 1.Nguyen MT, Koo BK, Vu TTT, Song JA, Chong SH, Jeong B, et al. Prokaryotic soluble overexpression and purification of bioactive human growth hormone by fusion to thioredoxin, maltose binding protein, and protein disulfide isomerase. PLoS One. 2014;9(3):e89038. doi: 10.1371/journal.pone.0089038. [DOI] [PMC free article] [PubMed] [Google Scholar]
- 2.Cai Y, Xu M, Yuan M, Liu Z, Yuan W. Developments in human growth hormone preparations: sustained-release, prolonged half-life, novel injection devices, and alternative delivery routes. Int J Nanomedicine. 2014;9:3527–3538. doi: 10.2147/IJN.S63507. [DOI] [PMC free article] [PubMed] [Google Scholar]
- 3.Aulić S, Bolognesi ML, Legname G. Small-molecule theranostic probes: a promising future in neurodegenerative diseases. Int J Cell Biol 2013. 2013 doi: 10.1155/2013/150952. DOI: 10.1155/2013/150952. [DOI] [PMC free article] [PubMed] [Google Scholar]
- 4.Rudge P, Jaunmuktane Z, Adlard P, Bjurstrom N, Caine D, Lowe J, et al. Iatrogenic CJD due to pituitary-derived growth hormone with genetically determined incubation times of up to 40 years. Brain. 2015;138(11):3386–3399. doi: 10.1093/brain/awv235. [DOI] [PMC free article] [PubMed] [Google Scholar]
- 5.Ghavim M, Abnous K, Arasteh F, Taghavi S, Nabavinia MS, Alibolandi M, et al. High level expression of recombinant human growth hormone in Escherichia coli: crucial role of translation initiation region. Res Pharm Sci. 2017;12(2):168–175. doi: 10.4103/1735-5362.202462. [DOI] [PMC free article] [PubMed] [Google Scholar]
- 6.Ayyar VS. History of growth hormone therapy. Indian J Endocrinol Metab. 2011;15(Suppl3):S162–S165. doi: 10.4103/2230-8210.84852. [DOI] [PMC free article] [PubMed] [Google Scholar]
- 7.Rezaei M, Zarkesh-Esfahani SH. Optimization of production of recombinant human growth hormone in Escherichia coli. J Res Med Sci. 2012;17(7):681–685. [PMC free article] [PubMed] [Google Scholar]
- 8.Murasugi A. Secretory expression of human protein in the Yeast Pichia pastoris by controlled fermentor culture. Recent Pat Biotechnol. 2010;4(2):153–166. doi: 10.2174/187220810791110679. [DOI] [PubMed] [Google Scholar]
- 9.Weinacker D, Rabert C, Zepeda AB, Figueroa CA, Pessoa A, Farías JG. Applications of recombinant Pichia pastoris in the healthcare industry. Braz J Microbiol. 2013;44(4):1043–1048. doi: 10.1590/s1517-83822013000400004. [DOI] [PMC free article] [PubMed] [Google Scholar]
- 10.Ahmad M, Hirz M, Pichler H, Schwab H. Protein expression in Pichia pastoris: recent achievements and perspectives for heterologous protein production. Appl Microbiol Biotechnol. 2014;98(12):5301–5317. doi: 10.1007/s00253-014-5732-5. [DOI] [PMC free article] [PubMed] [Google Scholar]
- 11.Rabert C, Weinacker D, Pessoa A, Farías JG. Recombinants proteins for industrial uses: utilization of Pichia pastoris expression system. Braz J Microbiol. 2013;44(2):351–356. doi: 10.1590/S1517-83822013005000041. [DOI] [PMC free article] [PubMed] [Google Scholar]
- 12.Weidner M, Taupp M, Hallam SJ. Expression of recombinant proteins in the methylotrophic yeast Pichia pastoris. J Vis Exp. 2010;36:1862. doi: 10.3791/1862. DOI:10.3791/1862. [DOI] [PMC free article] [PubMed] [Google Scholar]
- 13.Cregg JM, Vedvick TS, Raschke WC. Recent advances in the expression of foreign genes in Pichia pastoris. Biotechnology (N Y) 1993;1(8):905–910. doi: 10.1038/nbt0893-905. [DOI] [PubMed] [Google Scholar]
- 14.Noseda DG, Recúpero MN, Blasco M, Ortiz GE, Galvagno MA. Cloning, expression and optimized production in a bioreactor of bovine chymosin B in Pichia (Komagataella) pastoris under AOX1 promoter. Protein Expr Purif. 2013;92(2):235–244. doi: 10.1016/j.pep.2013.08.018. [DOI] [PubMed] [Google Scholar]
- 15.Gellissen G. Heterologous protein production in methylotrophic yeasts. Appl Microbiol Biotechnol. 2000;54(6):741–750. doi: 10.1007/s002530000464. [DOI] [PubMed] [Google Scholar]
- 16.Higgins DR, Cregg JM. Introduction to Pichia pastoris. Methods Mol Biol. 1998;103:1–15. doi: 10.1385/0-89603-421-6:1. [DOI] [PubMed] [Google Scholar]
- 17.Jozala AF, Geraldes DC, Tundisi LL, Feitosa VA, Breyer CA, Cardoso SL, et al. Biopharmaceuticals from microorganisms: from production to purification. Braz J Microbiol. 2016;47(Suppl 1):51–63. doi: 10.1016/j.bjm.2016.10.007. [DOI] [PMC free article] [PubMed] [Google Scholar]
- 18.Fortis F, Guerrier L, Righetti PG, Antonioli P, Boschetti E. A new approach for the removal of protein impurities from purified biologicals using combinatorial solid-phase ligand libraries. Electrophoresis. 2006;27(15):3018–3027. doi: 10.1002/elps.200500847. [DOI] [PubMed] [Google Scholar]
- 19.Minyasab SA, Dhamane SP, Hazra P, Iyer H. A method of purifying human growth hormone and purified growth hormone thereof. Pub. No: WO/2010/134084. International Application No: PCT/IN2009/000380. Google Patents. 2010 [Google Scholar]
- 20.Whittaker MM, Whittaker JW. Characterization of recombinant barley oxalate oxidase expressed by Pichia pastoris. J Biol Inorg Chem. 2002;7(1-2):136–145. doi: 10.1007/s007750100281. [DOI] [PubMed] [Google Scholar]
- 21.Hao J, Xu L, He H, Du X, Jia L. High-level expression of Staphylococcal Protein A in Pichia pastoris and purification and characterization of the recombinant protein. Protein Expr Purif. 2013;90(2):178–185. doi: 10.1016/j.pep.2013.06.005. [DOI] [PubMed] [Google Scholar]
- 22.Azadi S, Mahboubi A, Naghdi N, Solaimanian R, Mortazavi SA. Evaluation of sorbitol-methanol co-feeding strategy on production of recombinant human growth hormone in Pichia pastoris. Iran J Pharm Res. 2017;16(4):1555–1564. [PMC free article] [PubMed] [Google Scholar]
- 23.Huang J, Barent R, Inan M, Gouthro M, Roxas PV, Smith LA, et al. Purification of the N- and C- terminal subdomains of recombinant heavy chain fragment C of botulinum neurotoxin serotype C. Methods Mol Biol. 2007;389:77–98. doi: 10.1007/978-1-59745-456-8_6. [DOI] [PubMed] [Google Scholar]
- 24.Lee CY, Lee SJ, Jung KH, Katoh S, Lee EK. High dissolved oxygen tension enhances heterologous protein expression by recombinant Pichia pastoris. Process Biochem. 2003;38(8):1147–1154. [Google Scholar]
- 25.Invitrogen Co. Pichia Fermentation Process Guidelines. San Diego, CA: 2002. [Google Scholar]
- 26.Bradford MM. A rapid and sensitive method for the quantitation of microgram quantities of protein utilizing the principle protein dye binding. Anal Biochem. 1976;72:248–254. doi: 10.1016/0003-2697(76)90527-3. [DOI] [PubMed] [Google Scholar]
- 27.Laemmli UK. Cleavage of structural proteins during the assembly of the head of bacteriophage T4. Nature. 1970;227:680–685. doi: 10.1038/227680a0. [DOI] [PubMed] [Google Scholar]
- 28.British Pharmacopoeia Commission, British Pharmacopoeia, Monograph on Somatropin, Her Majesty's Stationery Office. London, UK: TSO; 2013. [Google Scholar]
- 29.Wilhelmsen TW, Skibeli V, Arntzen FC. Stability study of somatropin by capillary zone electrophoresis. Procedia Chem. 2010;2(1):34–45. [Google Scholar]
- 30.Kim MJ, Park HS, Seo KH, Yang HJ, Kim SK, Choi JH. Complete solubilization and purification of recombinant human growth hormone produced in Escherichia coli. PLoS One. 2013;8(2):e56168. doi: 10.1371/journal.pone.0056168. [DOI] [PMC free article] [PubMed] [Google Scholar]
- 31.Sreekrishna K. Gene Expression in Pichia and Other Methylotroph yeast. In: Flickinger MC, editor. Upstream Industrial Biotechnology. Vol. 2. New Jersey: Wiley; 2013. p. 203. [Google Scholar]
- 32.Ferrer P, Valero F. Coping with Physiological Stress During Recombinant Protein Production by Bioreactor Design and Operation. In: Mandenius CF, editor. Bioreactors: Design, Operation and Novel Applications. Weinheim: Wiley-VCH; 2016. p. 243. [Google Scholar]
- 33.Vanz AL, Lünsdorf H, Adnan A, Nimtz M, Gurramkonda C, Khanna N, et al. Physiological response of Pichia pastoris GS115 to methanol-induced high level production of the Hepatitis B surface antigen: catabolic adaptation, stress responses, and autophagic processes. Microb Cell Fact. 2012;11:103–113. doi: 10.1186/1475-2859-11-103. [DOI] [PMC free article] [PubMed] [Google Scholar]
- 34.Xiao A, Zhou X, Zhou L, Zhang Y. Improvement of cell viability and hirudin production by ascorbic acid in Pichia pastoris fermentation. Appl Microbiol Biotechnol. 2006;72(4):837–844. doi: 10.1007/s00253-006-0338-1. [DOI] [PubMed] [Google Scholar]
- 35.Çalık P, Bozkurt B, Zerze GH, İnankur B, Bayraktar E, Boy E, et al. Effect of co-substrate sorbitol different feeding strategies on human growth hormone production by recombinant Pichia pastoris. J. Chem. 2013;88(9):1631–1640. [Google Scholar]
- 36.Ramon R, Ferrer P, Valero F. Sorbitol co-feeding reduces metabolic burden caused by the overexpression of a Rhizopus oryzae lipase in Pichia pastoris. J Biotechnol. 2007;130:39–46. doi: 10.1016/j.jbiotec.2007.02.025. [DOI] [PubMed] [Google Scholar]
- 37.Celik E, Calik P, Oliver SG. Fed-batch methanol feeding strategy for recombinant protein production by Pichia pastoris in the presence of cosubstrate sorbitol. Yeast. 2009;26(9):473–484. doi: 10.1002/yea.1679. [DOI] [PubMed] [Google Scholar]
- 38.Wang Z, Wang Y, Zhang D, Li J, Hua Z, Du G, et al. Enhancement of cell viability and alkaline polygalacturonate lyase production by sorbitol cofeeding with methanol in Pichia pastoris fermentation. Bioresour Technol. 2010;101(4):1318–1323. doi: 10.1016/j.biortech.2009.09.025. [DOI] [PubMed] [Google Scholar]
- 39.Zhu T, You L, Gong F, Xie M, Xue Y, Li Y, et al. Combinatorial strategy of sorbitol feeding and low-temperature induction leads to high-level production of alkaline beta-mannanase in Pichia pastoris. Enzyme Microb Technol. 2011;49(4):407–412. doi: 10.1016/j.enzmictec.2011.06.022. [DOI] [PubMed] [Google Scholar]
- 40.Gao MJ, Li Z, Yu RS, Wu JR, Zheng ZY, Shi ZP, et al. Methanol/ sorbitol co-feeding induction enhanced porcine interferon-alpha production by P. pastoris associated with energy metabolism shift. Bioprocess Biosyst Eng. 2012;35(7):1125–1136. doi: 10.1007/s00449-012-0697-1. [DOI] [PubMed] [Google Scholar]
- 41.Niu H, Jost L, Pirlot N, Sassi H, Daukandt M, Rodriguez C, et al. A quantitative study of methanol/sorbitol co-feeding process of a Pichia pastoris Mut+/pAOX1-lacZ strain. Microb Cell Fact. 2013;12:33–40. doi: 10.1186/1475-2859-12-33. [DOI] [PMC free article] [PubMed] [Google Scholar]
- 42.Damasceno LM, Pla I, Chang HJ, Cohen L, Ritter G, Old LJ, et al. An optimized fermentation process for high-level production of a single-chain Fv antibody fragment in Pichia pastoris. Protein Expr Purif. 2004;37:18–26. doi: 10.1016/j.pep.2004.03.019. [DOI] [PubMed] [Google Scholar]


