Abstract
Seed yield and quality of crop species are significantly reduced by water deficit. Stable isotope screening (δ13C) of a diversity set of 147 accessions of Brassica napus grown in the field identified several accessions with extremes in water use efficiency (WUE). We next conducted an investigation of the physiological characteristics of selected natural variants with high and low WUE to understand how these characteristics translate to differences in WUE. We identified an interesting Spring accession, G302 (Mozart), that exhibited the highest WUE in the field and high CO2 assimilation rates coupled with an increased electron transport capacity (Jmax) under the imposed conditions. Differences in stomatal density and stomatal index did not translate to differences in stomatal conductance in the investigated accessions. Stomatal conductance response to exogenous ABA was analyzed in selected high and low WUE accessions. Spring lines showed little variation in response to exogenous ABA, while one Semi-Winter line (SW047) showed a significantly more rapid response to exogenous ABA, that corresponded to the high WUE indicated by δ13C measurements. This research illustrates the importance of examining natural variation at a physiological level for investigation of the underlying mechanisms influencing the diversity of carbon isotope discrimination values in the field and identifies natural variants in B. napus with improved WUE and potential relevant traits.
Keywords: ABA, Brassica, Drought, Gas exchange, Stomatal conductance
Introduction
Plants are exposed to a variety of environmental stresses, including drought, temperature and salinity. The ability to cope with these stresses has a profound impact on crop productivity, with grain and seed crops losing more than half of their theoretical yield when exposed to an unfavorable environment (Boyer 1982). The resulting decrease in crop yields translates to an economic loss and also contributes to global food insecurity. Unfortunately, both the severity and frequency of drought episodes are likely to increase as global climate change affects average global temperature and fresh water reserves are depleted (Trenberth et al. 2014).
The shortage of fresh water is exacerbated by both the increasing world population and global climate change. As agricultural activities account for nearly 70% of the world’s fresh water consumption, global water deficits threaten crop productivity (WWAP (United Nations World Water Assessment Programme) 2015). There is a clear need to better understand the mechanisms that underlie natural variation in plant physiology and drought tolerance. Plants have developed a variety of coping strategies to acclimate and adapt to drought stress: drought escape, dehydration avoidance and dehydration tolerance (Ludlow and Muchow 1990). Plants can avoid dehydration by maintaining their internal water status during periods of drought by modulating water uptake through the roots (Passioura 1983, Pinheiro et al. 2005) and/or minimizing water loss through evapotranspiration by controlling stomatal conductance (Davies et al. 2002). There has been a wealth of detailed research on stomatal development and regulation in the model species Arabidopsis thaliana. Identification of core components of the ABA signal transduction pathway in Arabidopsis has greatly increased our understanding of plant responses to environmental stress (Cutler et al. 2010, Hauser et al. 2011). Here we investigate the physiological characteristics that contribute to natural variation in water use efficiency (WUE) in Brassica napus, a close relative of Arabidopsis (Noh and Amasino 1999, Parkin et al. 2005).
In terms of global production, B. napus is one of the most economically important oilseed crops for both feed stocks and fuel (FAO, 2015). Recent investigations into the evolution of B. napus have shown multiple allotetraploid origins of B. napus from hybridization of the diploid progenitors Brassica rapa and Brassica oleracea, resulting in genetic and phenotypic diversity (Allender and King 2010). When exposed to water stress during flowering and seed setting, there is a reduction in seed yield and quality (Bouchereau et al. 1996, Champolivier and Merrien 1996, Jensen et al. 1996). Crucial mechanisms and genetic loci involved in phenotypic differences may be identified by exploring natural variation between accessions of a species (Donovan and Ehleringer 1994, Barbour et al. 2010). Examining the differences in WUE between diverse accessions of B. napus is needed to develop improved understanding of the physiological basis of variations between accessions (Zhu et al. 2016).
WUE can be defined at different scales, with integrative whole-plant WUE defined as the ratio of total biomass to evapotranspiration. Intrinsic WUE can be measured at the leaf level as the ratio of photosynthetic CO2 assimilation to transpiration. Carbon isotope discrimination (δ13C) is used as a surrogate for direct measurement of WUE, as discrimination against 13C during photosynthesis decreases with increased water stress (Farquhar and Richards 1984).
Here we utilized stable carbon isotope screening (δ13C) on a subset of 147 lines from a diversity set of 500+ accessions of field-grown B. napus to identify natural variation in WUE. Accessions showing predicted extremes in WUE, based on δ13C data, were chosen for a detailed study of gas exchange. Using infrared gas analyzer measurements on greenhouse-grown plants, we measured photosynthetic CO2 assimilation (A), stomatal conductance (gs) and transpiration rate (E) of selected accessions. We also examined differences in stomatal index and density between accessions, and the responsiveness of stomatal closure to ABA exposure. We determined that correlation of transpiration efficiency (TE) with the WUE determined by δ13C data varied by accession, with the Spring accession G302 showing an enhanced electron transport capacity and enhanced WUE based on δ13C analysis of field-grown plants, indicating that A could be a mechanism contributing to WUE in these B. napus accessions. We also determined differences in physiological responses between Spring-type (G) and Semi-Winter-type (SW) accessions.
Results
Leaf carbon isotope discrimination varies in field-grown plants
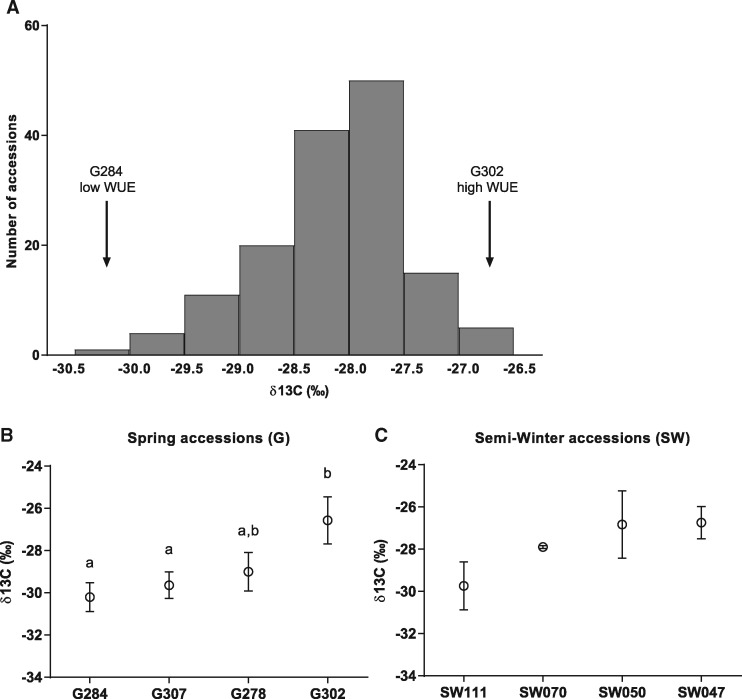
We grew 147 accessions of B. napus, including both Spring (G) and Semi-Winter (SW) lines and both oilseed and fodder types to screen for natural variation in WUE. Plants were grown in February 2013 in the field in Maricopa, Arizona, under irrigation. Leaf tissue was collected in April 2013, prior to flowering, to measure the carbon isotope ratio (δ13C), which is used as a time-integrated measure of WUE (Farquhar and Richards 1984, Seibt et al. 2008, Easlon et al. 2014). Substantial variation was found in δ13C between the 147 investigated accessions, with a range between the extreme accessions of –30.5 ‰ (G284 Tribute) and –26.5‰ (G302 Mozart) (Fig. 1A; Supplementary Table S1). From these field data, eight extreme accessions were chosen (four each from G and SW accessions) representing the range of δ13C values, for further physiological characterizations (Fig. 1B, C). In the G accessions, G284 showed the lowest projected WUE, with a δ13C value of –30.5‰, and G302 (Mozart) had the highest projected WUE, with a δ13C value of –26.5‰ (Fig. 1B). The SW accessions had a smaller range of variation than the G accessions, with SW111 having the lowest WUE with an average δ13C value of –29.7‰ and SW047 having the highest WUE with a δ13C value of –26.7‰ (Fig. 1C).
Fig. 1.
Leaf carbon isotope discrimination (δ13C) in field-grown plants. Diverse Spring (G) and Semi-Winter (SW) accessions of Brassica napus were grown in the field in Maricopa, Arizona, under irrigation. (A) Leaf tissue was collected prior to flowering, and δ13C was measured. A wide variation in δ13C was found between accessions. (B, C) δ13C of selected accessions including accessions with higher water use efficiency (G302) and lower water use efficiency (G284). Error bars denote the SEM. Statistical values for differences within categories were calculated using a one-way ANOVA followed by Tukey’s multiple comparisons test.
Gas exchange analyses
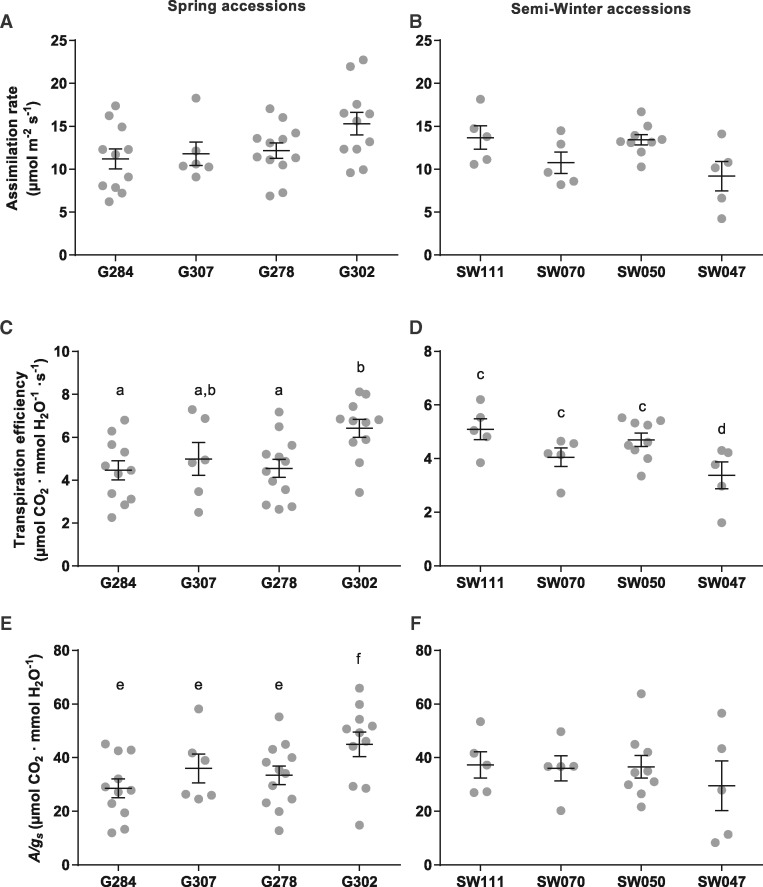
Instantaneous TE describes the ratio of the photosynthetic CO2 assimilation rate to transpiration. Physiological characterizations of the accessions were performed to investigate whether differences in gas exchange regulation among the various accessions contribute to differences in δ13C values. Steady-state gas exchange measurements were recorded under ambient CO2 (400 p.p.m.) and light (500 µmol photons m−2 s−1) conditions to compare variation in CO2 assimilation rates (A) and TE. The average photosynthetic CO2 assimilation rates showed little variation between lines, with the exception of line G302, which showed a slightly higher assimilation on average. The SW line SW047 had a lower average CO2 assimilation rate (Fig. 2B) as compared with other SW lines; however, this difference was not significant. These assimilation rates translated into similar TE comparisons (Fig. 2C, D), with G302 having a high TE which corresponds to the high photosynthetic CO2 assimilation rate (Fig. 2A) and may contribute to the high WUE (Fig. 1). Intrinsic WUE was calculated as the relationship between A and gs (Fig. 2E, F). A/gs values in G lines showed a similar trend to TE, with line G302 having a higher A/gs value as compared with other G lines (Fig. 2E). SW lines did not demonstrate significant differences in A/gs values (Fig. 2F).
Fig. 2.
Physiological responses of B. napus under ambient conditions. Photosynthetic assimilation rates of Spring accessions (A) and Semi-Winter accessions (B) were recorded under ambient CO2 (400 p.p.m.) and light (PAR 500 µmol photons m−2 s−1) conditions. (C, D) Instantaneous transpiration efficiency was calculated as the ratio of photosynthetic CO2 assimilation rate to transpiration rate. (E, F) Intrinsic transpiration efficiency was calculated as the ratio of photosynthetic CO2 assimilation rate to stomatal conductance. Error bars denote the SEM. Statistical values for differences within categories were calculated using a one-way ANOVA followed by Tukey’s multiple comparisons test.
To examine whether the accessions indicate differences in biochemical limitations to photosynthesis, we examined the relationship between the photosynthetic CO2 assimilation rate and calculated internal partial pressure of CO2 in the substomatal cavity (Ci) under saturating light. This relationship is described by a biochemical model (Farquhar et al. 1980) wherein CO2 assimilation is limited by the ribulose-1,5-bisphosphate (RuBP)-saturated rate of Rubisco carboxylation under low CO2 concentrations and by the rate of RuBP regeneration under high CO2 concentrations (Fig. 3A, B). Using this model, we calculated estimates of the maximum Rubisco carboxylation rates (Vcmax) and electron transport rates (Jmax) which are related to the initial slope and plateau, respectively, of the curves in Fig. 3A and B (Table 1). In the G accessions (Fig. 3A), the high photosynthetic assimilation rate (A) of accession G302 correlated with a higher Jmax than other G accessions (Table 1). Differences in the SW accessions showed that SW070 had lower CO2 assimilation rates (Fig. 3B), as well as lower Vcmax and Jmax values than other SW accessions (Table 1).
Fig. 3.
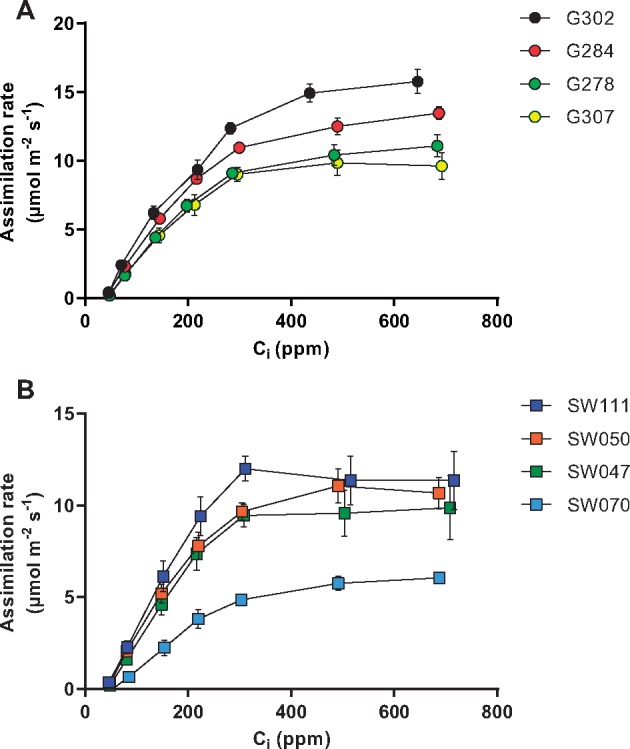
Analyses of CO2 assimilation rates as a function of Ci. Relationships between photosynthetic CO2 assimilation rate, measured under saturating light, and internal partial pressure of CO2 in the substomatal cavity for (A) Spring accessions and (B) Semi-Winter accessions. Error bars denote the SEM, n = 3.
Table 1.
Maximum Rubisco carboxylation rates (Vcmax) and electron transport capacity (Jmax) derived from the theoretical relationships shown in Fig. 3
| Genotype | Vcmax (µmol C m–2 s–1) | Jmax (µmol e– m–2 s–1) |
|---|---|---|
| G278 | 54.48866 | 105.1209 |
| G284 | 64.16738 | 95.89537 |
| G302 | 86.66855 | 126.1483 |
| G307 | 53.47971 | 90.8347 |
| SW047 | 46.65277 | 91.00118 |
| SW050 | 31.64616 | 69.4256 |
| SW070 | 32.37564 | 49.6159 |
| SW111 | 52.05389 | 94.35183 |
Parameters were estimated according to the method of Sharkey et al. (2007) by fitting the model to measured A/Ci values.
Values were normalized to 25°C leaf temperature.
Effect of stomatal characteristics on transpiration efficiency
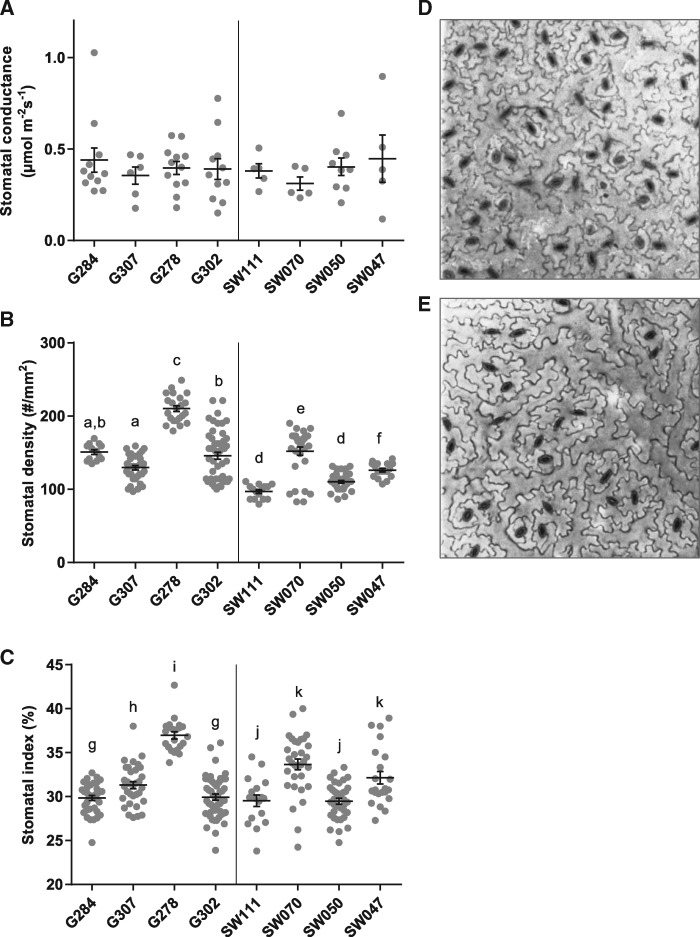
To determine if any differences in stomatal characteristics affected TE, we investigated gs between accessions. A similar average range of gs was found in all lines (Fig. 4A). Stomatal density (number of stomata mm–2) and stomatal index (number of stomata/total epidermal cells) were measured for the abaxial epidermis of each line (Fig. 4B, C). Lines G278 and SW070 both had significantly greater average stomatal densities and stomatal indices than other accessions (Fig. 4B, C). Neither high stomatal density, as found in G278 (Fig. 4D), nor lower stomatal density, as found in SW111 (Fig. 4E), translated to a difference in gs (Fig. 4A).
Fig. 4.
Effect of stomatal features on transpiration efficiency. (A) Steady-state stomatal conductance calculated from gas exchange measurements on mature leaves. (B) Stomatal densities (abaxial epidermis). (C) Stomatal index (abaxial epidermis). Error bars denote the SEM. Statistical values for differences within categories were calculated using a one-way ANOVA followed by Tukey’s multiple comparisons test. (D, E) Examples of stomatal densities (D: G278, high stomatal density; E: SW111, low stomatal density). Confocal images of abaxial epidermis stained with propidium iodide.
Relationship between δ13C and transpiration efficiency
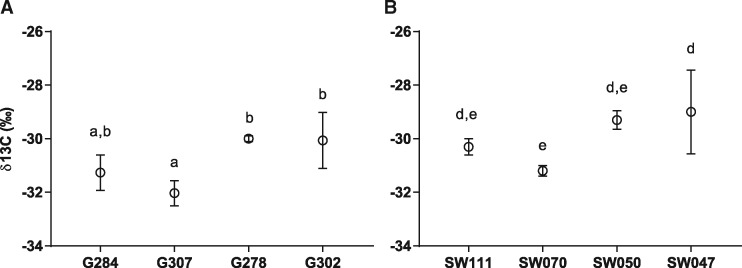
The instantaneous TE calculated from the ratio of photosynthetic CO2 assimilation rates to transpiration rates was compared with the δ13C of field-grown plants. In the G accessions, the higher δ13C value (high WUE) of G302 (Mozart) (Fig. 1) was in line with an increased TE (Fig. 5A). The SW lines showed a possible negative trend between δ13C and TE. As TE is directly related to the CO2 assimilation rate, this suggests that the δ13C value in the SW lines is related to traits other than CO2 assimilation and transpiration rates. Experiments with these lines, where plants were grown in the field under well-watered or non-irrigated conditions, suggests that field-derived δ13C values may also be translated into crop performance under limited irrigation conditions for the G302 accession (Supplementary Fig. S1). As the plants were grown in very different conditions in the growth room as compared with the field, we measured δ13C values of growth room plants used in the physiological assays (Fig. 6A, B). In these experiments, the intermediate WUE line G307 showed average δ13C values that are lower than the high WUE lines G278 and G302 (Fig. 6A, P < 0.05). Line SW070 showed average δ13C values lower than the high WUE lines SW050 and SW047 (Fig. 6B, P < 0.05). Notably, the difference in δ13C values were not as pronounced in the chamber-grown plants compared with field-grown plants.
Fig. 5.
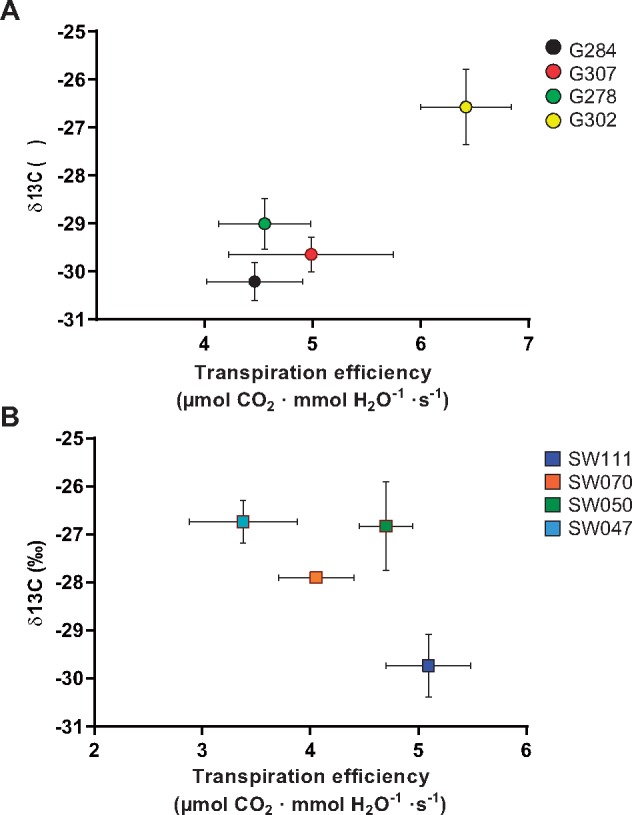
Relationship between δ13C and calculated transpiration efficiency. (A) Spring lines show a positive trend between δ13C and transpiration efficiency determined by the ratio of photosynthetic assimilation and transpiration rate (r2 = 0.866). (B) Semi-Winter lines did not show a positive trend.
Fig. 6.
δ13C values of walk-in growth room plants. Carbon isotope data were collected for plants grown in the growth room. (A) Spring lines. (B) Semi-Winter lines (means ± SEM; n = 3). Statistical values for differences within categories were calculated using a one-way ANOVA followed by Tukey’s multiple comparisons test.
Stomatal conductance response to exogenous ABA
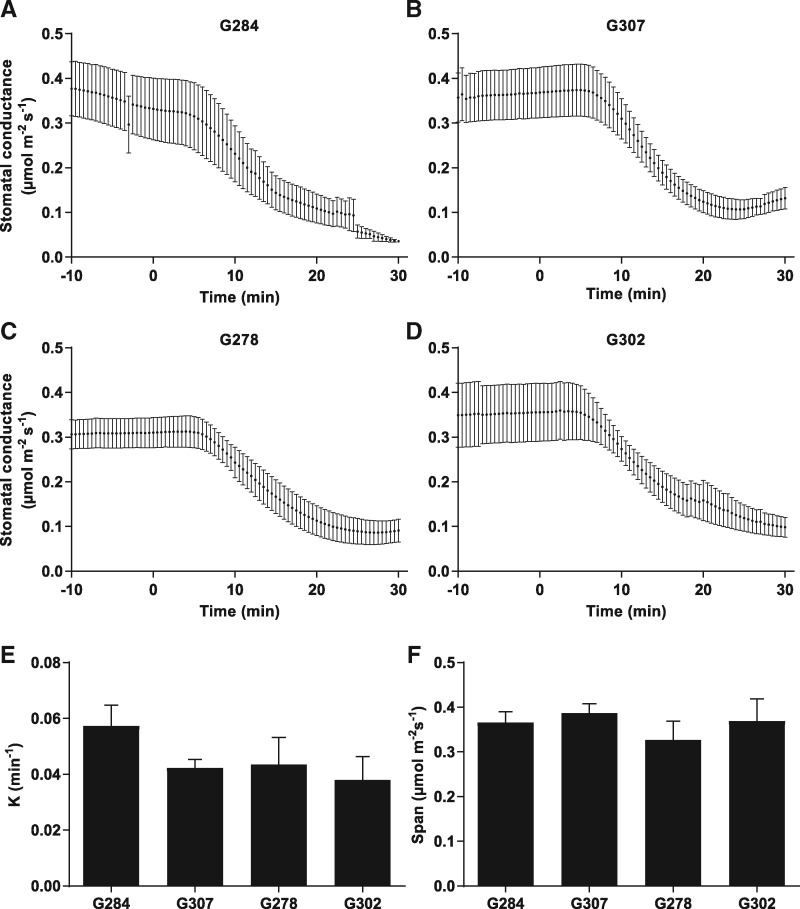
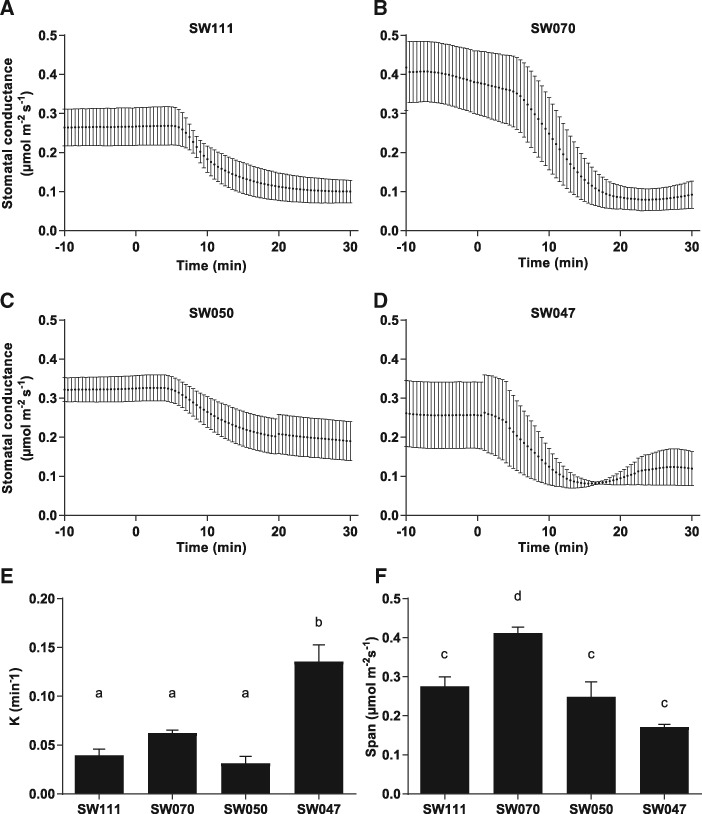
To investigate the effect of ABA on stomatal closure, we developed a procedure that resolves the kinetics of stomatal ABA responses in intact B. napus leaves, wherein we performed gas exchange analyses with ABA added to the transpiration stream. Individual leaves were excised and the petiole submerged in water. Gas exchange parameters were controlled at ambient conditions [CO2 400 p.p.m., photosynthetically active radiation (PAR) 500 µmol photons m−2 s−1] using a Li-Cor-6400 gas exchange analyzer. ABA was added to the water feeding the petioles to a final concentration of 10 µM. The stomatal conductance curves were analyzed using a standard one-phase decay equation (see the Materials and Methods) to determine rate constants of stomatal closure. The difference between steady-state stomatal conductance and final conductance (‘span’) was also calculated. The G accessions (Fig. 7A–D) did not show significant differences in their rate of gs change (Fig. 7E) or span (Fig. 7F). In the SW lines (Fig. 8A–D), a significant difference was observed between the rate of change of line SW047 and the other SW lines (Fig. 8E). This rapid stomatal closure rate may be a reason for the δ13C value recorded for accession SW047 (Fig. 1), which indicated an increased WUE. Line SW070 had a significantly larger span between open and closed stomata (Fig. 8F).
Fig. 7.
Stomatal conductance response to exogenous ABA in Spring accessions. Individual leaves were excised and the petiole submerged in water. Gas exchange parameters were controlled at ambient conditions (CO2 400 p.p.m., PAR 500 µmol photons m−2 s−1) using a Li-Cor-6400 gas exchange analyzer. When steady stomatal conductance was observed, ABA was added to the transpiration stream to a final concentration of 10 µM. (A–D) ABA response curves of Spring accessions to 10 µM ABA (means ± SEM; n = 3). No significant difference was found in the (E) rate constant (K) or (F) difference between starting and ending stomatal conductance values (span), between Spring lines. Curves were fitted, and the rate constant (K) and span were determined, using a standard one-phase decay equation. Statistical values for differences within categories were calculated using a one-way ANOVA followed by Tukey’s multiple comparisons test.
Fig. 8.
Stomatal conductance response to exogenous ABA. Measurements were conducted as in Fig. 7. (A–D) ABA response curves of Semi-Winter accessions to 10 µM ABA (means ± SEM; n = 3). In Semi-Winter accessions, (E) SW047 had a significantly higher rate constant than other accessions. (F) SW070 had a significantly larger span than other Semi-Winter accessions. Curves were fit, and the rate constant (K) and span (difference between starting and ending stomatal conductance values) were determined, using a standard one-phase decay equation. Statistical values for differences within categories were calculated using a one-way ANOVA followed by Tukey’s multiple comparisons test.
Discussion
Characterizing and understanding the natural variation within a species is a powerful tool to identify mechanisms and genetic loci associated with phenotypes. The work presented here demonstrates the differences in traits associated with WUE in natural variants of the crop species B. napus that showed extremes in WUE based on δ13C measurements.
We investigated the gas exchange physiology of Spring and Semi-Winter B. napus accessions which had a range of δ13C values. There is a correlation between δ13C values of plant material and WUE (Farquhar and Richards 1984). Gas exchange parameters A and gs were measured in selected accessions, with no significant difference found in most accessions. Interestingly, G302 (Mozart), which had the highest WUE in the field, had a high rate of CO2 assimilation (Fig. 3A) which translated to a high TE. Analysis of additional accessions would be needed to infer a correlation between δ13C values and instantaneous TE. Differences in stomatal density and stomatal index did not translate to altered stomatal conductance or assimilation in the investigated extreme WUE accessions, which differs from results in previous transgenic studies in Arabidopsis (Doheny-Adams et al. 2012). The difference in δ13C values observed in field-grown vs. growth room plants highlights the growth condition dependence of δ13C values.
Our study also examined the stomatal conductance response of these accessions to exogenous ABA. Examining the kinetics of plant responses to ABA in intact leaves allowed us to investigate the relationship of WUE to the rate of stomatal response to ABA. We were able to elicit stomatal closure upon addition of ABA to the transpiration stream in all accessions tested. G lines exhibited no significant difference in their rate of stomatal closure or the span of difference in stomatal conductance before and after ABA treatment. The SW line SW047 had a significantly faster rate of stomatal closure as compared with the other SW lines, which may correlate with the higher WUE indicated by the δ13C value. Line SW070 had a significantly larger span of gs before and after ABA treatment compared with other SW lines.
Recent studies have demonstrated cuticle permeability to both water vapor and CO2 as having a contribution to water loss from plants (Boyer 2015a, Boyer 2015b), particularly in leaves with closed stomata (Tominaga and Kawamitsu 2015). As the cuticle allows water vapor to exit the leaf at a higher rate than CO2 can enter, this could impact the difference between calculated CO2 flux and actual CO2 entering the leaf (Hanson et al. 2016). Analysis of the cuticle composition of the B. napus diversity set, from which the accessions used in this study came, revealed heritable variation in cuticular wax composition and amount (Tassone et al. 2016). The study of Tassone et al. identified relatively high amounts of n-alkanes, which have been linked to the inhibition of leaf water loss in previous studies (Leide et al. 2007, Kosma et al. 2009). There was no appreciable difference measured between transpiration of the different accessions following exogenous ABA addition, suggesting little difference in epidermal permeability (Supplementary Fig. S3). Measurements of the cuticle composition and cuticular wax amount in the studied accessions under well-watered and water-stressed conditions may indicate whether these traits contribute to the long-term WUE observed in these accessions.
Conclusions
This study shows how characterization of natural variation in δ13C-derived WUE within a species provides an approach for understanding the many traits involved in WUE phenotypes. The present study indicates that line SW047 shows a more rapid ABA response which may be linked to WUE and that line G302 had an increased electron transport capacity (Jmax), which may also be linked to the higher WUE. These results could be used to examine further the mechanisms and genetic differences in these accessions and shows the potential of using this diversity set to characterize mechanisms that affect WUE.
Materials and Methods
Plant material and growth conditions
Growth room experiments. Brassica napus seeds were sown in 3 inch pots containing a mixture of potting soil, perlite and vermiculite (6 : 1 : 1), and placed in a walk-in growth room at a controlled temperature (22°C) and humidity (60 ± 2% relative humidity) with a 12 h light : 12 h dark regime at 150 µmol m–2 s–1 photosynthetic photon flux density (PPFD). Seedlings were watered every other day to soil capacity. Three weeks after germination, plants were transferred to 5 inch pots containing the same soil mixture. Plants were grown at controlled temperature (22°C) and humidity (60 ± 2% relative humidity) with a 12 h light : 12 h dark regime at 250 µmol m–2 s–1 PPFD at canopy level. Plants were watered to soil capacity every other day. Experiments were performed starting in January 2014, with seeds sown of each line every 4–6 weeks, for continuous availability of plants for measurement. All plants were 6–8 weeks old at the time of measurements.
Drought tolerance experiments
The diversity set lines at the Colorado State University Agricultural Research, Development and Education Center were grown near Fort Collins, Colorado (40.65°N, 105.00°W). The soil type was Nunn clay loam, and average annual precipitation was 356 mm. Seeds were planted in a split-plot design with a well-irrigated and a drought treatment and three replicates in May 2015. Plots were 1.5 m by two rows, with 0.3 m row spacing. Irrigation was applied using a linear-move system at approximately 2.5 cm per week for the first 7 weeks of development, at which point it was discontinued in the drought treatment. Irrigation was maintained at the rate of 2.5 cm per week for the duration of the experiment in the irrigated treatment. At seed maturity, all plants were cut at soil level, and plot-level aerial fresh biomass was measured.
Carbon isotope discrimination
The diversity set of B. napus (Supplementary Table S1) was grown in 3 m, one-row plots with three replicates in an α-lattice design at the Maricopa Agricultural Center of the University of Arizona in Maricopa, Arizona, as described by Tassone et al. (2016). Soil is a Casa Grande sandy loam, and plants were flood irrigated. Seeds were sown in early February 2013. At 8 weeks from planting, we sampled 147 accessions, taking two non-shaded leaves from a random plant collected from each plot. Leaf tissue was dried at 65°C for 48 h and then crushed. Aliquots containing 2 mg of leaf tissue were used to quantify the carbon isotope ratio (δ13C, expressed relative to the Vienna PeeDee Belemnite standard) using a dual-inlet mass spectrometer (PDZ Europa 20–20 isotope ratio mass spectrometer, PDZ Europa ANCA-GSL elemental analyzer, Sercon Ltd.) at the Stable Isotope facility at the University of California, Davis. Samples for growth room plants were collected similarly to field-grown plants, collecting three cauline leaves from each plant after bolting and prior to seed setting. Aliquots containing 2 mg of leaf tissue were used to quantify the carbon isotope ratio (δ13C, expressed relative to the Vienna PeeDee Belemnite standard) using a dual-inlet mass spectrometer (Delta V mass spectrometer, Conflo IV interface, Thermo Scientific; ECS 4010 CHNSO Analyzer, Costech Analytical Technologies, Inc.) at the Center for Stable Isotopes at University of New Mexico.
Physiological analyses
Gas exchange measurements from intact, mature leaves of 6- to 8-week-old plants were conducted using a LI-6400 infrared gas exchange analyzer (LI-6400XT, Li-Cor, Inc.) with the standard 6 cm2 leaf cuvette fitted with a light-emitting diode (LED) light source (LI-6400-02B; Li-Cor Inc.). Leaf temperature and vapor pressure deficit at the leaf level (VpdL) were held at 20°C and approximately 0.75 kPa (±0.05 kPa), respectively (Supplementary Fig. S2). All measurements were taken at 500 µmol m–2 s–1 PPFD (intensity determined to be at light saturation for all accessions using a standard light response curve at 400 p.p.m. CO2). Steady-state gas exchange measurements (A, gs and E) were taken at 400 p.p.m. CO2. Photosynthetic parameters (Jmax, Vcmax) were estimated from A/Ci curves according to the method of Sharkey et al. (2007). Values were normalized to leaf temperature 25°C.
Stomatal ABA response analysis
Intact, mature leaves of 6- to 8-week-old plants were removed and the petiole cut under water 2 cm from the base of the leaf. The cut end was submerged in deionized H2O in a 15 ml Falcon tube. Gas exchange measurements were conducted as above with the LI-6400XT gas exchange analyzer. Leaf temperature and relative humidity were held at 20°C and approximately 75% (±5%), respectively. Light intensity for measurements was 500 µmol m–2 s–1 PPFD, and reference [CO2] was set at 400 p.p.m. After 10 min of steady state or more stable CO2 assimilation rates (A) and stomatal conductance (gs), ABA was added to the Falcon tube to a final concentration of 10 µM. Gas exchange data were collected for 30 min after the addition of ABA. In control experiments, 15 µl of ethanol was added in place of ABA (data not shown). Curves were analyzed using GraphPad Prism. Rate of change (K) and span were determined by fitting a plateau followed by one-phase decay algorithm (Model: Y = IF{X < X0, Y0, Plateau + [Y0 – Plateau] X exp[–K X (X – X0)]} where X0 is the time at which the decay begins and Y0 is the average Y value prior to time X0). Differences in K and span within each group (SW or G) were analyzed with one-way analysis of variance (ANOVA) followed by Tukey’s multiple comparisons test.
Stomatal density/index analyses
Following gas exchange measurements, three 1 cm diameter punches were taken from the area of leaf that was used for gas exchange. The punches were stained with propidium iodide (100 µg ml–1) for 1 h, then rinsed with distilled H2O and transferred to slides. Confocal microscopy was performed using a custom spinning disk confocal microscope system described previously (Walker et al. 2007). Laser excitation was 568 nm for propidium iodide. Images were acquired and Z-stack projections assembled using MetaMorph software (Universal Imaging). Image processing was performed using NIH ImageJ. Data within each group (SW or G) were analyzed with one-way ANOVA followed by Tukey’s multiple comparisons test.
Supplementary data
Supplementary data are available at PCP online.
Funding
This work was supported by the National Science Foundation [DGE1144086 to D.P., MCB-1616236 to J.I.S, IOS 1025837 to J.K.M.] and the National Institutes of Health [GM060396 to J.I.S.].
Disclosures
The authors have no conflicts of interest to declare.
Supplementary Material
Glossary
Abbreviations
- A
photosynthetic CO2 assimilation rate
- E
transpiration rate
- gs
stomatal conductance
- Jmax
maximum electron transport rate
- PAR
photosynthetically active radiation
- PPFD
photosynthetic photon flux density
- RuBP
ribulose-1,5-bisphosphate
- TE, transpiration efficiency; Vcmax
maximum Rubisco carboxylation rate
- WUE
water use efficiency
References
- Allender C.J., King G.J. (2010) Origins of the amphiploid species Brassica napus L. investigated by chloroplast and nuclear molecular markers. BMC Plant Biol. 10: 54. [DOI] [PMC free article] [PubMed] [Google Scholar]
- Barbour M.M., Warren C.R., Farquhar G.D., Forrester G., Brown H. (2010) Variability in mesophyll conductance between barley genotypes, and effects on transpiration efficiency and carbon isotope discrimination. Plant Cell Environ. 33: 1176–85. [DOI] [PubMed] [Google Scholar]
- Bouchereau A., Clossais-Besnard N., Bensaoud A., Leport L., Renard M. (1996) Water stress effects on rapeseed quality. Eur. J. Agron. 5: 19–30. [Google Scholar]
- Boyer J.S. (1982) Plant productivity and environment. Science 218: 443–448. [DOI] [PubMed] [Google Scholar]
- Boyer J.S. (2015a) Impact of cuticle on calculations of the CO2 concentration inside leaves. Planta 242: 1405–1412. [DOI] [PubMed] [Google Scholar]
- Boyer J.S. (2015b) Turgor and the transport of CO2 and water across the cuticle (epidermis) of leaves. J. Exp. Bot. 66: 2625–2633. [DOI] [PMC free article] [PubMed] [Google Scholar]
- Champolivier L., Merrien A. (1996) Effects of water stress applied at different growth stages to Brassica napus L . var. oleifera on yield, yield components and seed quality. Eur. J. Agron. 5: 153–160. [Google Scholar]
- Cutler S.R., Rodriguez P.L., Finkelstein R.R., Abrams S.R. (2010) Abscisic acid: emergence of a core signaling network. Annu. Rev. Plant Biol. 61: 651–679. [DOI] [PubMed] [Google Scholar]
- Davies W.J., Wilkinson S., Loveys B. (2002) Stomatal control by chemical signalling and the exploitation of this mechanism to increase water use efficency in agriculture. New Phytol. 153: 449–460. [DOI] [PubMed] [Google Scholar]
- Doheny-Adams T., Hunt L., Franks P.J., Beerling D.J., Gray J.E. (2012) Genetic manipulation of stomatal density influences stomatal size, plant growth and tolerance to restricted water supply across a growth carbon dioxide gradient. Philos. Trans. R. Soc. B: Biol. Sci. 367: 547–555. [DOI] [PMC free article] [PubMed] [Google Scholar]
- Donovan L.A., Ehleringer J.R. (1994) Carbon isotope discrimination, water-use efficiency, growth, and mortality in a natural shrub population. Oecologia 100: 347–354. [DOI] [PubMed] [Google Scholar]
- Easlon H.M., Nemali K.S., Richards J.H., Hanson D.T., Juenger T.E., McKay J.K. (2014) The physiological basis for genetic variation in water use efficiency and carbon isotope composition in Arabidopsis thaliana. Photosynth. Res. 119: 119–129. [DOI] [PMC free article] [PubMed] [Google Scholar]
- FAO (2015) Food Outlook, Biannual Report on Global Food Markets. Rome. [Google Scholar]
- Farquhar G.D., Richards R.A. (1984) Isotopic composition of plant carbon correlates with water-use efficiency of wheat genotypes. Aust. J. Plant Physiol. 11: 539–552. [Google Scholar]
- Farquhar G.D., von Caemmerer S., Berry J.A. (1980) A biochemical model of photosynthetic CO2 assimilation in leaves of C3 species. Planta 149: 78–90. [DOI] [PubMed] [Google Scholar]
- Hanson D.T., Stutz S.S., Boyer J.S. (2016) Why small fluxes matter: the case and approaches for improving measurements of photosynthesis and (photo)respiration. J. Exp. Bot. 67: 3027–3039. [DOI] [PMC free article] [PubMed] [Google Scholar]
- Hauser F., Waadt R., Schroeder J.I. (2011) Evolution of abscisic acid synthesis and signaling mechanisms. Curr. Biol. 21: R346–R355. [DOI] [PMC free article] [PubMed] [Google Scholar]
- Jensen C.R., Mogensen V.O., Mortensen G., Fieldsend J.K., Milford G.F.J., Andersen M.N.. et al. (1996) Seed glucosinolate, oil and protein contents of field-grown rape (Brassica napus L.) affected by soil drying and evaporative demand. Field Crops Res. 47: 93–105. [Google Scholar]
- Kosma D.K., Bourdenx B., Bernard A., Parsons E.P., Lü S., Joubès J.. et al. (2009) The impact of water deficiency on leaf cuticle lipids of Arabidopsis. Plant Physiol. 151: 1918–1929. [DOI] [PMC free article] [PubMed] [Google Scholar]
- Leide J., Hildebrandt U., Reussing K., Riederer M., Vogg G. (2007) The developmental pattern of tomato fruit wax accumulation and its impact on cuticular transpiration barrier properties: effects of a deficiency in a beta-ketoacyl-coenzyme A synthase (LeCER6). Plant Physiol. 144: 1667–1679. [DOI] [PMC free article] [PubMed] [Google Scholar]
- Ludlow M.M., Muchow R.C. (1990) A critical evaluation of traits for improving crop yields in water-limited environments. Adv. Agron. 43: 107–153. [Google Scholar]
- Noh Y.-S., Amasino R.M. (1999) Regulation of developmental senescence is conserved between Arabidopsis and Brassica napus. Plant Mol. Biol. 41: 195–206. [DOI] [PubMed] [Google Scholar]
- Parkin I.A.P., Gulden S.M., Sharpe A.G., Lukens L., Trick M., Osborn T.C.. et al. (2005) Segmental structure of the Brassica napus genome based on comparative analysis with Arabidopsis thaliana. Genetics 171: 765–81. [DOI] [PMC free article] [PubMed] [Google Scholar]
- Passioura J.B. (1983) Roots and drought resistance. Agric. Water Manag. 7: 265–280. [Google Scholar]
- Pinheiro H.A., DaMatta F.M., Chaves A.R.M., Loureiro M.E., Ducatti C. (2005) Drought tolerance is associated with rooting depth and stomatal control of water use in clones of Coffea canephora. Ann. Bot. 96: 101–108. [DOI] [PMC free article] [PubMed] [Google Scholar]
- Seibt U., Rajabi A., Griffiths H., Berry J.A. (2008) Carbon isotopes and water use efficiency: sense and sensitivity. Oecologia 155: 441–454. [DOI] [PubMed] [Google Scholar]
- doi: 10.1111/j.1365-3040.2007.01710.x. Sharkey, T. D., Bernacchi, C. J., Farquhar, G. D. and Singsaas, E. L. (2007) Fitting photosynthetic carbon dioxide response curves for C3 leaves. Plant, Cell & Environment 30: 1035–1040. [DOI] [PubMed] [Google Scholar]
- Tassone E.E., Lipka A.E., Tomasi P., Lohrey G.T., Qian W., Dyer J.M.. et al. (2016) Chemical variation for leaf cuticular waxes and their levels revealed in a diverse panel of Brassica napus L. Ind. Crops Prod. 79: 77–83. [Google Scholar]
- Tominaga J., Kawamitsu Y. (2015) Cuticle affects calculations of internal CO2 in leaves closing their stomata. Plant Cell Physiol. 56: 1900–1908. [DOI] [PubMed] [Google Scholar]
- Trenberth K.E., Dai A., van der Schrier G., Jones P.D., Barichivich J., Briffa K.R.. et al. (2014) Global warming and changes in drought. Nat. Clim. Change 4: 17–22. [Google Scholar]
- Walker K. L., Müller S., Moss D., Ehrhardt D. W., and Smith L. G. (2007) Arabidopsis TANGLED identifies the division plane throughout mitosis and cytokinesis. Current Biology 17: 1827–1836. [DOI] [PMC free article] [PubMed] [Google Scholar]
- WWAP (United Nations World Water Assessment Programme) (2015) The United Nations World Water Development Report 2015: Water for a Sustainable World. UNESCO, Paris. [Google Scholar]
- Zhu M., Monroe J.G., Suhail Y., Villiers F., Mullen J., Pater D.. et al. (2016) Molecular and systems approaches towards drought-tolerant canola crops. New Phytol. 210: 1169–1189. [DOI] [PubMed] [Google Scholar]
Associated Data
This section collects any data citations, data availability statements, or supplementary materials included in this article.


