
Fig. 7.
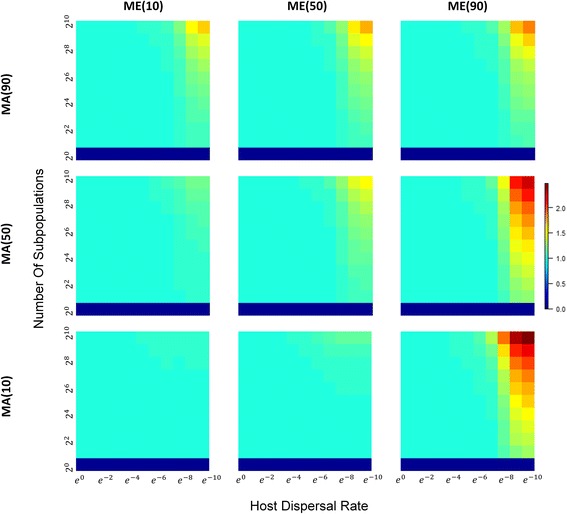
Heatmaps of ratio of βb-diversity to βw-diversity across a range subpopulation sizes and host dispersal rates under different combinations of MAx and MEy. With a similar layout, all heatmaps are also plotted in the same way as those in Fig. 4 except that β-diversity ratio instead of α-diversity is measured