Abstract
Animal models are essential for developing effective drugs for treating human cancer. Examination of the formation of lung surface foci of B16-F10 melanoma cells is a widely used animal model for studying cancer metastasis and drug intervention. This model, however, suffers from several drawbacks, including its non-quantitative nature and inability to yield information on cancer cell load inside the target organ. Here we report the development of a highly sensitive, bioluminescence-based method for quantifying melanoma cell load in mouse lungs following intravenous injection of luciferase-expressing B16-F10 melanoma cells. This method could readily detect as few as 1–10 cells in the samples and enable quantification of cancer cell load before the formation of surface foci in mouse lungs following metastasis of intravenously inoculated B16-F10 melanoma cells. This innovative bioluminometry-based method has important implications for studying anticancer drugs, including naturally occurring redox-active quinones that generate reactive oxygen species to kill cancer cells.
Keywords: B16-F10 melanoma cells, Bioluminometry, Luciferase, Lung metastasis
1. INTRODUCTION
Animal models are instrumental in the development of effective drugs for both preventive and therapeutic intervention of human cancer, a major cause of death worldwide [1, 2]. In this context, inoculation of B16-F10 melanoma cell line in mice is among the most commonly used models for studying the molecular mechanisms of cancer metastasis and developing mechanistically based-chemotherapeutic modalities [3–6]. B16-F10 melanoma cells readily undergo metastasis to various organs, especially the lungs, following intravenous or subcutaneous inoculation, and as such, this cancer cell line has been widely used to study cancer metastasis to the lungs and its therapeutic intervention [3–6]. Traditionally, examination of the formation of melanoma cell foci on lung surface is employed to estimate cancer cell load in the lungs. However, different sizes of the surface foci make quantification of the melanoma cell load less accurate. In addition, this method does not allow detection of melanoma cell load inside lung tissues. More recently, luciferase-expressing B16-F10 melanoma cells as well as other cancer cells have been established as models to study cancer metastasis through bioluminescence imaging of the tumor-carrying live mice [7, 8]. While this novel method allows visualization of tumor formation in live animals at various time points of tumor development, the intrinsic sensitivity issue related to tumors located deep inside the target organs and the non-quantitative nature of the technique along with the costly imaging system limit its wide use in cancer research. To circumvent the above limitations, in this study, we developed an innovative bioluminometry-based method that allowed sensitive quantification of cancer cell load in the lungs following metastasis of the intravenously inoculated luciferase-expressing B16-F10 melanoma cells in C57BL/6 mice.
2. MATERIALS AND METHODS
2.1. Materials
The luciferase-expressing B16-F10 melanoma (B16-F10-luc-G5 Bioware® Ultra) cells and luciferin were obtained from PerkinElmer (Waltham, MA). Dulbecco’s modified Eagle’s medium (DMEM), penicillin, streptomycin, fungizone, fetal bovine serum (FBS), zeocin, and phosphate-buffered saline (PBS) were from Thermo Fisher Scientific (Grand Island, NY). Cell culture flasks and other plasticwares were from Corning (Corning, NY). Adenosine triphosphate (ATP) and other chemicals and reagents of analytical grade were purchased from Sigma-Aldrich (St. Louis, MO).
2.2. Cell Culture and Sample Preparation
The B16-F10-luc-G5 cells were cultured in DMEM supplemented with 10% FBS, 100 units/ml of penicillin, 100 μg/ml of streptomycin, and 0.25 μg/ml of fungizone at 37°C in a humidified atmosphere of 5% CO2. For zeocin selection, the B16-F10-luc-G5 cells were cultured in the above medium in the presence of zeocin (0.25 mg/ml) for 1 week. For cell homogenate preparation, a known number of the cells were lysed in 25 mM phosphate buffer (pH 7.8) containing 2 mM ethylenediaminetetraacetic acid (EDTA), 2 mM MgSO4, and 0.1% Triton X-100, and kept on ice for bioluminescence measurement within 2 hours or stored at −90°C for subsequent measurement within 2 months.
2.3. Animals and Treatment
C57BL/6 male mice at the age of 7–8 weeks were obtained from Charles River Laboratories (Wilmington, MA) and housed in an institutional animal research facility with a light period from 6 am to 6 pm. Purified AIN-93G chow (BioServ, NJ) and water were available ad libitum. All mice were allowed to acclimate for at least 1 week prior to the experiments. For establishing lung metastasis, each mouse received 2 × 10⁵ B16-F10-luc-G5 cells suspended in 0.1 ml of sterile PBS via tail vein injection (Figure 1). The mice were euthanized on the 6th, 12th, and 18th days after injection of B16-F10-luc-G5 cells, and lungs were collected for examination of surface foci formed by B16-F10 melanoma cell metastasis. After photographing, the entire lungs were homogenized in 1 ml of 25 mM phosphate buffer (pH 7.8) containing 2 mM EDTA, 2 mM MgSO4, and 0.1% Triton X-100, and the homogenates were kept on ice for bioluminescence measurement within 2 hours or stored at −90°C for subsequent measurement within 2 months. The animal procedures were approved by the Institutional Animal Care and Use Committee in compliance with the pertinent U.S. Federal policy.
FIGURE 1. Bioluminometry of cancer cell load.
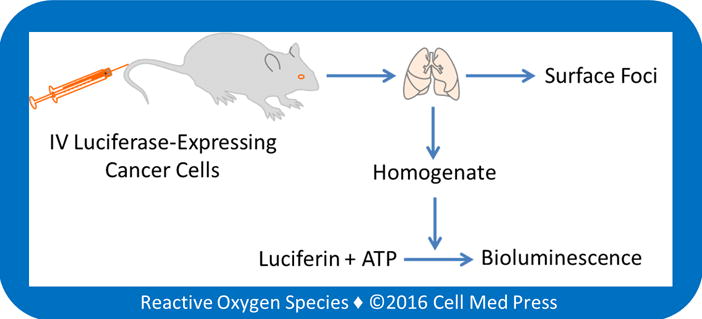
Quantification of melanoma cell load in mouse lungs is based on luciferase-dependent bioluminometry in mice after intravenous (IV) injection of luciferase-expressing cancer cells (i.e., B16-F10-luc-G5 cells).
2.4. Measurement of Bioluminescence
Bioluminescence was measured with a Berthold multi-channel LB 9505C luminometer (Wildbad, Germany) at various temperatures for 5 min in a clear plastic tube filled with 1 ml of 25 mM phosphatase buffer (pH 7.8) containing 2 mM EDTA, 2 mM MgSO4, and 0.1% Triton X-100, in the presence of luciferin and ATP. The reaction was started by adding cell or tissue samples to the above reaction mix. The luciferase/luciferin-derived bioluminescence intensity was expressed as integrated responses (total counts of photon emission) over the above 5 min.
2.5. Statistical Analyses
All data are expressed as means ± standard deviation from at least three separate experiments unless otherwise indicated. Differences between the mean values of multiple groups were analyzed by one-way analysis of variance (ANOVA) followed by Student–Newman–Keuls test. Statistical significance was considered at p < 0.05.
3. RESULTS AND DISCUSSION
3.1. Linear Relationship between B16-F10-luc-G5 Cell Number and Bioluminescence Intensity, and the Effects of Varying the Concentrations of ATP and Luciferin and Reaction Temperatures on Cell Number-Dependent Bioluminescence
To determine the linear relationship between B16-F10-luc-G5 cell number and bioluminescence intensity, bioluminescence was measured at 25.6°C (the lowest temperature limit of the Berthold LB 9505C luminometer) after the addition of cell samples derived from various numbers of cells (1–160,000 cells) to the reaction mix containing 0.5 mM ATP and 100 μg/ml of luciferin. As shown in Figure 2, a linear relationship between cell number and bioluminescence intensity with a coefficient of determination (r2) of 0.997 was observed. Notably, this linear relationship was seen with an extremely large range of cell numbers (from 1 to 160,000 cells). The sensitivity of this method allowed measurement of a single cell. Such a high sensitivity would make it possible to quantify luciferase-expressing cancer cell load in target organs of mice during early stage of cancer cell metastasis as well as in organs that exhibit very low cancer cell load.
FIGURE 2. Linear relationship between B16-F10 melanoma cell number and the bioluminescence intensity.
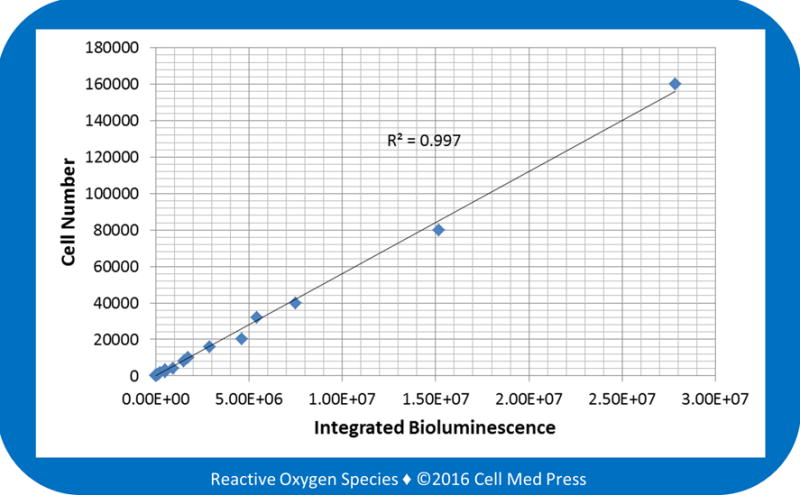
Bioluminescence was measured at 25.6°C for 5 min after adding samples derived from 1–160,000 B16-F10-luc-G5 cells (without zeocin selection) to the reaction mix containing 100 μg/ml of luciferin and 0.5 mM ATP. Data represent means from 4 separate experiments with the unit of bioluminescence being total counts of photon emission over 5 min.
To determine the effects of varying the concentrations of ATP and luciferin on bioluminescence intensity, cell samples derived from either 160 or 16,000 B16-F10-luc-G5 cells were added to the reaction mix containing 100 μg/ml of luciferin and 0.1–1.6 mM ATP (Figure 3A and 3C) or 0.5 mM ATP and 20–320 μg/ml of luciferin (Figure 3B and 3D). As shown in the figure, with both 160 and 16,000 cells, varying the ATP concentrations from 0.1 to 1.6 mM or the luciferin concentrations from 20 to 320 μg/ml did not significantly affect the bioluminescence intensity. Hence, to save reagents, 0.1 mM ATP and 20 μg/ml of luciferin may be used to reliably measure the bioluminescence and quantify the B16-F10-luc-G5 cell numbers.
FIGURE 3. Effects of varying the concentrations of ATP and luciferin on B16-F10 melanoma cell-derived bioluminescence.
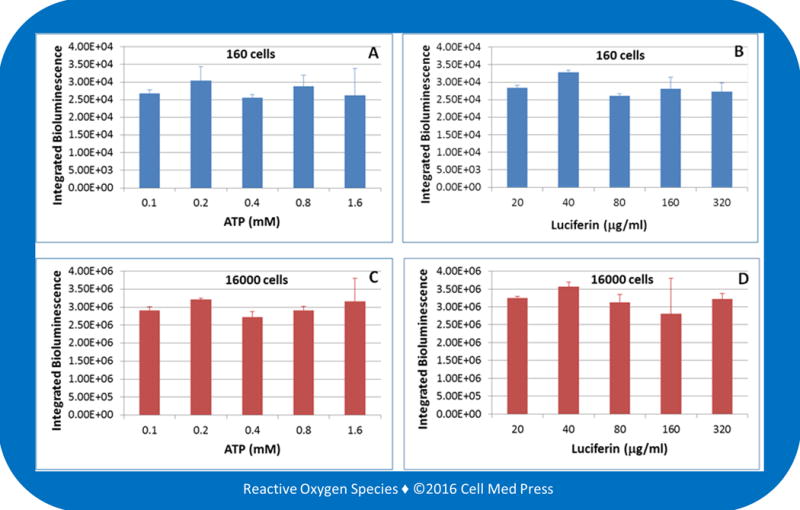
Bioluminescence was measured at 25.6°C for 5 min after adding samples derived from 160 (panels A and B) or 16,000 (panels C and D) B16-F10-luc-G5 cells (without zeocin selection) to the reaction mix containing 100 μg/ml of luciferin plus the indicated concentrations of ATP (panels A and C) or 0.5 mM ATP plus the indicated concentrations of luciferin (panels B and D). Data represent means ± standard deviation from 4 separate experiments with the unit of bioluminescence being total counts of photon emission over 5 min.
Berthold LB 9505C luminometer allows sample measurement at any temperatures between 25.6 and 50°C. We determined the effects of varying incubation temperatures on bioluminescence intensity. As shown in Figure 4, increasing incubation temperature from 25.6 to 30 and 37°C did not affect the cell number-dependent bioluminescence intensity. This result suggested that the reaction rate between the cell-derived luciferase and the added luciferin in the presence of the added ATP under the described experimental conditions was independent of the sample incubation temperature. Since most of the currently available models of luminescence detecting instruments are not equipped with a temperature-controlling unit, the temperature independence of the luciferase/luciferin-derived bioluminescence would allow reliable determination of the linear relationship between the B16-F10-luc-G5 cell number and the resulting bioluminescence intensity under various ambient temperatures.
FIGURE 4. Effects of varying incubation temperatures on the relationship between B16-F10 melanoma cell number and the bioluminescence intensity.
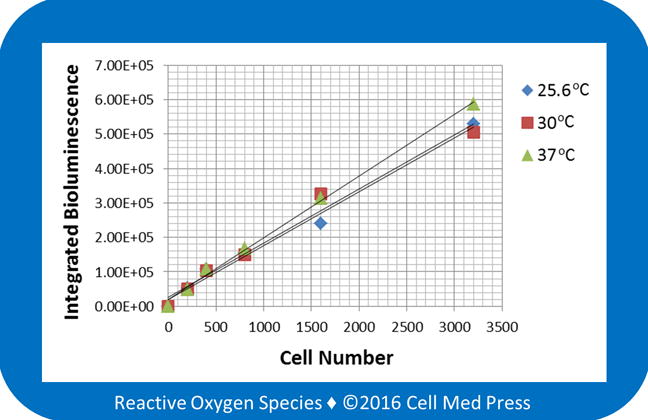
Bioluminescence was measured at 25.6, 30, and 37°C for 5 min after adding samples derived from the indicated numbers of B16-F10-luc-G5 cells (without zeocin selection) to the reaction mix containing 100 μg/ml of luciferin and 0.5 mM ATP. Data represent means from 4 separate experiments with the unit of bioluminescence being total counts of photon emission over 5 min.
3.2. Effects of Zeocin Selection on B16-F10-luc-G5 Cell Number-Dependent Bioluminescence, and Linear Relationship between B16-F10-luc-G5 Cell Number Added to Control Lung Tissues and Bioluminescence Intensity
The B16-F10-luc-G5 cell line is derived from B16-F10 mouse melanoma cells by stable transfection of the North American firefly luciferase gene expressed from the SV40 promoter with zeocin as a selection marker. Culture of B16-F10-luc-G5 cells in the presence of zeocin (0.25 mg/ml) led to elimination of the cells that lost the luciferase gene during cell replication, and thereby enrichment of the luciferase-expressing B16-F10 cells [9]. A linear relationship was demonstrated with both non-zeocin-selected and zeocin-selected cells, and zeocin-selected cells generated 3 times more bioluminescence than did the non-zeocin-selected cells (Figure 5). For non-zeocin-selected and zeocin-selected cells, the quantitative relationships between cell number and bioluminescence intensity were calculated to be y = 0.0045x and y = 0.0015x, respectively, where y denotes cell number and x denotes bioluminescence intensity (integrated bioluminescence over a period of 5 min with the unit being total counts of photon emission over 5 min). Hence, with the same cell number under the same reaction conditions, zeocin-selected B16-F10-luc-G5 cells emitted 3 times more photons than did the non-zeocin-selected cells. This result implicated that routine zeocin-selection would increase the sensitivity of the method in quantifying B16-F10-luc-G5 cell number.
FIGURE 5. Effects of zeocin selection on the linear relationship between B16-F10 melanoma cell number and the bioluminescence intensity.
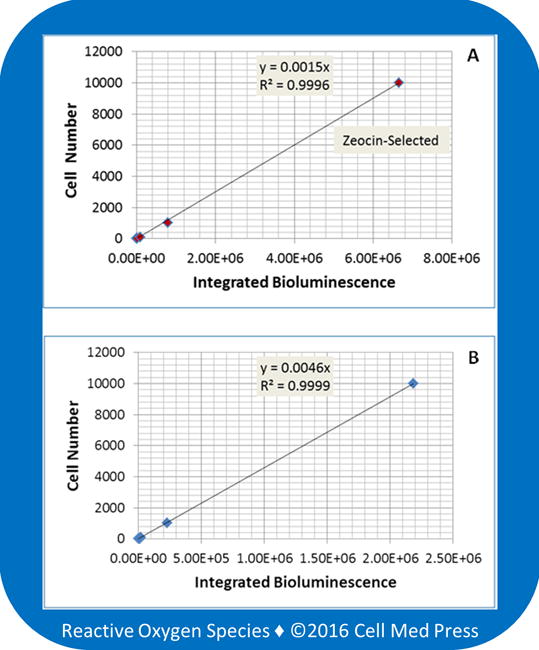
Bioluminescence was measured at 37°C for 5 min after adding samples derived from the indicated number of zeocin-selected (panel A) and non-zeocin-selected (panel B) B16-F10-luc-G5 cells to the reaction mix containing 100 μg/ml of luciferin and 0.5 mM ATP. Data represent means from 4 separate experiments with the unit of bioluminescence being total counts of photon emission over 5 min.
The above results demonstrated a linear quantitative relationship between B16-F10-luc-G5 cell number and bioluminescence intensity in the absence of tissue samples. To determine if biological components in tissue samples could affect B16-F10-luc-G5 cell number-dependent bioluminescence, a known number of zeocin-selected B16-F10-luc-G5 cells were added to normal lung tissues followed by homogenization. As shown in Figure 6, a linear correlation was observed between the numbers of B16-F10-luc-G5 cells (1–100,000 cells) added to the lung tissues and the bioluminescence intensity generated. The quantitative equation was calculated to be y = 0.0014x, where y denotes cell number and x denotes bioluminescence intensity (total counts of photon emission over 5 min). Comparison of this equation with the one above (y = 0.0015x in Figure 5A) revealed that normal biological components in lung tissues had minimal, if any, effects on B16-F10-luc-G5 cell number-dependent bioluminescence.
FIGURE 6. Linear relationship between the number of B16-F10 melanoma cells added to the lung tissue and the bioluminescence intensity.
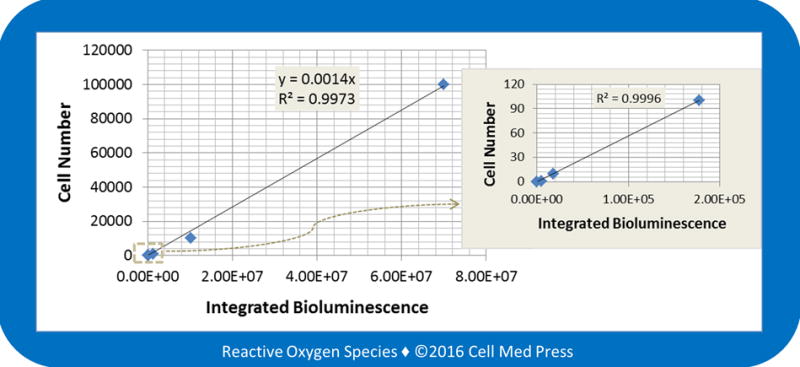
Bioluminescence was measured at 37°C for 5 min after adding samples (derived from the indicated number of zeocin-selected B16-F10-luc-G5 cells added to normal lung tissues) to the reaction mix containing 100 μg/ml of luciferin and 0.5 mM ATP. Data represent means from 3–4 separate experiments with the unit of bioluminescence being total counts of photon emission over 5 min.
3.3. Quantification of the Melanoma Cell Load in Mouse Lungs following Intravenous Injection of B16-F10-luc-G5 Cells
We applied the quantitative equation (y = 0.0014) derived from zeocin-selected B16-F10-luc-G5 cells added to lung tissues to quantify B16-F10-luc-G5 cell load in mouse lungs following tail vein injection of 2 × 10⁵ B16-F10-luc-G5. As shown in Figure 7A, on day 6 after injection, no melanoma foci were noticeable on the lung surface. Scattered foci were observed on the lung surface of mice on days 12 and 18, and the sizes of the foci on day 18 were generally larger than those on day 12. Measurements with tissue homogenates of the mouse whole lungs revealed luciferin-dependent bioluminescence, suggesting that B16-F10-luc-G5 cells metastasized to the lungs following intravenous injection could be detected through measuring the luciferase-dependent bioluminescence. The bioluminescence intensity increased in mouse lungs from day 6 to day 12 and day 18, with that on day 18 being the highest. The B16-F10-luc-G5 cell load was calculated based on the equation of y = 0.0014x, where y denotes the cell number and x denotes the intensity of bioluminescence. As shown in Figure 7B, an average of 3,033, 87,558, and 270,146 metastasized B16-F10-luc-G5 cells per mouse lungs was obtained in mice on days 6, 12, and 18, respectively, after tail vein injection of 2 × 10⁵ melanoma cells to each mouse.
FIGURE 7. Quantification of B16-F10 melanoma cell load in mouse lungs at different time points following intravenous injection of the melanoma cells.
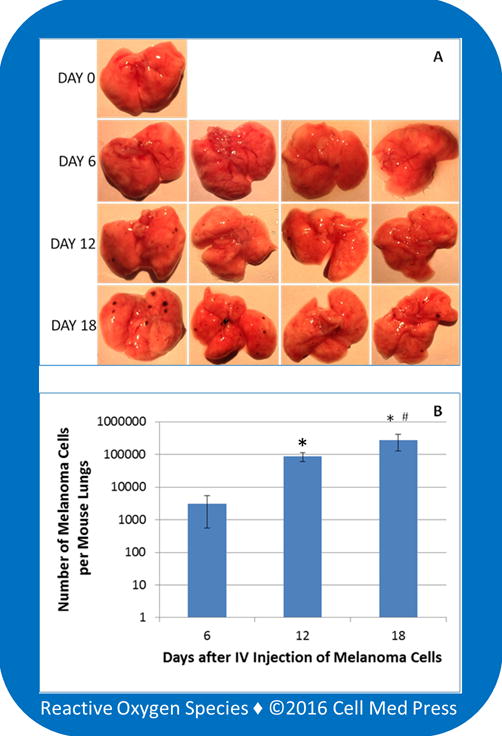
A total of 13 mice were used with one as a control, and each of the remaining 12 mice received 2 × 10⁵ zeocin-selected B16-F10-luc-G5 cells suspended in 0.1 ml of sterile PBS via tail vein injection. Following the intravenous (IV) injection, four mice were euthanized on days 6, 12, and 18, respectively. The lungs were immediately collected for examination of the formation of melanoma foci on the surface of the lungs. After photographing, the entire lungs were homogenized, and 10 μl of the homogenates was used for measurement of bioluminescence in the presence of 100 μg/ml of luciferin and 0.5 mM ATP. The melanoma cell load in each mouse lungs was determined based on a concurrently run standard curve as described in Figure 6. Data represent means ± standard deviation (n = 4).*, p < 0.05 compared with day 6;#, p < 0.05 compared with day 12.
This highly sensitive bioluminometry-based method was innovative in that it provided quantitative information on cancer cell metastasis to target organs. In contrast to the conventional method of examining the formation of lung surface melanoma foci, this quantitative method allowed accurate measurement of cancer cell load in target organs. Studies are currently underway in our laboratories to apply this novel method to investigate the redox mechanisms of cancer cell metastasis and the therapeutic effects of novel anticancer drugs, including the redox active beta-lapachone and other natural quinones that generate reactive oxygen species (ROS). In this context, our previous studies showed beta-lapachone as a potent killer of B16-F10 melanoma cells via the mitochondrial electron transport chain-mediated redox activation to form tumoricidal ROS [10].
Acknowledgments
This work was supported in part by an investigator-initiated grant (IIG) (09A084) from the American Institute for Cancer Research (AICR), and a grant (CA192936) from the U.S. National Institutes of Health/National Cancer Institute. Jason Z. Li is currently an undergraduate student. Megan E. Kauffman was an undergraduate student when she participated in this project, and she is currently a medical student. Soumyadeep Sarkar is currently a graduate student in pharmaceutical sciences.
ABBREVIATIONS
- ATP
adenosine triphosphate
- DMEMD
ulbecco’s modified Eagle’s medium
- FBS
fetal bovine serum
- PBS
phosphate-buffered saline
- ROS
reactive oxygen species
References
- 1.Frese KK, Tuveson DA. Maximizing mouse cancer models. Nat Rev Cancer. 2007;7(9):645–58. doi: 10.1038/nrc2192. [DOI] [PubMed] [Google Scholar]
- 2.Holland EC. Mouse models of human cancer as tools in drug development. Cancer Cell. 2004;6(3):197–8. doi: 10.1016/j.ccr.2004.09.004. [DOI] [PubMed] [Google Scholar]
- 3.Okoye I, Wang L, Pallmer K, Richter K, Ichimura T, Haas R, et al. T cell metabolism. The protein LEM promotes CD8+ T cell immunity through effects on mitochondrial respiration. Science. 2015;348(6238):995–1001. doi: 10.1126/science.aaa7516. [DOI] [PubMed] [Google Scholar]
- 4.Tan AS, Baty JW, Dong LF, Bezawork-Geleta A, Endaya B, Goodwin J, et al. Mitochondrial genome acquisition restores respiratory function and tumorigenic potential of cancer cells without mitochondrial DNA. Cell Metab. 2015;21(1):81–94. doi: 10.1016/j.cmet.2014.12.003. [DOI] [PubMed] [Google Scholar]
- 5.Kreiter S, Vormehr M, van de Roemer N, Diken M, Lower M, Diekmann J, et al. Mutant MHC class II epitopes drive therapeutic immune responses to cancer. Nature. 2015;520(7549):692–6. doi: 10.1038/nature14426. [DOI] [PMC free article] [PubMed] [Google Scholar]
- 6.Peinado H, Aleckovic M, Lavotshkin S, Matei I, Costa-Silva B, Moreno-Bueno G, et al. Melanoma exosomes educate bone marrow progenitor cells toward a pro-metastatic phenotype through MET. Nat Med. 2012;18(6):883–91. doi: 10.1038/nm.2753. [DOI] [PMC free article] [PubMed] [Google Scholar]
- 7.Krzeszinski JY, Wei W, Huynh H, Jin Z, Wang X, Chang TC, et al. miR-34a blocks osteoporosis and bone metastasis by inhibiting osteoclastogenesis and Tgif2. Nature. 2014;512(7515):431–5. doi: 10.1038/nature13375. [DOI] [PMC free article] [PubMed] [Google Scholar] [Retracted]
- 8.Evans MS, Chaurette JP, Adams ST, Jr, Reddy GR, Paley MA, Aronin N, et al. A synthetic luciferin improves bioluminescence imaging in live mice. Nat Methods. 2014;11(4):393–5. doi: 10.1038/nmeth.2839. [DOI] [PMC free article] [PubMed] [Google Scholar]
- 9.Hirose Y, Saijou E, Sugano Y, Takeshita F, Nishimura S, Nonaka H, et al. Inhibition of Stabilin-2 elevates circulating hyaluronic acid levels and prevents tumor metastasis. Proc Natl Acad Sci USA. 2012;109(11):4263–8. doi: 10.1073/pnas.1117560109. [DOI] [PMC free article] [PubMed] [Google Scholar]
- 10.Li JZ, Ke Y, Misra HP, Trush MA, Li YR, Zhu H, et al. Mechanistic studies of cancer cell mitochondria- and NQO1-mediated redox activation of beta-lapachone, a potentially novel anticancer agent. Toxicol Appl Pharmacol. 2014;281(3):285–93. doi: 10.1016/j.taap.2014.10.012. [DOI] [PubMed] [Google Scholar]


