Abstract
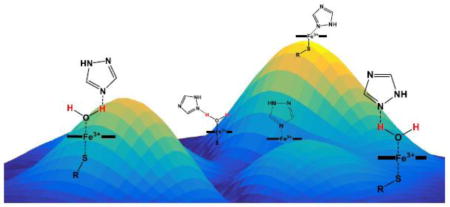
Cytochrome P450 monoxygenses (CYPs) utilize heme cofactors to catalyze oxidation reactions. They play a critical role in metabolism of many classes of drugs, are an attractive target for drug development, and mediate several prominent drug interactions. Many substrates and inhibitors alter the spin state of the ferric heme by displacing the heme’s axial water ligand in the resting enzyme to yield a pentacoordinate iron (type I complex), or they replace the axial water to yield a nitrogen-ligated hexacoordinate iron (type II complex), which are traditionally assigned by UV-vis spectroscopy. However, crystal structures and recent pulsed electron paramagnetic resonance (EPR) studies find a few cases where molecules hydrogen bond to the axial water. The water-bridged drug-H2O-heme has UV-vis spectra similar to type II complexes, but are closer to “reverse type I” complexes described in older liteature. Here, pulsed and continuous wave (CW) EPR demonstrate that water-bridged complexes are remarkably common among a range of nitrogenous drugs or drug fragments that bind to CYP3A4 or CYP2C9. Principal component analysis reveals a distinct clustering of CW EPR spectral parameters for water-bridged complexes. CW EPR reveals heterogeneous mixtures of ligated states, including multiple type II complexes and water-bridged heme complexes. These results suggest that water-bridged complexes are under-represented in CYP structural databases and can have energies similar to other ligation modes. The data indicates that water-bridged binding modes can be identified and distinguished from directly-coordinated binding by CW EPR.
Keywords: cytochrome P450, drug binding, EPR, HYSCORE
Graphical abstract
1. Introduction
Cytochrome P450 enzymes (CYPs) are a superfamily of heme monooxygenase enzymes present in nearly every living organism. CYPs perform essential biosynthetic tasks, including synthesis of a variety of hormones and second messengers [1]. They are also responsible for xenobiotic detoxification, and, in humans, they metabolize the majority of drugs on the market today [2]. Since they play a critical role in drug metabolism, CYPs are important concerns in drug design because they oftentimes determine the lifetime and efficacy of drugs. CYPs can be the target of a drug when a pathogenic organism has an isoform essential for its survival [3]. In addition, CYPs are implicated in a variety of drug/drug interactions because one drug can alter the metabolism of another drug, leading to unintentional overdoses and side effects [4]. In humans, two isoforms, CYP3A4 and CYP2C9, metabolize well over half of all pharmaceutical drugs [4]. Anything that affects the activity of either one of these isoforms could have major health impacts for many people [5–7].
The CYP active site contains a thiolate-ligated heme. In its ferric resting state, the heme exists in an equilibrium between a five-coordinate, high-spin state and a six-coordinate, low-spin state where water is the sixth axial ligand [2]. The paradigm for drug binding in CYPs is that drugs bind in two ways, which are observed in numerous crystal structures [5, 8]. These two binding modes are correlated with optical difference spectra used for high-throughput drug screening or for measuring binding constants for drugs and inhibitors [9]. The optical difference spectra are obtained by subtracting the absorption spectrum of the ligand free CYP from the spectrum of the [CYP • drug] complex, and typically fall into two classes. The “type I” difference spectrum has a minimum near 430 nm and a maximum at ~390 nm, and “type II” has a maximum at ~434 nm but a minimum near 410 nm. The type I spectrum is often assumed to indicate formation of a five-coordinate, high-spin heme complex where the drug has displaced the axial water but has not replaced it. The type II spectrum is often assumed to indicate formation of a six-coordinate, low-spin heme, where the drug replaces the axial water, coordinating directly to the heme iron [10]. These two binding modes: displacement versus replacement of the axial water, are present in nearly all crystal structures of CYPs with drugs, substrate analogs, and inhibitors. Drugs that contain substituted amines, typically as nitrogen heterocycles, are more nucleophilic than water and tend to replace the axial water ligand and directly coordinate the heme iron, giving a type II optical difference spectrum [11, 12]. However, not all difference spectra meet the strict definitions for type I or type II spectra. For example, a reverse type I spectrum is an inverted type I spectrum with a ~430 nm maximum and a ~390 nm minimum [13, 14]. Reverse type I spectra resemble red-shifted type II spectra and are often classified as type II. Coordination to the heme by a heteroatom other than nitrogen to the heme is proposed as the cause of some, but not all of, reverse type I spectra [15]. Some CYP complexes have optical difference spectra that defy classification [3]. The usefulness of the binary type I – type II classification encourages the perception that drug binding is also binary: that every bound compound can only replace the axial water or displace it.
CYP crystal structures containing drugs or substrates occasionally have binding modes that neither replace or displace the axial water. The complexes of CYP125A1 with LP10 (Figure 1) [16]; CYP121A1 with fluconazole [17]; CYP121 with cyclodityrosine [18]; and possibly CYP101A1 with 2-phenylimidazole [8] all show drug or substrate in the binding pocket with the axial water intact and forming a hydrogen-bonded bridge to the drug. The crystal structure of the complex of CYP121A1 with fluconazole is notable because it contains different mixtures of water-bridged and directly-coordinated fluconazoles in each of the six CYP121A molecules that make up the asymmetric unit, suggesting that the binding energies are so similar that the two binding modes coexist in the crystal [17]. We detected water-bridged complexes in solutions of CYP125A1 with LP10, CYP2C9d with phenylpropyl triazole (PPT), and CYP3A4 with a triazole-substituted estradiol analog (17-click) using pulsed EPR [3]. Hyperfine sub-level correlation spectroscopy (HYSCORE) measurements of these solutions show resolved peaks from the 1H nuclei of the axial water ligand [19, 20]. The proton peaks on the axial water in CYPs have been identified and carefully characterized with pulsed EPR in previous literature [2, 12, 19–22]. The 1H nuclei are ~0.27 nm above the iron and the plane of the heme, and the HYSCORE peaks provide a distinct signature that water is the sixth ligand [3]. We used 15N-labeled PPT to prove that PPT was bound in a position to hydrogen bond to that axial water by measuring both the 1H from the axial water and the 15N from PPT in the same complex of CYP2C9d with PPT [3] at 15 K where movement and ligand exchange were “frozen out.” Collectively, these observations of water bridges between the heme and bound ligands indicate that the simple two-state, high-spin vs. low-spin, type I vs. type II paradigm is oversimplified, and more detailed characterization of CYP complexes is needed.
Figure 1.
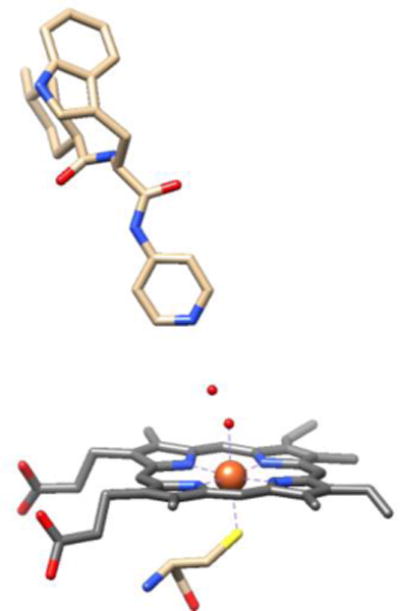
CYP125A1 in a water-bridged complex with LP10. Adapted from the 1.5 Å resolution crystallographic data of CYP125A1, PDB: 2XC3. Small red spheres above the heme iron are oxygen atoms of water molecules.
Water-bridged CYP complexes are quite rare in the crystal structure database, yet our pulsed EPR studies found a high frequency of examples in the CYP-drug complexes we studied [3]. This suggests that water-bridged complexes are highly underrepresented in the crystal structure database, and may be more common in solution and in vivo. In this paper, we examine the two major human drug-metabolizing CYP isoforms, CYP3A4 and CYP2C9d, in complexes with several drugs, drug fragments, and inhibitors. We chose to look at these two isoforms specifically because they are the largest contributors to drug metabolism, with CYP3A4 metabolizing ~50% and CYP2C9 metabolizing ~16% of all drugs that are metabolized by enzymes in the human body [4]. We aim to determine whether water-bridged complexes of these important isoforms are indeed rare or simply under-represented in the crystal structure database, and we describe a simple spectroscopic method to identify these water-bridged complexes from CW-EPR spectral parameters. We find significant heterogeneity of heme ligation states for many drugs and inhibitors that is not readily apparent from the optical absorbance spectra, including a significant contribution in many cases from the water-bridged binding mode.
2. Materials and methods
2.1 Protein Sample Preparation
CYP2C9d was prepared as previously described [3, 23]. The protein was expressed in DL39 Escherichia coli and contains a His6 C-terminal tag to facilitate purification and several amino acid substitutions to increase solubility [3, 23]. CYP3A4 was also prepared as previously described [2, 24]. Drug concentrations were chosen to be saturating (generally ~10 times the KD at room temperature), but in some cases, residual unbound, i.e., resting state, enzyme was present in the frozen sample. The concentrations used in all samples can be found in SI Table S1. Each structurally-distinct heme complex has a distinct EPR spectrum because the ligand fields are such that both forms can be deconvoluted and studied independently in the same sample. EPR samples were prepared and frozen as previously described [3, 12]. No high spin heme was observed for any samples; this could be due in part to the fact that they were frozen in liquid nitrogen over the course of a few seconds. The freeze rate and method do seem to influence the proportion of high spin heme present, and liquid nitrogen has been reported to produce more low spin complexes [18]. All of these compounds have pharmaceutical significance. Acetaminophen and caffeine are common drugs, and 17-click and 17-EE are analogs of ethinylestradiol, an estrogen medication. The other compounds are nitrogen heterocycles, which are commonly incorporated into drugs to improve metabolic stability and potency [10, 25, 26]. Specifically, the 1,2,3-triazole moiety is a central scaffold moiety in fragment-based drug design since the discovery of click chemistry in 2001 [27–29]. Both 1,2,4-triazole and imidazole are common moieties found in many approved drugs [30]. Structures of all the compounds used are shown in Figure 2 and will be referred to as “drugs” for convenience.
Figure 2.
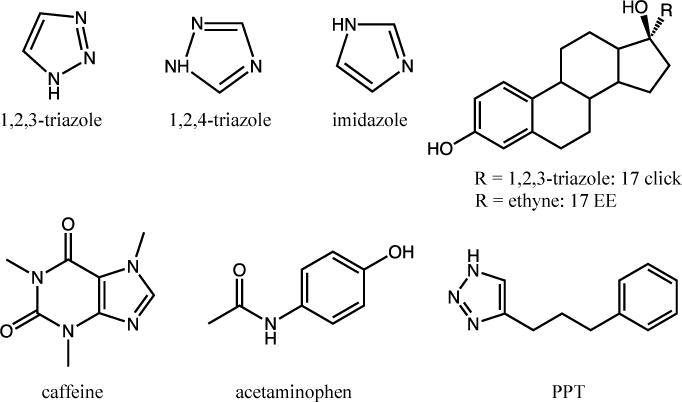
Structures of all drugs used.
2.2 EPR spectroscopy
CW EPR spectra were measured on a Bruker ELEXYS E540 X-band spectrometer with an ER 4102 ST resonator (Bruker-Biospin, Billerica, MA). CW spectra were measured at a nominal microwave frequency of 9.45 GHz. Spectra were recorded at 77 K using a liquid-nitrogen quartz insertion Dewar or at 15 K using a Bruker ER 4112 HV helium flow cryostat.
HYSCORE measurements were made at 10–15 K with a nominal microwave frequency of 9.76 GHz using an ELEXSYS E680 EPR spectrometer (Bruker-Biospin, Billerica, MA) equipped with a Bruker Flexline ER 4118 CF cryostat and an ER 4118X-MD4 ENDOR resonator. HYSCORE measurements used a four pulse sequence, π/2−τ−π/2−t1−π−t2−π/2−τ−echo repeated at a rate of 2 kHz, where π/2 and π represent pulses 16 and 32 ns long, respectively, and t1, t2, and τ are delays between the pulses. The times t1 and t2 are varied independently to create the two dimensions of the HYSCORE spectrum. The delay time τ was set to 240 ns for all measurements except CYP2C9d with no drug added at 296.5 mT, which had a τ value of 288 ns to give a slightly more intense signal.
2.3 CW EPR analysis
CW EPR spectral processing and simulations were done using MATLAB (MathWorks, R2017a) and the EasySpin package [31]. Spectral baselines were corrected using a polynomial fitting function. Some spectra have a background signal in the range g = 1.96–2.08 from contaminants in the EPR cavity. The contaminants appear between gx and gy in our samples and do not interfere with the CYP measurements. The g-values (or peak positions) and g-strains (related to peak widths arising from a distribution of ligand fields and any hyperfine broadening) for each complex in the spectrum were determined using the “pepper” function in EasySpin. The g-values of the drug-free resting state were obtained from samples without drug. Each sample that included drug typically contained spectra of the drug-free, resting form of the enzyme and of one or more forms with drug bound. Spectra were simulated by adding spectral complexes one at a time until their sum fit the experimental spectrum.
2.4 Ligand field analysis
Analysis of ligand field parameters was done using MATLAB. The g-values for each spectral complex were used to calculate that complex’s tetragonal field, Δ/λ, which is the axial distortion of the ligand field, and rhombicity, V/Δ, or the degree by which the ligand field is non-axial. Palmer’s convention [32] was used to calculate the ligand field parameters as
Where Δ, λ and V are the tetragonal splitting, the spin-orbit coupling constant, and the rhombic splitting, respectively. Ligand-field parameters are plotted as in Blumberg and Peisach [33], using a coordinate system in which gx, gy, and gz correspond to gmin, gmid, and gmax, respectively [34]. Plots were made using OriginLab (OriginPro 2016 (64-bit) Sr2).
2.5 Principal component analysis (PCA)
Principal component analysis was done with OriginLab using the covariance matrix. The g-values and g-strains for each complex in each simulation was entered into a matrix (SI Tables 2 and 3). Principal component analysis is a multivariate statistical technique to extract valuable information from datasets that contain sets of inter-correlated parameters, in our case, the g-values and g-strains from CW EPR spectra. PCA finds the combination of parameters that best account for the differences between the CW EPR spectra [36]. The degree to which each principal component contributes to the overall variance can be determined using a scree plot, which plots the eigenvalue (or fraction of total variance) versus the principal component number. The point at which the plot significantly changes slope represents the number of principal components that are significant for describing the CW EPR spectra [35]. In our analysis, six principal components were obtained, but only two are significant and account for the majority of the variance in CW EPR spectra. Therefore, only the first two principal components were used in biplots, which are scatter plots that show the values of the significant principal components for each CW EPR spectrum.
3. Results
3.1 CW EPR spectra
CW EPR spectra were obtained for CYP3A4 and CYP2C9d without drugs and in complex with the drugs and fragments shown in Figure 1. In every case, the CW EPR spectrum contained a mixture of low-spin complexes. CYP2C9d with 1,2,4-triazole, Figure 3A, demonstrates a typical mixture with three distinct complexes. EPR parameters for each complex in all samples are collected in SI Tables 2 and 3. CW spectra were simulated for a nominal frequency of 9.769 GHz (the average in the HYSCORE measurements) as absorption spectra to aid in planning the pulsed EPR measurements. The calculated absorption spectra for CYP2C9d with 1,2,4-triazole and each of its three complexes are shown in 3B.
Figure 3.
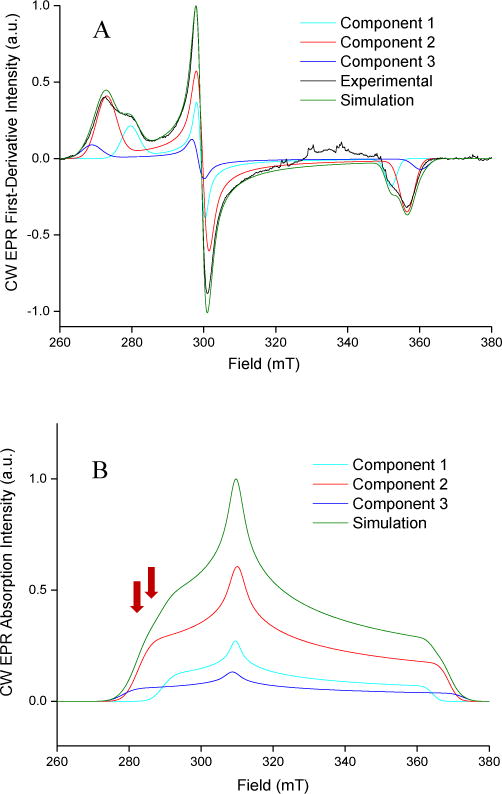
CW-EPR spectrum and simulations. (A) The CW-EPR spectrum of CYP2C9d with 124 TRZ. The spectrum was taken at a microwave power of 3.334 mW, a modulation amplitude of 10.0 G, and a modulation frequency of 100 kHz. The simulated components that represent different complexes in the sample are labeled as component 1, component 2, and component 3. (B) The frequency-shifted absorbance CW-EPR spectrum of CYP2C9d with 124 TRZ.
The EPR g-value reflects the magnetic moment of the unpaired electron in an applied magnetic field and depends on the orientation of that field relative to the heme. CYPs have three characteristic g-values, gx, gy, and gz, which correspond to physical axes of the heme with gz perpendicular to the heme plane [3]. Spectra of the 1H of the axial water ligand are best resolved from signals of other 1H when the magnetic field is parallel to the O-Fe coordination bond and perpendicular to the heme plane. CYPs with this orientation appear in the EPR spectrum near gz, so HYSCORE or ENDOR measurements near gz select those CYPs oriented optimally for determining the presence or absence of 1H of an axial water ligand. Each complex has a different gz value, so we could control which complexes contributed to a HYSCORE spectrum by selecting the g-value (magnetic field) for the HYSCORE measurement. In this way, we could determine the HYSCORE spectrum and the presence or absence of an axial water ligand for most of the spectral complexes [36].
3.2 HYSCORE spectra
Electron spin echo envelope modulation (ESEEM) and HYSCORE spectra have been used to observe water peaks of the axial water ligand of resting state and water-bridged CYPs [2, 3, 12, 19, 20, 22]. In brief, peaks appear in pairs at the ENDOR frequencies, which are the 1H NMR frequency shifted by half the hyperfine coupling. The 1H nuclei nearest to the heme iron have the largest hyperfine coupling and the largest changes in the hyperfine measured at different positions in the EPR spectrum, which can be used to determine their physical position relative to the heme. The two most prominent sets of 1H peak pairs have locations consistent with the protons of an axial water ligand and of the β-carbon of the coordinated cysteine. The two pairs of peaks are distinct and do not overlap with other weakly coupled protons in the protein because of their significant hyperfine coupling to the heme [36]. When a ligand such as imidazole or triazole displaces the axial water, the water proton peaks disappear but the cysteine peaks remain [2, 3, 12, 22]. In the case of imidazole, we observed the disappearance of the axial water peaks and the appearance of more distant 1H peaks from the imidazole [22]. The HYSCORE spectra of directly-coordinated drugs contain peaks from nitrogen atoms on the drug, but these peaks are not always distinct from those of the heme nitrogen atoms, although normalization and subtraction of the drug-free spectrum usually can identify the peaks from directly-coordinated nitrogen [22]. In HYSCORE spectra, the disappearance of water protons is the best indicator of replacement of the axial water by the drug.
The mode of binding for each complex in the EPR spectrum was assigned as water-bridging (WB) or directly-coordinated (DC) based on the presence or absence of water proton peaks in the HYSCORE data for that complex [3]. For example, two HYSCORE spectra of a sample with 1,2,4-triazole and CYP2C9d are shown in Figure 4. The spectrum measured at a magnetic field of 293.0 mT, Figure 4B, contains a pair of peaks from 1H of an axial water with coordinates of about [10 MHz, 15 MHz] and [15 MHz, 10 MHz] as indicated by red arrows. Slightly weaker peaks, near 11 and 14 MHz, are from 1H on the β-carbon of the cysteine coordinated to the heme. These peaks are not exchangeable in deuterated buffers and have the right distance and orientation to be the protons on the β-carbon of cysteine. These cysteine peaks serve as a positive control and intensity benchmark in the HYSCORE spectrum. The spectrum in Figure 4A was measured at a magnetic field of 283.5 mT and clearly shows the cysteine peaks but no water peaks, even with the contour levels set much lower than in Figure 4B.
Figure 4.
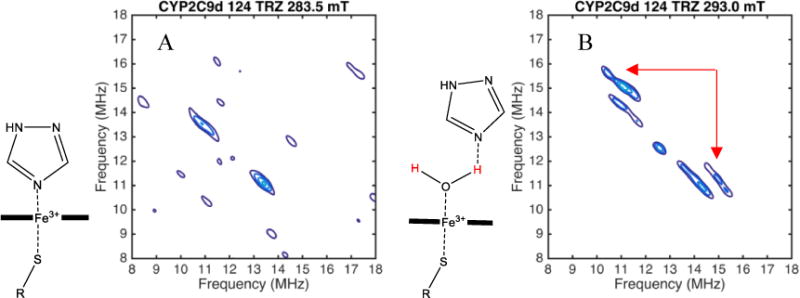
HYSCORE spectrum of CYP2C9d with 124 TRZ at 283.5 mT (A) and CYP2C9d with 124 TRZ at 293.0 mT (B). Peaks from the axial water in the spectrum at 293.0 mT are indicated with red arrows.
The spectrum in Figure 4A was measured at 283.5 mT, indicated by the left-most red arrow, in Figure 3B. Only complexes 2 and 3 (in red and dark blue, respectively) contribute to the CW EPR and HYSCORE spectra at that field, which indicates that both have the drug directly coordinating the heme iron because the heme is still low spin, with no axial water ligand. The HYSCORE spectrum in Figure 4B measured at the 293.0 mT, indicated by the right red arrow in Figure 3B includes complex 1 (light blue) in addition to complexes 2 and 3. Because peaks from the axial water ligand now appear in the HYSCORE spectrum at this field, but not at 283.5 mT where only complexes 2 and 3 are observed, we can assign complex 1 as having an axial water ligand. Complex 1 has g-values that are distinct from the resting state enzyme; therefore, we conclude that it is not residual resting state enzyme and assign it as a distinct water-bridged complex.
This procedure allowed us to assign the binding mode for the majority of complexes seen in the CW EPR spectra. The binding mode of some complexes with strong spectral overlap could not be assigned definitively from the HYSCORE spectra, so their binding mode is conservatively indicated as unknown (UKN). This typically occurs when gz peaks are nearly superimposed, so that their HYSCORE spectra cannot be distinguished, and at least one complex contains water or is water-bridged. We only assigned complexes as ‘water-bridged’ when it could be done unambiguously. Thus several of the ‘unknown’ components may be water bridged as well. Complexes in samples with added drug that had an EPR spectrum indistinguishable from that of resting state samples with no drug were assigned as residual unbound CYP (resting) and always showed bound water. The binding mode assignments are tabulated in Tables 1 and 2.
Table 1.
All EPR spectra complexes with their corresponding weights and assigned binding modes for CYP3A4 samples. Complexes labeled in blue as “resting state” are resting state enzyme, “DC” are directly-coordinated, “WB” are water-bridged, and “UKN” are unknown complexes where a binding mode could not be assigned.
| Sample Complex | Contribution (%) | Binding Mode |
|---|---|---|
|
| ||
| no drug | 76.3 | resting state |
| 23.7 | resting state | |
|
| ||
| 17-click | 76.3 | WB |
| 23.7 | UKN | |
|
| ||
| 17-EE | 75.1 | WB |
| 24.9 | UKN | |
|
| ||
| 1,2,3-TRZ | 5.8 | UKN |
| 62.8 | DC | |
| 31.4 | DC | |
|
| ||
| 1,2,4-TRZ | 15.3 | UKN |
| 58.4 | DC | |
| 26.3 | DC | |
|
| ||
| IMZ | 78.4 | DC |
| 21.6 | UKN | |
|
| ||
| APAP | 57.9 | WB |
| 42.1 | UKN | |
|
| ||
| APAP and caffeine | 58.3 | WB |
| 41.7 | UKN | |
|
| ||
| caffeine | 67.3 | WB |
| 32.7 | UKN | |
Table 2.
All EPR spectra complexes with their corresponding weights and assigned binding modes for CYP2C9d samples. Complexes labeled in blue as “resting state” are resting state enzyme, “DC” are directly-coordinated, “WB” are water-bridged, and “UKN” are unknown complexes where a binding mode could not be assigned.
| Sample Complex | Contribution (%) | Binding Mode |
|---|---|---|
|
| ||
| no drug | 74.0 | resting state |
| 26.0 | resting state | |
|
| ||
| 1,2,3-TRZ | 14.2 | WB |
| 60.1 | DC | |
| 25.7 | DC | |
|
| ||
| 1,2,4-TRZ | 22.8 | WB |
| 62.7 | DC | |
| 14.5 | DC | |
|
| ||
| PPT | 20.0 | resting state |
| PPT | 14.0 | resting state |
| PPT | 51.0 | DC |
| PPT | 15.0 | UKN |
|
| ||
| IMZ | 72.6 | DC |
| IMZ | 27.4 | DC |
3.3 Analysis of gz shifts
The shift of gz from that of the resting state of the enzyme was plotted in Figure 5 as Δgz for each complex in every CW EPR spectrum. The Δgz = g(resting) − gz(+drug) in CW EPR spectra have long been correlated with the identity of the sixth axial ligand: gz shifts to higher values (lower field), with direct coordination by a strong nitrogen-coordinated ligand but shifts to lower values (higher field), with weak ligands [3, 37]. We expect the same correlation will also hold for CYP binding modes because all drug complexes either have a nitrogen from the drug as the sixth axial ligand (strong ligand) or an oxygen from the axial water that has neither been displaced or replaced (weak ligand). The points for all complexes with a drug bound and an axial water are indicated by symbols filled with a “+”, and the complexes with the drug replacing the axial water are indicated by solid symbols. Points that are filled with a “+” but lie directly at Δgz = 0 represent the resting state with no bound drug. Remarkably, every assigned complex with a drug replacing the axial water (solid symbols) has a negative Δgz, < −0.03, corresponding to a shift to lower field relative to the resting state. All known water-bridged complexes in the CYP2C9d samples have a Δgz ≥ 0, all are significantly shifted from the resting state. On the other hand, water-bridged complexes in CYP3A4 are clustered near the resting state gz value, with Δgz~0, perhaps indicating a weaker perturbation upon drug binding.
Figure 5.
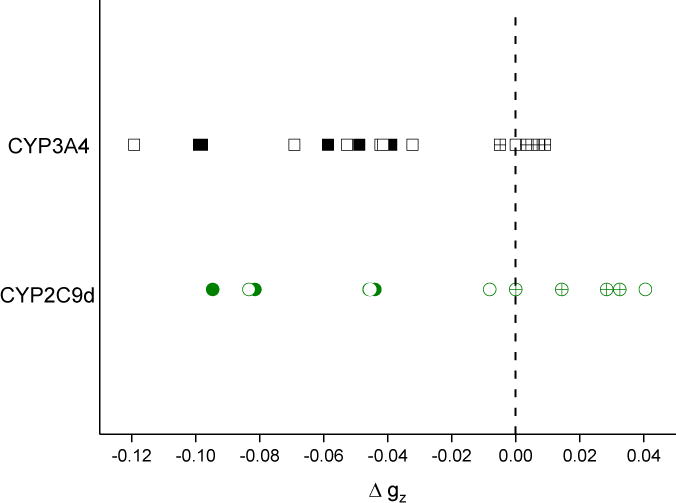
Correlation of binding mode with shift in gz. Points are colored by isoform; green circles are CYP2C9d complexes and black squares are CYP3A4 complexes. Solid points represent directly-coordinated complexes, points filled with a + represent water-bridged complexes, and open points represent complexes that could not be assigned a binding mode.
3.4 Ligand field parameters
The gz value in low-spin ferric heme is strongly influenced by the ligand field of the iron [34] so that perturbations or changes of the axial ligand are likely causes of the shifts observed in gz. Consequently, one could expect the ligand field to be highly correlated to the binding mode. The ligand field parameters were calculated for each complex and examined in scatter plots, sometimes known as Blumberg/Peisach truth tables [33]. Figure 6 shows the calculated tetragonal field and rhombicity of each complex in every CW EPR spectrum. A version of the plot annotated with drug complexes is available in SI as Figure S1. The two binding modes cluster in adjacent, non-overlapping groups, but neither the tetragonal field nor the rhombicity alone provides good separation between groups with different binding modes. Water-bridged complexes have higher rhombicity and tetragonal field values than the directly-coordinated complexes.
Figure 6.
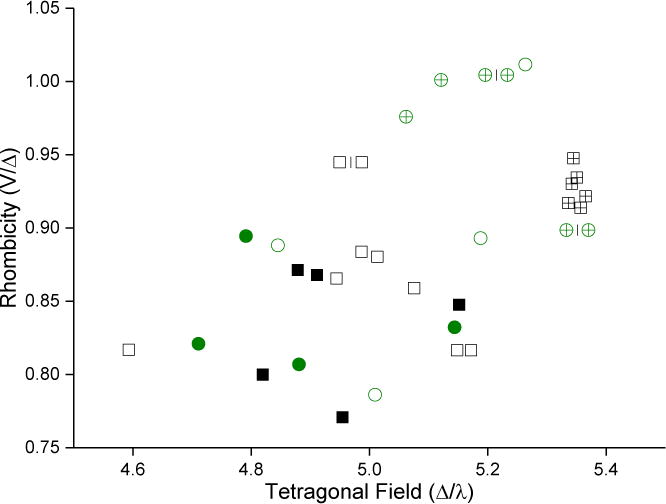
Correlation of binding mode with ligand-field parameters. Points are colored by isoform; green circles are CYP2C9d complexes and black squares are CYP3A4 complexes. Solid symbols represent directly-coordinated complexes, symbols filled with a + represent water-bridged complexes, and open symbols represent complexes for which the binding mode could not be assigned.
3.5 Principal component analysis
The complexes in the CW EPR spectra have significant variations in g-strain, which characterizes the distribution of g-values within that single complex and appears as a broadening of the EPR spectral features. The g-strain reflects natural structural variations within a complex and the rigidity of the bound complex, characteristics that are not included in the ligand field analysis. We turned to principal component analysis (PCA) so that g-strain could be conveniently considered along with all three g-values. PCA is a statistical technique that identifies the most significant trends in a set of observations, and it has proved to be useful for comparing complexes of CYP substrates and inhibitors [38]. While PCA groupings do not directly correspond to structural or functional characteristics, they can provide useful insights into underlying correlations in data. PCA was applied to the entire set of spectra, considering the three g-values and the three g-strains for each complex.
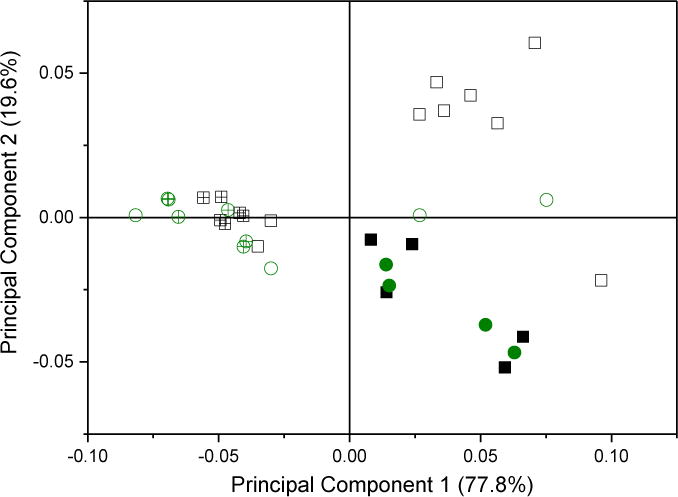
A scree plot of the loading for all samples, Figure 7A inset, shows the relative contribution of each principal component to the overall variance of the dataset. Only the first two principal components are significant, as determined by the break as the slope becomes ~0 in the scree plot. The first principal component accounts for about 75 % of the total variation between spectra. The largest part of the first principal component is gz, as might be expected from the trends seen for Δgz, with significant contributions from gz strain and gz−gx, Figure 7A. In contrast, gz strain is the major part of the second principal component.
Figure 7.
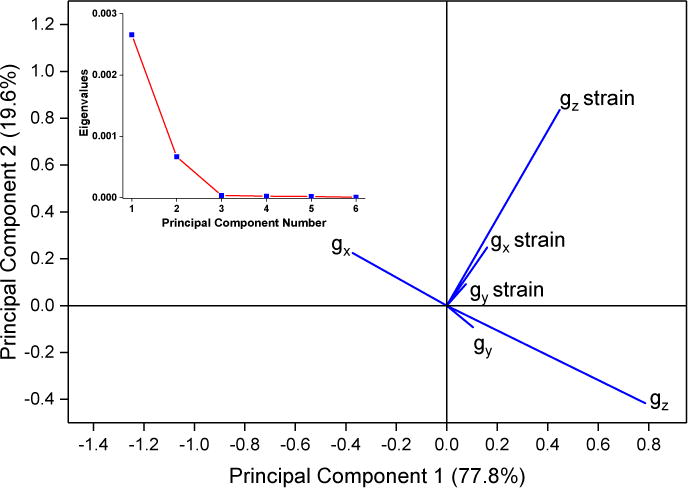
A: The loadings and scree plot (inset). The loading vectors represent the overall contribution of each observation with respect to the first and second principal components.
B: A biplot of the scores with respect to the first and second principal components. Points are colored by isoform; green circles are CYP2C9d complexes and black squares are CYP3A4 complexes. Solid symbols represent directly-coordinated complexes, symbols filled with a + represent water-bridged complexes, and open symbols represent complexes for which the binding mode could not be assigned.
The small contributions by gy, gx strain and gy strain to the first two principal values shows that they are rather insensitive to axial ligand in the complex. A biplot of the dataset, Figure 7B, maps each complex into its first two principal components and is colored by isoform. A version annotated with the drug complexes is available in SI, Figure 2S. Water-bridged complexes form a distinct cluster on the left-hand side that is clearly separate from the directly-coordinated complexes. Every assigned complex with a negative score on the first principal component axis is water-bridged, while every assigned complex with a positive score is directly-coordinated. Water-bridged complexes have scores for the second principal component very close to zero, while the directly-coordinated complexes have a large scatter in the second principal component. Multiple complexes with the same binding mode, Figure 2S, have minor variations along the first and second principal components. The variations do not represent major differences in binding, but they could reflect different ligand-iron rotamers, variations in H-bonding networks, or different protonation states of the protein [18]. The clear distinction of binding mode by these two principal component suggests that the binding mode could be assigned solely by CW-EPR spectra.
4. Discussion
4.1 Extent of water-bridged complexes
Several significant conclusions emerge from this work. The first concerns the prevalence of water-bridged complexes in both CYP3A4 and CYP2C9 and for a wide range of drug fragments or drugs. With CYP3A4, 28% of the total complexes observed in the samples are water-bridged complexes (omitting residual resting states), and with CYP2C9d, 20% are water- bridged. In fact, it is striking that acetaminophen and caffeine, which are both substrates and drugs, yield large fractions of water-bridged complexes (50%) with CYP3A4. Similarly, the drug-like compounds 17-click and 17-EE, which are analogs of ethynyl estradiol, yield 50% water-bridged heme with CYP3A4. The complexes in which the axial water has neither been displaced nor replaced occur rather frequently and are not readily detectable in optical difference spectra.
Our current and previous data demonstrate that water-bridging occurs with a range of structurally distinct nitrogenous compounds including imidazoles, triazoles, pyridines, methyl xanthines, and acyl anilines across several CYP isoforms [3, 12]. We propose that a bridging water is a common structural feature in CYP-drug complexes. These results emphasize the need to consider water-bridging in the design of CYP inhibitors based on nitrogen heterocycles and in the metabolism of nitrogenous substrates. Most drugs contain substituted amines, where it is assumed that nitrogen directly coordinates the heme iron when a type II optical difference spectrum is observed [11]. However, water-bridged complexes are surprisingly abundant in the complexes examined here, with water-bridged and directly-coordinated complexes often coexisting in the same sample.
It is interesting that the drug fragments, 1,2,3 triazole and 1,2,4 triazole, do not form water-bridged complexes with CYP3A4 but both do form water bridges with CYP2C9. This is an important indication that the type of complex formed is not entirely dictated by the nature of the fragment or nitrogen heterocycle and underscores the involvement of the enzyme active site architecture and solvation in the accommodation of specific heme ligation states. A previous study comparing the binding of several type II ligands to CYP3A4 and CYP2C9 found that CYP2C9 displayed more complex binding behavior than CYP3A4, and in some cases multiple binding events were observed [30]. It is possible that some of the complexities observed are due to the retention of the axial water ligand in a fraction of the drug-bound complexes.
Water-bridged ligation is not unique to nitrogenous compounds. Similar findings appear in other studies. A very recent study of a substrate, cyclodityrosine (cYY), bound to CYP121 found that the crystal structure of the cYY-bound complex contains two water molecules forming a hydrogen-bonding bridge from cYY to the heme, which the authors propose positions the hydroxyl group of the substrate near the heme [18].
4.2 Energies of complexes
Nearly all the samples studied here that contain a drug have a mixture of coexisting water-bridged, resting state, and/or directly-coordinated complexes. In particular, the triazole fragments have several spectrally-distinct, directly-coordinated complexes, suggesting heterogeneity even for complexes with direct nitrogen coordination. We cannot determine the source of this spectral heterogeneity, but it obviously arises from different geometries or bond strengths producing directly-coordinated complexes from the same constituents. These samples were flash-frozen from equilibrated liquid solutions, so the coexisting complexes could represent distinct, slowly-equilibrating complexes present in solution or binding modes trapped at local minima of the conformational energy surface of a rapidly-equilibrating, dynamic ensemble present at room temperature. Regardless of this uncertainty, the heterogeneous populations indicate that these different heme ligation states are similar in energy. Other studies have observed similar binding heterogeneities with EPR. A study on CYP2C9 binding with substituted quinoline carboxamide analogs (QCAs), which would be considered inhibitors, observed multiple distinct enzyme forms in EPR spectra for QCAs that contained a para nitrogen atom in the pyridine ring. The authors deemed this “mixed” and/or incomplete binding that might be due to an increased steric bulk that interferes with formation of a classic type II complex [10]. Multiple complexes are also observed in the study on CYP121 binding to cYY, a substrate rather than an inhibitor. They found that multiple enzyme forms, both high spin and low spin, exist in an equilibrium in solution [18].
Nitrogen heterocycles such as imidazole or 1,2,4 triazole are more nucleophilic than water and are expected to completely displace water in isolated heme systems lacking competing interactions [12]. However, the drugs also have other fragments that can interact with active site groups and bound water. As a result, drugs with directly-coordinated fragments can have competing interactions that cannot be fulfilled simultaneously and lead to multiple nearly isoenergetic complexes. The interaction with heme does not completely control the structure of the complex.
4.3 Enzyme activity
The previously mentioned study of CYP2C9 binding to carboxamide analog (QCA) scaffolds also shows that directly-coordinated compounds can still be efficiently metabolized, some with intrinsic metabolic clearance rates that are higher than the compounds that yielded type I spectra and would conventionally be considered substrates [10]. The isoenergetic complexes in our samples might help explain some of the perplexing features in turnover of directly-coordinated compounds. In the study of CYP121 binding to the substrate cYY, two water molecules formed a hydrogen bond from cYY to the heme. The authors proposed that these water molecules served a purpose in metabolism by positioning the substrate with regards to the heme [18]. We have also reported the turnover of the water-bridged complex of CYP3A4 with 17-click, where the drug was metabolized to a mixture of metabolites rather than inhibiting the enzyme [12]. The metabolism of 17-click could suggest a similar purpose for the bridging water; rather than inhibit enzyme metabolism, the hydrogen bonding network functions as a scaffold that positions the substrate in the active site. The heterogeneity in some of our samples is a mixture of directly-coordinated complexes, some of which could be classically-inhibited and some of which could be active, and water-bridged complexes, which could render the mixture catalytically active, even if the mixture has a type II difference spectrum.
4.4 Characterizing binding mode
Finally, the analysis of gz shifts, ligand field parameters, and PCA shows an excellent correlation between the ligand field of the heme, as reflected in CW EPR parameters, and the CYP binding mode, with most of the EPR spectral variation arising from differences in heme ligation. The data include a variety of CYP isoforms and drug combinations, suggesting that binding modes can be assigned accurately from CW EPR parameters with other isoforms and drugs. The first principal component shows the best discrimination between modes of drug binding. CW EPR measurements are much faster than crystallographic or HYSCORE measurements and may be a reliable way to distinguish between direct heme coordination and water-bridged complexes that also determines heterogeneity in binding. The CW EPR approach does need additional validation with more CYP isoforms and more drugs. However, EPR already shows that there are multiple complexes involved in CYP/drug binding, and suggests that a binary classification of binding is too simple and may lead to misinterpretation of enzyme activity.
Supplementary Material
Synopsis.
Analysis of CW EPR parameters shows that several CYP-drug samples contain a mixture of directly-coordinated and water-bridged species. This suggests that the two binding modes are similar in energy and demonstrates that the water-bridged binding mode is more common than previously thought.
Highlights.
CYP binding modes are reflected in CW EPR spectra.
EPR distinguishes between directly-coordinated and water-bridged complexes.
Many CYP-drug complexes contain a mixture of binding modes.
Water-bridged complexes are common for nitrogenous drugs and drug fragments.
Acknowledgments
We would like to thank Drs. Kip Conner, Matt Kryzaniak, Alex Cruce, and Preethi Vennam. This work was supported by the GAANN Program, Department of Education, grant # P200A150329, and NIH GM110790 (WMA).
Abbreviations
- CYP
cytochrome P450
- CW
continuous wave
- EPR
electron paramagnetic resonance
- HYSCORE
hyperfine sublevel correlation
- LP10
α-[(4-methylcyclohexyl)carbonyl amino]-N-4-pyridinyl-1H-indole-3-propanamide)
- PPT
4-(3-phenylpropyl)-1H-1,2,3-triazole
- 17-click
17α-(2H-2,3,4-triazolyl)estradiol
- 17-EE
17-α-ethynylestradiol
- 1,2,3-TRZ
1,2,3-triazole
- 1,2,4-TRZ
1,2,4-triazole
- APAP
acetaminophen
- IMZ
imidazole
Footnotes
Publisher's Disclaimer: This is a PDF file of an unedited manuscript that has been accepted for publication. As a service to our customers we are providing this early version of the manuscript. The manuscript will undergo copyediting, typesetting, and review of the resulting proof before it is published in its final citable form. Please note that during the production process errors may be discovered which could affect the content, and all legal disclaimers that apply to the journal pertain.
Conflicts of interest
The authors declare that they have no conflicts of interest.
Supplementary data
Supplementary data to this article can be found online at ….
References
- 1.Atkins WM. Annu Rev Pharmacol Toxicol. 2005;45:291–310. doi: 10.1146/annurev.pharmtox.45.120403.100004. [DOI] [PubMed] [Google Scholar]
- 2.Conner KP, Schimpf AM, Cruce AA, McLean KJ, Munro AW, Frank DJ, Krzyaniak MD, Ortiz de Montellano P, Bowman MK, Atkins WM. Biochemistry. 2014;53:1428–1434. doi: 10.1021/bi401547j. [DOI] [PMC free article] [PubMed] [Google Scholar]
- 3.Conner KP, Cruce AA, Krzyaniak MD, Schimpf AM, Frank DJ, Ortiz de Montellano P, Atkins WM, Bowman MK. Biochemistry. Vol. 54. American Chemical Society; 2015. pp. 1198–1207. [DOI] [PMC free article] [PubMed] [Google Scholar]
- 4.Guengerich FP. Human Cytochrome P450 Enzymes. In: Ortiz de Montellano P, editor. Cytochrome P450 Structure, Mechanism, and Biochemistry. Springer International Publishing; Switzerland: 2015. pp. 523–785. [Google Scholar]
- 5.Ekroos M, Sjogren T. Proc Natl Acad Sci U S A. Vol. 103. National Academy of Sciences; 2006. pp. 13682–13687. [DOI] [PMC free article] [PubMed] [Google Scholar]
- 6.Williams PA, Cosme J, Vinković DM, Ward A, Angove HC, Day PJ, Vonrhein C, Tickle IJ, Jhoti H. Science. 2004;305:683. doi: 10.1126/science.1099736. [DOI] [PubMed] [Google Scholar]
- 7.Yano JK, Wester MR, Schoch GA, Griffin KJ, Stout CD, Johnson EF. Journal of Biological Chemistry. 2004;279:38091–38094. doi: 10.1074/jbc.C400293200. [DOI] [PubMed] [Google Scholar]
- 8.Poulos TL, Howard AJ. Biochemistry. Vol. 26. American Chemical Society; 1987. pp. 8165–8174. [DOI] [PubMed] [Google Scholar]
- 9.Podust LM, von Kries JP, Eddine AN, Kim Y, Yermalitskaya LV, Kuehne R, Ouellet H, Warrier T, Altekoster M, Lee JS, Rademann J, Oschkinat H, Kaufmann SH, Waterman MR. Antimicrob Agents Chemother. Vol. 51. American Society for Microbiology (ASM); 2007. pp. 3915–3923. [DOI] [PMC free article] [PubMed] [Google Scholar]
- 10.Peng CC, Cape JL, Rushmore T, Crouch GJ, Jones JP. J Med Chem. 2008;51:8000–8011. doi: 10.1021/jm8011257. [DOI] [PMC free article] [PubMed] [Google Scholar]
- 11.Schenkman JB. Biochemistry. Vol. 9. American Chemical Society; 1970. pp. 2081–2091. [DOI] [PubMed] [Google Scholar]
- 12.Conner KP, Vennam P, Woods CM, Krzyaniak MD, Bowman MK, Atkins WM. Biochemistry. 2012;51:6441–6457. doi: 10.1021/bi300744z. [DOI] [PMC free article] [PubMed] [Google Scholar]
- 13.Schenkman JB, Cinti DL, Orrenius S, Moldeus P, Kraschnitz R. Biochemistry. Vol. 11. American Chemical Society; 1972. pp. 4243–4251. [DOI] [PubMed] [Google Scholar]
- 14.Kumaki K, Sato M, Kon H, Nebert DW. J Biol Chem. 1978;253:1048–1058. [PubMed] [Google Scholar]
- 15.Shimada T, Tanaka K, Takenaka S, Foroozesh MK, Murayama N, Yamazaki H, Guengerich FP, Komori M. Chem Res Toxicol. Vol. 22. American Chemical Society; 2009. pp. 1325–1333. [DOI] [PMC free article] [PubMed] [Google Scholar]
- 16.Ouellet H, Kells PM, Ortiz de Montellano PR, Podust LM. Bioorganic & medicinal chemistry letters. 2011;21:332–337. doi: 10.1016/j.bmcl.2010.11.007. [DOI] [PMC free article] [PubMed] [Google Scholar]
- 17.Seward HE, Roujeinikova A, McLean KJ, Munro AW, Leys D. J Biol Chem. 2006;281:39437–39443. doi: 10.1074/jbc.M607665200. [DOI] [PubMed] [Google Scholar]
- 18.Fielding AJ, Dornevil K, Ma L, Davis I, Liu A. Journal of the American Chemical Society. Vol. 139. American Chemical Society; 2017. pp. 17484–17499. [DOI] [PMC free article] [PubMed] [Google Scholar]
- 19.Goldfarb D, Bernardo M, Thomann H, Kroneck PMH, Ullrich V. Journal of the American Chemical Society. Vol. 118. American Chemical Society; 1996. pp. 2686–2693. [Google Scholar]
- 20.Thomann H, Bernardo M, Goldfarb D, Kroneck PMH, Ullrich V. J Am Chem Soc. 1995;117:8243–8251. [Google Scholar]
- 21.LoBrutto R, Scholes CP, Wagner GC, Gunsalus IC, Debrunner PG. Journal of the American Chemical Society. Vol. 102. American Chemical Society; 1980. pp. 1167–1170. [Google Scholar]
- 22.Roberts AG, Cheesman MJ, Primak A, Bowman MK, Atkins WM, Rettie AE. Biochemistry. Vol. 49. American Chemical Society; 2010. pp. 8700–8708. [DOI] [PMC free article] [PubMed] [Google Scholar]
- 23.Williams PA, Cosme J, Ward A, Angove HC, Matak Vinkovic D, Jhoti H. Nature. 2003;424:464–468. doi: 10.1038/nature01862. [DOI] [PubMed] [Google Scholar]
- 24.Woods CM, Fernandez C, Kunze KL, Atkins WM. Biochemistry. Vol. 50. American Chemical Society; 2011. pp. 10041–10051. [DOI] [PMC free article] [PubMed] [Google Scholar]
- 25.Chiba M, Jin L, Neway W, Vacca JP, Tata JR, Chapman K, Lin JH. Drug Metabolism and Disposition. 2001;29:1. [PubMed] [Google Scholar]
- 26.Chiba M, Tang C, Neway WE, Williams TM, Jane Desolms S, Dinsmore CJ, Wai JS, Lin JH. Biochemical Pharmacology. 2001;62:773–776. doi: 10.1016/s0006-2952(01)00724-9. [DOI] [PubMed] [Google Scholar]
- 27.Meldal M, Tornøe CW. Chemical Reviews. Vol. 108. American Chemical Society; 2008. pp. 2952–3015. [DOI] [PubMed] [Google Scholar]
- 28.Kolb HC, Sharpless KB. Drug Discovery Today. 2003;8:1128–1137. doi: 10.1016/s1359-6446(03)02933-7. [DOI] [PubMed] [Google Scholar]
- 29.Krasiński A, Radić Z, Manetsch R, Raushel J, Taylor P, Sharpless KB, Kolb HC. Journal of the American Chemical Society. Vol. 127. American Chemical Society; 2005. pp. 6686–6692. [DOI] [PubMed] [Google Scholar]
- 30.Locuson CW, Hutzler JM, Tracy TS. Drug Metabolism and Disposition. 2007;35:614. doi: 10.1124/dmd.106.012609. [DOI] [PubMed] [Google Scholar]
- 31.Stoll S, Schweiger A. J Magn Reson. 2006;178:42–55. doi: 10.1016/j.jmr.2005.08.013. [DOI] [PubMed] [Google Scholar]
- 32.Palmer G. Biochem Soc Trans. 1985;13:548–560. doi: 10.1042/bst0130548. [DOI] [PubMed] [Google Scholar]
- 33.Blumberg W, Peisach J, Chance B, Yonetani T. Probes of enzymes and hemoproteins. Academic; New York: 1971. pp. 215–228. [Google Scholar]
- 34.Taylor CP. Biochim Biophys Acta. 1977;491:137–148. doi: 10.1016/0005-2795(77)90049-6. [DOI] [PubMed] [Google Scholar]
- 35.Jing N, Jiang XT, Wang Q, Tang YJ, Zhang PD. Analytical Methods. 2014;6:5590–5595. [Google Scholar]
- 36.Cruce AA, Lockart M, Bowman MK. In: Methods in Enzymology. Qin PZ, Warncke K, editors. Vol. 563. Academic Press; 2015. pp. 311–340. [DOI] [PubMed] [Google Scholar]
- 37.Peisach J, Foundations of Modern EPR World Scientific. 1998:346–360. [Google Scholar]
- 38.Nath A, Atkins W. Drug Metab Dispos. 2008;36:2151–2155. doi: 10.1124/dmd.108.022061. [DOI] [PMC free article] [PubMed] [Google Scholar]
Associated Data
This section collects any data citations, data availability statements, or supplementary materials included in this article.


