

Abstract
Aims/hypothesis
Insulin resistance is frequently associated with hypertension and type 2 diabetes. The cytochrome P450 (CYP) arachidonic acid epoxygenases (CYP2C, CYP2J) and their epoxyeicosatrienoic acid (EET) products lower blood pressure and may also improve glucose homeostasis. However, the direct contribution of endogenous EET production on insulin sensitivity has not been previously investigated. In this study, we tested the hypothesis that endogenous CYP2C-derived EETs alter insulin sensitivity by analysing mice lacking CYP2C44, a major EET producing enzyme, and by testing the association of plasma EETs with insulin sensitivity in humans.
Methods
We assessed insulin sensitivity in wild-type (WT) and Cyp2c44−/− mice using hyperinsulinaemic–euglycaemic clamps and isolated skeletal muscle. Insulin secretory function was assessed using hyperglycaemic clamps and isolated islets. Vascular function was tested in isolated perfused mesenteric vessels. Insulin sensitivity and secretion were assessed in humans using frequently sampled intravenous glucose tolerance tests and plasma EETs were measured by mass spectrometry.
Results
Cyp2c44−/− mice showed decreased glucose tolerance (639±39.5 vs 808±37.7 mmol l−1 min for glucose tolerance tests, p = 0.004) and insulin sensitivity compared with WT controls (hyperinsulinaemic clamp glucose infusion rate 0.22±0.02 vs 0.33±0.01 mmol kg−1 min−1 in WT and Cyp2c44−/− mice respectively, p = 0.003). Although glucose uptake was diminished in Cyp2c44−/− mice in vivo (gastrocnemius Rg 16.4±2.0 vs 6.2±1.7 μmol 100g−1 min−1, p<0.01) insulin-stimulated glucose uptake was unchanged ex vivo in isolated skeletal muscle. Capillary density was similar but vascular KATP-induced relaxation was impaired in isolated Cyp2c44−/− vessels (maximal response 39.3±6.5% of control, p < 0.001), suggesting that impaired vascular reactivity produces impaired insulin sensitivity in vivo. Similarly, plasma EETs positively correlated with insulin sensitivity in human participants.
Conclusions/interpretation
CYP2C-derived EETs contribute to insulin sensitivity in mice and in humans. Interventions to increase circulating EETs in humans could provide a novel approach to improve insulin sensitivity and treat hypertension.
Keywords: Arachidonic acid, Epoxygenases, Hypertension, Insulin secretion in vitro and in vivo, Insulin sensitivity
Introduction
Obesity, hypertension, and type 2 diabetes are linked by insulin resistance and endothelial dysfunction, although the aetiology of these associations remains unclear. Compensatory hyperinsulinaemia in insulin-resistant individuals has been associated with cardiovascular events and has been implicated in the development of hypertension [1, 2]. The cytochrome P450 (CYP) arachidonic acid epoxygenases (CYP2C, CYP2J) and their epoxyeicosatrienoic acid (EET) products lower blood pressure via renal and vascular actions [3] and may also improve glucose homeostasis.
The CYP arachidonic acid monooxygenases oxidise arachidonic acid either to 5,6-, 8,9-, 11,12- or 14,15-EET via CYP2 isoforms or to 19- or 20-hydroxyeicosatetraenoic acid (HETE) via CYP4 isoforms. EETs are hydrolysed to less biologically active dihydroxyeicosatrienoic acids (DHETs) by soluble epoxide hydrolase (sEH) [3–6]. EETs act as endothelium-derived vasodilators [7] and in mice multiple isoforms possess EET synthase activity (e.g. CYP2C40 and CYP2C44). CYP2C44 is expressed in the vascular endothelium, kidney and liver and its disruption reduces EET production, alters sodium handling and causes hypertension in response to dietary sodium or potassium loading [8–10]. Hepatic and vascular CYP2C expression and activity are decreased in rodent models of insulin resistance [11, 12]. Furthermore, decreasing EET hydrolysis by sEH inhibition or by deleting the gene encoding sEH results in increased insulin sensitivity and insulin secretion in rodents [13–15]. The effect of sEH inhibitors on insulin sensitivity is likely mediated via EETs, although the effect of disrupting endogenous EET production on insulin sensitivity has not been previously investigated.
Although insulin resistance is associated with increased cardiovascular events [16], therapies that improve insulin sensitivity (e.g. thiazolidinediones) have not improved cardiovascular outcomes [17]. Therefore, novel therapeutic targets are needed which improve both insulin sensitivity and hypertension control. EET agonists reduce blood pressure and improve glucose metabolism [11, 18]. In this study, we investigated the effect of endogenous EETs on peripheral and hepatic insulin sensitivity in mice lacking Cyp2c44 expression, and examined the association between plasma EETs and insulin sensitivity in humans.
Methods
Animals
All experiments were approved by the Vanderbilt and Medical College of Wisconsin Institutional Animal Care and Use Committees, and NIH principals of laboratory animal care were followed. 129SvJ WT and Cyp2c44−/− male mice (generated as described previously)[19] were provided a normal chow diet (Purina Laboratory Rodent 5001; St Louis, MO, USA) with free access to water and were housed in an AAALAC-accredited, temperature-controlled facility with a 12 h light–dark cycle. All studies were conducted in mice aged 12–20 weeks of age.
Hyperinsulinaemic–euglycaemic and hyperglycaemic clamps
Body composition was measured (MiniSpec LF50; Bruker Optics, The Woodlands, TX, USA). Carotid arterial and jugular venous catheters were implanted ≥ 3 days prior to study, and clamps were conducted in the Vanderbilt Mouse Metabolic Center (https://labnodes.vanderbilt.edu/mmpc, accessed 3/8/2017) [20]. The glucose infusion rate was varied to maintain whole blood glucose at ~6.4 mmol/l (115 mg/dl) during euglycaemic clamps and ~13.9 mmol/l (250 mg/dl) during hyperglycaemic clamps (Accu-Chek; Roche Diagnostics, Basel, Switzerland). Endogenous glucose appearance (EndoRa) was determined by 3-[3H]glucose tracer and tissue-specific glucose uptake by 2-deoxy[14C]glucose tracer (2-DG; Perkin Elmer, Waltham, MA, USA) as described previously [20]. Insulin (4 mU g−1 min−1; Novo Nordisk, Princeton, NJ, USA) was infused and, after the last sample, mice were euthanised and tissues were collected and stored at −80°C. Plasma insulin was measured by radioimmunoassay [20].
Islet isolation and static incubation
Pancreatic islets were isolated from male WT and Cyp2c44−/− mice at 12–16 weeks of age as previously described [20]. Islets were matched for size and number and were assessed as islet equivalents. After isolation, glucose-stimulated insulin secretion was assessed in parallel for 60 min at 37°C in 2 ml fresh RPMI-1640 containing 5.5 or 16.7 mmol/l glucose.
Glucose tolerance tests and glibenclamide-stimulated insulin secretion
Studies were performed, following National Mouse Metabolic Phenotyping Centers glucose tolerance test protocols (https://mmpc.org/shared/protocols.aspx). Mice were fasted for 5 h starting at 07:00 hours. During glucose tolerance tests, 20% wt./vol. glucose was administered by i.p. injection (2 g/kg body wt.), and tail-vein blood glucose was measured. During glibenclamide (glyburide) tests, glibenclamide (1.25 mg/kg i.p.; 0.083 mg/ml in sterile saline [154 mmol/l NaCl] + 0.2% wt./vol. DMSO; Merck Millipore, Darmstadt, Germany) was administered and saphenous vein blood was collected before and at 15 min for insulin assay [21, 22].
Western blots
Homogenised skeletal muscle or liver protein samples were separated by 12% vol./vol. SDS-PAGE and membranes were then incubated with anti-Kir6.1 (1:200 dilution; Alomone Labs, Jerusalem, Israel), anti-Kir6.2 (1:1000 dilution; Alomone Labs), anti-β-tubulin (1:2000 dilution; Cell Signaling Technology, Danvers, MA, USA), anti-pAkt (1:1000, Cell Signaling Technology) or anti-Akt (1:1000, Cell Signaling Technology) antibodies followed by horseradish peroxidase-conjugated secondary antibody (Cell Signaling Technology). Detection was carried out using enhanced chemiluminescence. Bands were quantified by densitometry using ImageQuant TL 8.1 image analysis software (GE Healthcare, Pittsburgh, PA, USA) and values were normalised to β-tubulin or Akt. All antibodies were tested for specificity as described in the manufacturer’s instruction.
Myosin heavy-chain isoform analysis
The fibre type of muscle samples was determined using SDS-PAGE electrophoresis to separate myosin heavy-chains isoforms as previously described [23]. Briefly, soleus muscles were homogenised in a buffer containing 0.1 mol/l Tris-HCl, 5 mmol/l EDTA, 40 mmol/l dithiothreitol and 10% wt./vol. SDS. Homogenates were diluted to a final concentration of 2 μg/μl in 2× sample buffer (62.5 mmol/l Tris-HCl pH 6.8, 25% vol./vol. glycerol, 40 mmol/l dithiothreitol, 2% wt./vol. SDS, 0.01% wt./vol. bromophenol blue) and then boiled for 5 min. Electrophoresis was performed in a separating SDS gel (8% vol./vol. acrylamide, 35% vol./vol. glycerol, 200 mmol/l Tris-HCl [pH 8.8], 0.4% wt./vol. SDS, 0.1 mol/l glycine, 0.1% wt./vol. ammonium persulfate and 0.05% vol./vol. Tetramethylethylenediamine). The stacking gel contained 4% vol./vol. acrylamide, 30% vol./vol. glycerol, 70 mmol/l Tris-HCl (pH 6.7), 0.4% wt./vol. SDS, 4 mmol/l EDTA, 0.1% wt./vol. ammonium persulfate and 0.05% vol./vol. Tetramethylethylenediamine. Electrophoresis was started at constant voltage of 100 V for the first 2 h and 140 V for the next 20 h. Gels were stained using Pierce silver stain kit (Thermo Scientific, Rockford IL, USA), following the manufacturer’s instruction, and bands were quantified using NIH software ImageJ 1.51a (NIH, Bethesda, MD, USA).
Quantitative PCR
Tissue RNA was extracted from freshly isolated tissues with the TRIzol Reagent (Invitrogen, Carlsbad, CA, USA) and 0.5 μg of RNA were reverse-transcribed using SuperScriptTM III (Invitrogen) and Oligo (dT). RT-PCR was performed with 5 ng cDNA using primers described in ESM Table 1. The cycling conditions were one cycle at 95°C/10 min and 40 two-segment cycles of amplification (95°C/15 s, 56°C/45 s). Fluorescence was measured at 56°C/45 s. The baseline adjustment method of the Bio-Rad CFX Manager TM version 3.0 software (Hercules, California, USA) was used to determine the Ct in each reaction. A melting curve was used to verify the presence of one gene-specific peak and the absence of primer dimer. Results are presented as fold-change normalised to β-actin and WT expression using the method [24].
Isolated mesenteric resistance artery preparation
Second-order mesenteric arteries were excised and segments were suspended between two cannulas in a pressure myograph system (Model 111P; Danish Myo Technology, Aarhus, Denmark). The bath was oxygenated in 95% O2–5% CO2 Krebs physiological salt solution (119.0 mmol/l NaCl, 25.0 mmol/l NaHCO3, 4.6 mmol/l KCl, 1.2 mmol/l KH2PO4, 1.2 mmol/l MgSO4, 1.8 mmol/l CaCl2, 11.0 mmol/l glucose) at pH 7.4 and 37°C. Under no-flow conditions, the vessel was pressurised from 10 mmHg to 60 mmHg in increments of 10 mmHg every 3 min. The vessel was then pressurised to 65 mmHg for 30 min for equilibration and kept at 65 mmHg for the remainder of the experiment. One vessel segment was used per experiment. Lumen diameter measurements were acquired and logged using the MyoVIEW 1.2P user interface. The control lumen diameter was measured as a mean over the last minute of the 30 min equilibration period. After being constricted with U46619, a thromboxane mimetic, the diameter was measured as a mean over the last 5 min of a 15 min period. Following U46619 constriction, vessel diameter responses to pinacidil (0–10 μmol/l) were assessed and analysed as percentage of relaxation from the maximum contraction.
Metabolic assessment of human participants
All human studies were approved by the Vanderbilt Institutional Review Board, and participants gave informed consent prior to their enrolment into the study. Participants with mild hypertension were recruited and washed out from antihypertensive medications for at least 3 weeks prior to study, as described previously [25]. The participants ingested energy- and sodium-controlled diets for 6 days, calculated for weight maintenance and to approximate the average regional sodium intake (200 mmol sodium/day, 100 mmol/day potassium and 1000–1350 mg/day calcium,). Studies were conducted at 07:00 hours after an overnight fast and participants remained supine for 1 h before plasma was collected into tubes containing triphenylphosphine and was frozen at −80°C for measurement of EETs. Frequently sampled intravenous glucose tolerance tests (FSIVGTTs) were then performed [26, 27], with an initial bolus of glucose (16.7 mmol glucose/kg body weight) followed by an insulin bolus at t = 20 min (0.02 U/kg body weight regular insulin; Actrapid; Novo Nordisk). Plasma glucose was analysed using the glucose oxidase method (YSI 2300 STAT Plus Glucose Analyzer; YSI Life Sciences; Yellow Springs, IL, USA). Plasma insulin was measured by radioimmunoassay (Millipore, St Charles, MO, USA) [26, 27]. Free plasma EETs were quantified via HPLC–tandem MS as previously described [28]. The acute insulin response to glucose (AIRg), insulin sensitivity index (Si) and disposition index were calculated from FSIVGTT data using the MINMOD Millennium software (https://www.cedars-sinai.edu/Research/Research-Labs/Bergman-Lab/Reagents-and-Resources.aspx, accessed 3/8/2017) [29, 30].
Statistical analysis and calculations
Image analysis and assays were performed by investigators blinded to the treatment assignment or genotype. Data are presented as means ± SEM in text and figures. Between-group comparisons were made using a two-sample t test for normally distributed data or Wilcoxon rank sum test for non-normally distributed data. Linear regression was performed to test the association between insulin sensitivity and plasma measurements in humans, and multivariate regression analysis was performed to adjust for potential confounding variables. Statistical analyses were performed with R (version 3.3) [31] and IBM SPSS for Windows (version 21; IBM SPSS, Chicago, IL, USA), with a two-tailed p value < 0.05 considered significant.
Results
Streptozotocin-induced hyperglycaemia is augmented in Cyp2c44−/− mice
Glucose tolerance tests performed on WT and Cyp2c44−/− mice revealed that glucose tolerance was significantly impaired in Cyp2c44−/− mice (Fig. 1a,b; p = 0.004 for glucose AUC). In a model of type 1 diabetes, streptozotocin treatment induced hyperglycaemia to a significantly greater extent in Cyp2c44−/− mice than in WT mice (ESM Fig. 1; 30.3 ± 0.65 vs 26.8±0.58 mmol/l average after streptozotocin treatment; p = 0.023).
Fig. 1.
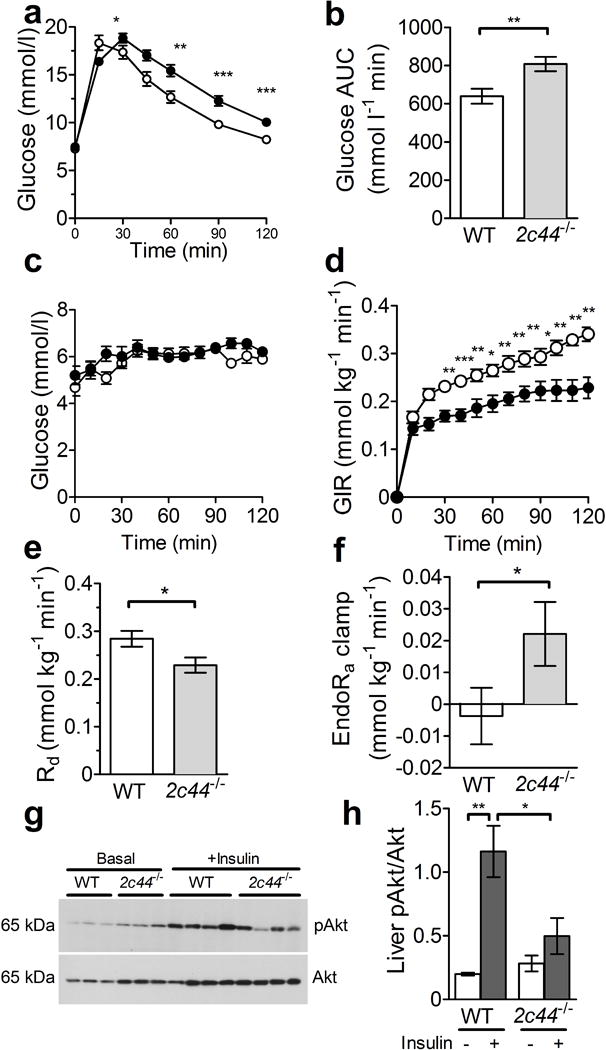
Cyp2c44 disruption impairs glucose tolerance and insulin sensitivity. (a, b) Glucose tolerance was impaired in Cyp2c44−/− mice (black circles, n=15) vs WT controls (white circles, n=15) after glucose administration (a) and as quantified by glucose AUC (b). (c–f) WT (white circles) and Cyp2c44−/− mice (black circles) on a regular chow diet were studied during hyperinsulinaemic–euglycaemic clamps. Glucose was similarly maintained in both groups during the hyperinsulinaemic studies (c). The glucose infusion rate (GIR, d) and rate of glucose disappearance (Rd, e) were significantly reduced in Cyp2c44−/− mice compared with WT mice. The EndoRa was incompletely suppressed in Cyp2c44−/− mice at the end of the clamp (f). (g, h) Liver tissues were collected 10–15 min after i.p. injection of insulin (10 mU) or saline, and western blots for pAkt and Akt (g) showed significantly impaired phosphorylation of Akt after insulin treatment in Cyp2c44−/− mice (h). *p<0.05, **p<0.01 and ***p<0.001, Cyp2c44−/− vs WT
CYP2C44-derived EETs contribute to peripheral and hepatic insulin sensitivity
These differences in glucose suggested that endogenous CYP2C44-derived EETs alter either insulin sensitivity or insulin secretion. To investigate the potential mechanisms, we performed hyperinsulinaemic–euglycaemic clamps during regular chow diet feeding to assess insulin sensitivity in WT and Cyp2c44−/− mice. Blood glucose and insulin were similar in WT and Cyp2c44−/− mice after a 5 h fast (Table 1). Although the body weight was greater in Cyp2c44−/− mice, they had a lower fat mass and higher lean mass than WT mice. Myosin heavy-chain analysis demonstrated a similar distribution of type I and type IIa/x isoforms (Table 1).
Table 1.
Metabolic characteristics of WT and Cyp2c44−/− mice
| Characteristic | WT (n=13) |
Cyp2c44−/− (n=15) |
|---|---|---|
| Body weight (g) | 29.0±0.68 | 33.2±0.98*** |
| Fasting glucose (mmol/l) | 6.16±.37 | 5.80±0.29 |
| Fasting insulin (pmol/l) | 7.02±0.84 | 9.99±1.23 |
| Perigonadal fat weight (g) | 0.51±0.05 | 0.51±0.06 |
| Visceral fat weight (g) | 0.261±0.025 | 0.298±0.045 |
| Body composition (g) | ||
| Fat | 3.31±0.23 | 2.38±0.14** |
| Muscle | 19.91±0.44 | 22.30±0.56** |
| Free fluid | 0.24±0.040 | 0.42±0.080* |
| Soleus myosin heavy-chain, type I (fraction of total) | 0.60±0.03 | 0.54±0.04 |
| Soleus myosin heavy-chain, type IIa/x (fraction of total) | 0.40±0.03 | 0.46±0.04 |
| Data are means±SEM |
p<0.05,
p<0.01 and
p<0.001 for comparisons between genotype, within diet
During hyperinsulinaemic–euglycaemic clamp studies, similar insulin concentrations were achieved (1.91 ± 0.33 vs 2.02 ± 0.55 nmol/l in WT and Cyp2c44−/− mice, respectively; p = 0.91). The glucose infusion rate needed to maintain euglycaemia near 6.4 mmol/l (Fig. 1c) was significantly reduced in Cyp2c44−/− mice (0.224 ± 0.022 vs 0.328 ± 0.014 mmol kg−1 min−1 in Cyp2c44−/− and WT mice, respectively; p = 0.003), indicating impaired sensitivity to insulin (Fig. 1d). Similarly, the rate of glucose disappearance was significantly reduced in Cyp2c44−/− mice compared with WT mice (Fig. 1e; p = 0.023).
Although EndoRa was similar under basal conditions (1.01 ± 0.01 vs 1.2 ± 0.11 mmol kg−1 min−1 in WT and Cyp2c44−/− mice, respectively; p = 0.12), insulin infusion incompletely suppressed endogenous glucose production in Cyp2c44−/− mice (Fig. 1f), indicating hepatic resistance to insulin. After acute insulin injection, hepatic Akt phosphorylation was significantly impaired in Cyp2c44−/− mice (Fig. 1g,h). We conclude that endogenous CYP2C44-derived EETs contribute to hepatic and peripheral insulin sensitivity in vivo in mice.
Cyp2c44 disruption impairs muscle insulin sensitivity in vivo but not in vitro
Tissue-specific glucose uptake at the termination of the hyperinsulinaemic–euglycaemic clamps was significantly reduced within vastus lateralis, gastrocnemius and adipose tissues, as measured by 2DG uptake (Fig. 2). Potential mechanisms of this insulin resistance include impaired perfusion (reduced vascularity, diminished blood flow or excess extracellular matrix) and impaired muscle sensitivity to insulin [32]. To control for tissue perfusion due to either altered blood flow or vascular density, we studied isolated soleus and extensor digitorum longus muscles from WT and Cyp2c44−/− mice and observed similar insulin-stimulated glucose uptake (assessed as 3H-labelled 2DG uptake) between the two genotypes (ESM Fig. 2a,b). To determine whether skeletal muscle perfusion was impaired in vivo, we assessed skeletal muscle tissue perfusion using hindlimb ultrasound measurement after microbubble contrast injection and demonstrated a non-significant decrease in cross-sectional area (ESM Fig. 2c). Extracellular matrix accumulation and capillary density, assessed by anti-collagen IV and anti-CD31 immunoreactivity, were similar in WT and Cyp2c44−/− mice (ESM Fig. 2d–f) and therefore do not explain the impaired insulin sensitivity.
Fig. 2.
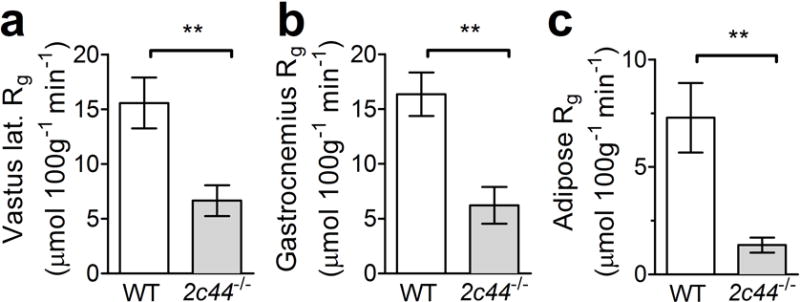
Cyp2c44 disruption impairs peripheral tissue glucose uptake during hyperinsulinaemic–euglycaemic clamps. Tissue glucose uptake (Rg) was decreased in Cyp2c44−/− mice as assessed by 2-DG uptake during hyperinsulinaemic–euglycaemic clamps in vastus lateralis (lat.) (a), gastrocnemius (b) and adipose (c) tissues. **p<0.01, Cyp2c44−/− vs WT
Glucose-stimulated insulin secretion is augmented in islets isolated from Cyp2c44−/− mice
To assess glucose-stimulated insulin secretion in vivo, we performed hyperglycaemic clamps in WT and Cyp2c44−/− mice to acutely raise glucose to ~13.9 mmol/l (250 mg/dl, Fig. 3a). The insulin level was similar between genotypes (Fig. 3b), except for a small but significant increase in Cyp2c44−/− mice at the 15 min time point (Fig. 3c, 0.43 ± 0.03 vs 0.55 ± 0.05 nmol/l; p = 0.039), and a non-significant increase at 100 min (p = 0.063).
Fig. 3.
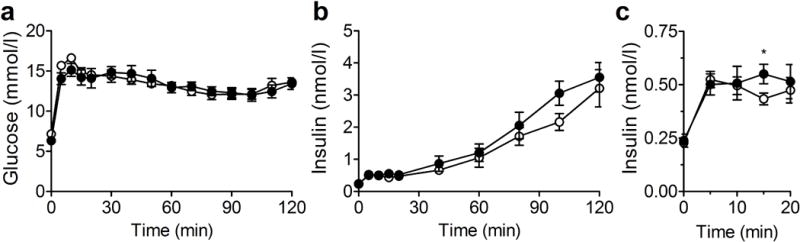
Glucose-stimulated insulin secretion during hyperglycaemic clamps is unchanged in Cyp2c44−/− mice during regular chow feeding. (a, b) During hyperglycaemic clamp, glucose was increased to 11.1–13.3 mmol/l (200–250 mg/dl) by glucose infusion (a), and plasma insulin was assessed (b). (c) Insulin during the initial 20 min of the study increased to a similar extent in Cyp2c44−/− mice. White circles, WT mice; black circles, Cyp2c44−/− mice. *p<0.05, Cyp2c44−/− vs WT
Islets isolated from Cyp2c44−/− mice demonstrated a significantly greater insulin response to glucose in vitro compared with WT islets (Fig. 4a). Analysis of Cyp2c44 mRNA from freshly isolated pancreatic islets confirmed the presence of this transcript in WT mice but not in Cyp2c44−/− mice (Fig. 4b). We also examined the expression of sEH (encoded by Ephx2) and long-chain acyl-CoA synthetase-4 (ACSL4, encoded by Acsl4), which reduce free intracellular EETs [33]. Expression of both Ephx2 mRNA (Fig. 4c) and Acsl4 mRNA (Fig. 4d) was increased in islets from Cyp2c44−/− mice. Immunofluorescence performed on pancreatic frozen sections confirmed the expression of anti-CYP2C reactive proteins, which mainly localised to pancreatic beta cells (Fig. 4e).
Fig. 4.
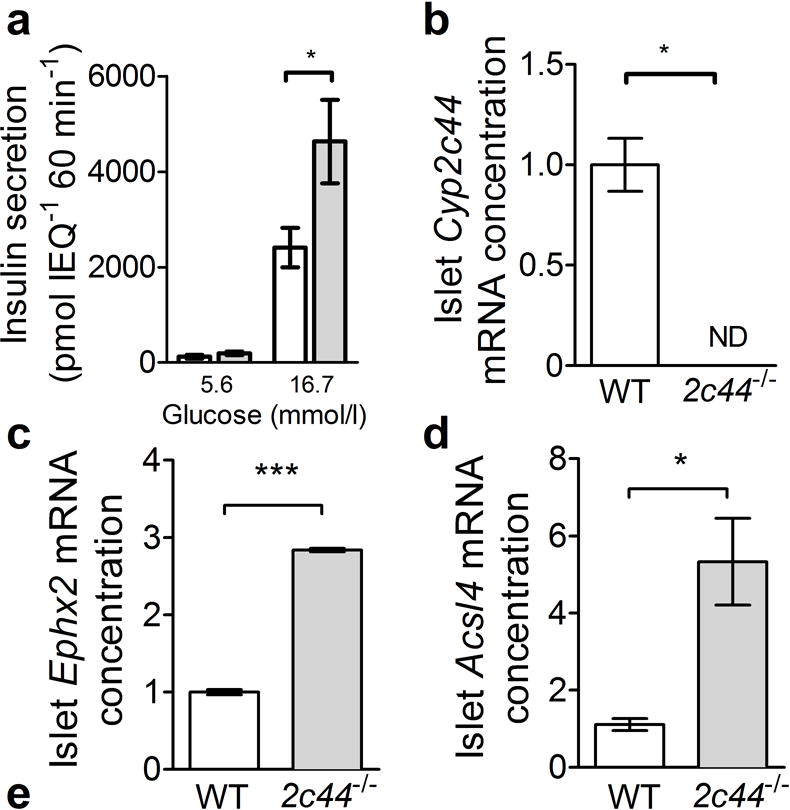
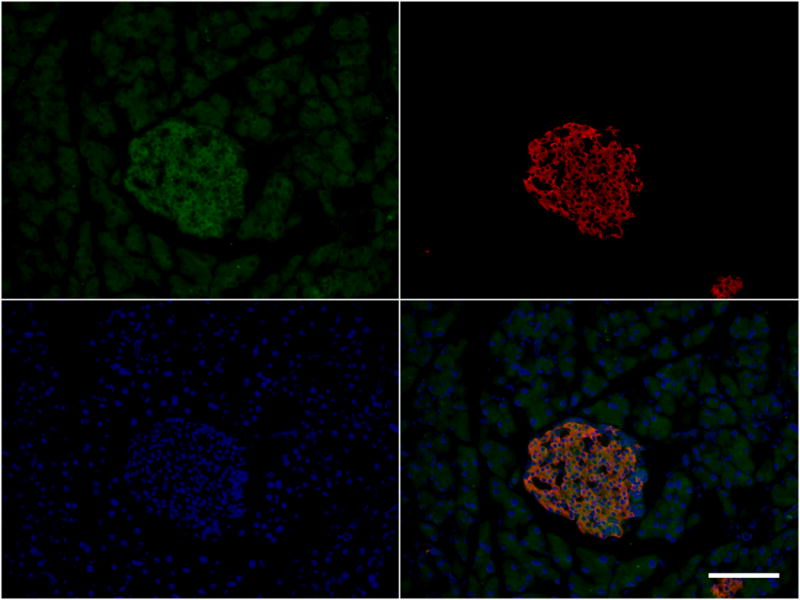
Cyp2c44 disruption increases insulin secretion in isolated islets. (a) In isolated islets cultured in normal (5.6 mmol/l) or high glucose (16.7 mmol/l) for 60 min, glucose-stimulated insulin secretion was increased in Cyp2c44−/− (grey bars) compared with WT islets (white bars). IEQ, islet equivalents. (b) Cyp2c44 mRNA expression was detected in isolated WT but not Cyp2c44−/− islets. (c, d) sEH (Ephx2, c) and Acsl4 mRNA expression (d) was increased in Cyp2c44−/− mice. (e) Immunostaining of pancreatic sections for CYP2C (green), insulin (red), and DAPI (blue) demonstrated localisation to insulin-positive cells. Scale bar = 100 μm. *p<0.05 and ***p<0.001 Cyp2c44−/− vs WT
Cyp2c44 disruption impairs KATP-dependent relaxation in mesenteric resistance arteries
Because vascular endothelial dysfunction can impair tissue perfusion and insulin sensitivity, and EETs alter KATP activity, we assessed mesenteric resistance artery dilatation in response to the KATP channel opener pinacidil. The diameter of the mesenteric resistance artery was similar between groups, averaging 128 ± 14 μm in WT mice and 133 ± 10 μm in Cyp2c44−/− mice. Concentration-dependent mesenteric resistance artery relaxation in response to pinacidil was attenuated in Cyp2c44−/− mice compared with WT mice (Fig. 5a), demonstrating that Cyp2c44−/− mice have an impaired mesenteric resistance artery dilatation to KATP activation. To examine whether KATP sensitivity was altered in other tissues, we assessed the insulin response to the pancreatic islet KATP channel blocker glibenclamide in vivo and found that Cyp2c44−/− mice had an impaired acute insulin response (Fig. 5b). To determine whether differences in KATP channel expression explained the impaired insulin sensitivity, we assessed protein expression of the KATP subunits Kir6.1 and Kir6.2 in skeletal muscle and observed no difference between the two genotypes (Fig. 5c,d). Similarly, skeletal muscle mRNA expression of Cyp2c isoforms demonstrated no change in Cyp2c29, Cyp2c38 or Cyp2c40 (ESM Fig. 3).
Fig. 5.
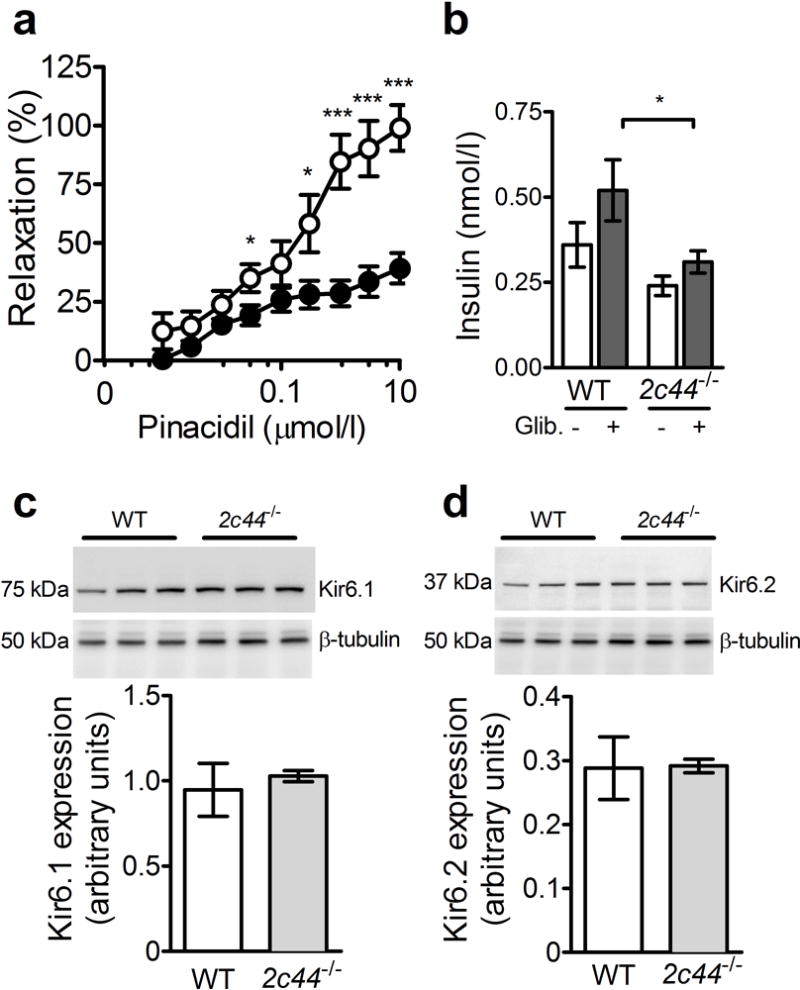
Cyp2c44 disruption impairs KATP-mediated vascular relaxation. (a) Mesenteric resistance artery endothelium-independent vasodilation in response to the ATP-sensitive potassium channel opener pinacidil was impaired in Cyp2c44−/− mice (black circles) compared with WT controls (white circles). (b) After administration of the KATP channel blocker glibenclamide (Glib.), the plasma insulin response was diminished in Cyp2c44−/− mice compared with WT mice. (c, d) Western blots for the KATP channel subunits Kir6.1 (c) and Kir6.2 (d) in skeletal muscle demonstrated similar expression. *p<0.05 and ***p<0.001 Cyp2c44−/− vs WT
Plasma EETs are associated with insulin resistance in humans
We investigated whether circulating levels of EETs correlate to insulin sensitivity in humans. Metabolic characteristics of 31 mildly hypertensive participants were assessed after 3 weeks of antihypertensive medication washout (ESM Table 2) [25]. In univariate analyses, insulin sensitivity as assessed by FSIVGTT modelling (Si) did not correlate with age, sex, race, triacylglycerols, LDL-cholesterol, systolic blood pressure or BMI, but positively correlated with HDL-cholesterol (p = 0.004). Insulin sensitivity positively correlated with plasma 8,9-EET, 11,12-EET, 14,15-EET and total EET concentrations (Fig. 6). HDL-cholesterol also associated with plasma 8,9-EET (p = 0.035), 11,12-EET (p = 0.004) and total EETs (p = 0.016), but not with 14,15-EET (p = 0.061). Plasma EETs remained associated with insulin sensitivity after multivariate analysis adjusting for HDL-cholesterol and BMI (adjusted estimates are presented in Table 2). Plasma EETs were not associated with the AIRg or with the disposition index.
Fig. 6.
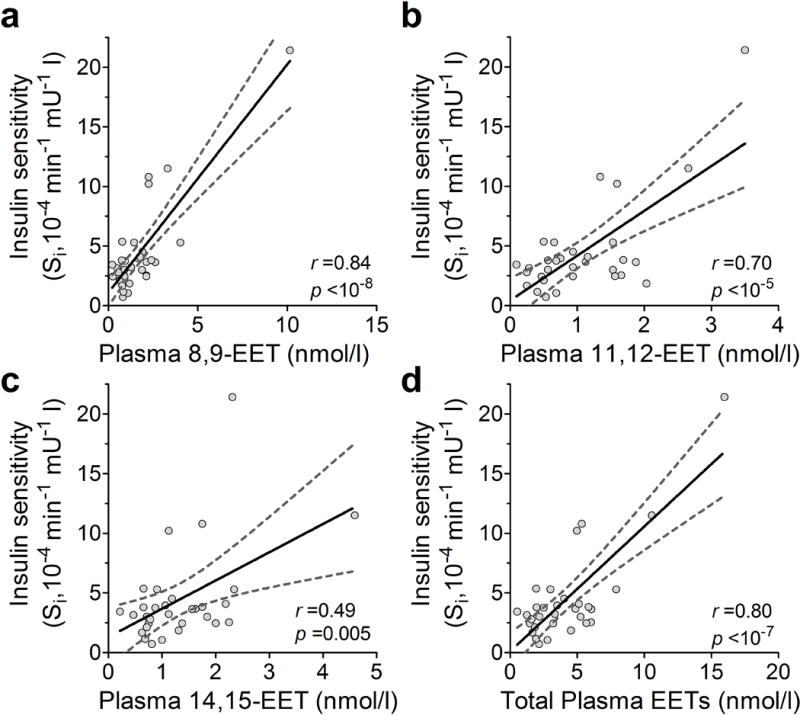
Plasma EETs correlate with insulin sensitivity in humans. Insulin sensitivity assessed during FSIVGTTs correlates with plasma EET isomers (a, 8,9-; b, 11,12-; c, 14,15-; d, total) in mildly hypertensive human participants. Pearson correlation coefficient (r) and p values are presented for each. Each data point represents measurements from an individual participant. Linear regression lines (solid) are displayed with 95% CIs (dashed lines). To convert Si values to SI units multiply by 0.167
Table 2.
Multivariate-adjusted analysis of insulin sensitivity and plasma EETs in humans
| EET | Standardised coefficient | β Coefficient (95% CI) | p value |
|---|---|---|---|
| 8,9-EET | 0.78 | 0.0053 (0.0037, 0.0069) | <10−6 |
| 11,12-EET | 0.55 | 0.0094 (0.0026, 0.015) | 0.007 |
| 14,15-EET | 0.25 | 0.0052 (−0.0033, 0.011) | 0.27 |
| Total EETs | 0.68 | 0.0016 (0.0016, 0.0041) | <10−4 |
Data are shown for multivariate analysis of insulin sensitivity index assessed during FSIVGTTs in 31 mildly hypertensive participants, adjusted for BMI and HDL-cholesterol
Discussion
Genetic disruption of the EET-generating CYP450 epoxygenases results in hypertension, and inhibition of EET hydrolysis reduces blood pressure and improves glucose metabolism [3, 11]. The present study demonstrates that genetic disruption of Cyp2c44 decreased peripheral insulin sensitivity and hepatic insulin response, increased isolated islet insulin secretion and impaired vascular KATP-dependent vasodilatation in mice. Furthermore, plasma EETs were strongly associated with insulin sensitivity in humans, supporting the conclusion that CYP2C-derived EETs increase insulin sensitivity, increase vascular reactivity and reduce blood pressure. Disruption of Cyp2c44 decreased insulin sensitivity and impaired KATP-mediated vasodilatation but did not affect blood flow-independent insulin responsiveness in isolated muscle ex vivo, suggesting that altered vascular function accounts for diminished insulin sensitivity in vivo. Although decreased capillary density and increased matrix accumulation can also contribute to insulin resistance due to reduced tissue perfusion [34, 35], we observed no difference in vascular endothelial cell density or collagen deposition when comparing Cyp2c44−/− and WT genotypes. Other studies suggest that the microvascular response to insulin is mediated in part via EETs. Increasing endogenous EETs via sEH inhibition increases insulin-mediated capillary blood volume and microvascular blood flow, whereas epoxygenase inhibition impaired this vasodilatory response [36]. Because Cyp2c44−/− mice are normotensive on a normal sodium diet [8, 10], vascular dysfunction in these mice is not due to hypertension-induced remodelling. Treatment with EET analogues or overexpression of genes encoding CYP2C/2J decrease reactive oxygen species and production of pro-inflammatory cytokines, and these effects could also contribute to insulin sensitivity in Cyp2c44−/− mice [37, 38]. Impaired vasodilatory responsiveness is also associated with insulin resistance and hypertension [16, 39], and our studies implicate CYP2C-derived EETs as potential mediators. Although endothelial dysfunction is clearly associated with insulin resistance, whether this is mediated by altered blood flow, capillary recruitment or other vascular functions such as insulin transport is an active area of research [40]. We propose that impaired vascular reactivity in Cyp2c44−/− mice contributes to impaired insulin sensitivity in vivo.
In the present study, all plasma EET isomers strongly associated with insulin sensitivity in humans. These studies were conducted under highly controlled conditions to minimise variability due to antihypertensive medications or dietary intake. We also observed a positive association between plasma EETs and HDL-cholesterol, not previously reported. EETs can increase HDL via peroxisome proliferator-activated receptor-α activation after CYP4A-dependent hydroxylation to form ω-hydroxy-EETs [41]. Consistent with these findings, we previously identified that a reduced-function CYP4A11 variant is associated with a reduction in plasma HDL in the Framingham Cohort [42]. Even after correction for HDL, plasma EETs were strongly associated with insulin sensitivity. It is possible that genetic polymorphisms which affect EET metabolism could modify diabetes risk in humans. We recently found that the Arg287Gln EPHX2 variant, which is associated with decreased ability to hydrolyse EETs, is associated with increased insulin sensitivity [43]. The present study significantly expands on these findings through improved assessment of insulin sensitivity and significantly increased number of participants. The CYP2J-50T polymorphism, which is associated with decreased EET production, has also been associated with an earlier age of onset and insulin resistance in a Chinese population with type 2 diabetes [44]. Further studies are needed to clarify these relationships and to investigate the potential effects of additional CYP polymorphisms. Pancreatic islets possess the capacity to synthesise EETs in vivo [45], but the effect of CYP epoxygenase and EETs on insulin secretion is inconsistent across studies. Although we found no effect on insulin secretion assessed during hyperglycaemic clamps in vivo, we found that Cyp2c44 disruption increased insulin secretion in isolated islets in vitro, consistent with the hypothesis that free endogenous EETs decrease insulin secretion. In a previous study using islets isolated from rats, 5,6-EET stimulated insulin secretion whereas other isomers stimulated glucagon secretion [46]. CYP2C enzymes including CYP2C44 generate little if any 5,6-EET, however, and predominantly generate 8,9-, 11,2- and 14,15-EET [3]. Other investigators have not observed significant EET synthesis or an effect of exogenous EETs on insulin secretion in islets isolated from rat [47]. The effect of EETs on insulin secretion may differ for free vs membrane EETs. ACSL4 acetylates endogenous EETs, which are reincorporated into cell-membrane glycerophospholipids, decreasing the free intracellular pool. Klett et al recently reported that ACSL4 knockdown increased free EETs, decreased membrane EETs and impaired insulin secretion in an insulinoma cell line. [33]. In our studies, expression of islet Ephx2 and Acsl4 mRNA was increased in Cyp2c44−/− mice without compensatory changes in CYP2C isoforms, suggesting a decrease in intracellular EETs. Other studies have not reported any compensatory change in CYP2C isoforms in Cyp2c44−/− mice [8]. The finding that insulin secretion was increased in mice lacking Cyp2c44 supports the conclusion that endogenous free intracellular EETs decrease insulin secretion within isolated islets.
The effect of EETs on ATP-sensitive potassium (KATP) channels may account for altered vascular function, insulin sensitivity and insulin secretion in Cyp2c44−/− mice. KATP channels are the drug target for sulfonylureas and are composed of four pore-forming inwardly rectifying potassium channels (either Kir6.1 or Kir6.2) and four sulfonylurea receptor regulatory subunits (either SUR1 or SUR2A). KATP channels are primarily composed of Kir6.1/SUR2A subunits in vascular smooth muscle and Kir6.2/SUR1 within pancreatic islets [48]. In the present study, Cyp2c44 disruption impaired vasodilatation during administration of the KATP channel opener pinacidil, suggesting that endogenous CYP2C44-derived EETs are essential for maximal KATP-dependent vasodilatory response. EETs activate KATP channels in vascular smooth muscle cells [49], and decreasing endogenous EETs via vascular soluble epoxide hydrolase overexpression impairs the vascular response to pinacidil [50]. Our study is the first to demonstrate that genetic deletion of the principal CYP2C isoform, CYP2C44, modulates vascular KATP responsiveness. Our findings demonstrate that CYP2C-derived EETs affect insulin sensitivity and vascular reactivity, and suggest that this system is a potential link between hypertension and type 2 diabetes. Further studies are needed to determine whether interventions to increase EETs have a net favourable effect on glucose metabolism in humans; promising EET agonists and sEH inhibitors are in development.
Supplementary Material
Acknowledgments
We thank T. Ansari and C. Malabanan (Vanderbilt MMPC) for their excellent technical expertise during clamp studies, and S. Wei (Vanderbilt Eicosanoid analysis core) for performing analysis of plasma EETs.
Funding
This work was supported by grants from the NIH (DK095761, DK081662, DK038226, HL060906), the Veteran Affairs (I01 BX002025-01) and the Vanderbilt Mouse Metabolic Phenotyping Center (DK59637). Clinical studies were supported by UL1 RR024975 and UL1 TR000445 from NCATS/NIH (Vanderbilt Institute for Clinical and Translational Research). Hormone assays and islet stimulation studies were performed by the Vanderbilt Diabetes Research and Training Center Hormone Assay Core Lab and Islet Procurement and Analysis Core Lab (DK20593).
Abbreviations
- 2-DG
2-Deoxy[14C]glucose
- ACSL4
Long-chain acyl-CoA synthetase-4
- AIRg
Acute insulin response to glucose
- CYP
Cytochrome P450
- DHET
Dihydroxyeicosatrienoic acid
- EET
Epoxyeicosatrienoic acid
- FSIVGTT
Frequently sampled intravenous glucose tolerance test
- EndoRa
Endogenous glucose production
- HETE
Hydroxyeicosatetraenoic acid
- sEH
Soluble epoxide hydrolase
- Si
Insulin sensitivity index
- WT
Wild-type
Footnotes
Data availability. Data will be made available upon request.
Duality of interest
The authors declare that there is no duality of interest associated with this manuscript.
Contribution statement
MHG, BWD, LL, JLG, LK, DHW, MC, CFC, AP, and JML designed the experiments. MHG, BWD, LL, LK, JLG, MC, JD, PL, JDI, AP and JML collected data. MHG, DHW, JHC, JDI, CY, JLG, AP and JML analysed and interpreted data. All authors critically reviewed the manuscript and approved the final version. JML and AP drafted the manuscript and are the guarantors of this work as a whole.
BIBLIOGRAPHY & REFERENCES CITED
- 1.Kahn SE, Hull RL, Utzschneider KM. Mechanisms linking obesity to insulin resistance and type 2 diabetes. Nature. 2006;444:840–846. doi: 10.1038/nature05482. [DOI] [PubMed] [Google Scholar]
- 2.Reaven G. Insulin resistance and coronary heart disease in nondiabetic individuals. Arterioscler Thromb Vasc Biol. 2012;32:1754–1759. doi: 10.1161/ATVBAHA.111.241885. [DOI] [PubMed] [Google Scholar]
- 3.Imig JD. Epoxides and soluble epoxide hydrolase in cardiovascular physiology. Physiol Rev. 2012;92:101–130. doi: 10.1152/physrev.00021.2011. [DOI] [PMC free article] [PubMed] [Google Scholar]
- 4.Roman RJ, Maier KG, Sun CW, Harder DR, Alonso-Galicia M. Renal and cardiovascular actions of 20-hydroxyeicosatetraenoic acid and epoxyeicosatrienoic acids. Clin Exp Pharmacol Physiol. 2000;27:855–865. doi: 10.1046/j.1440-1681.2000.03349.x. [DOI] [PubMed] [Google Scholar]
- 5.Spector AA, Fang X, Snyder GD, Weintraub NL. Epoxyeicosatrienoic acids (EETs): metabolism and biochemical function. Prog Lipid Res. 2004;43:55–90. doi: 10.1016/s0163-7827(03)00049-3. [DOI] [PubMed] [Google Scholar]
- 6.Campbell WB, Fleming I. Epoxyeicosatrienoic acids and endothelium-dependent responses. Pflugers Arch. 2010;459:881–895. doi: 10.1007/s00424-010-0804-6. [DOI] [PMC free article] [PubMed] [Google Scholar]
- 7.Capdevila J, Wang W. Role of cytochrome P450 epoxygenase in regulating renal membrane transport and hypertension. Curr Opin Nephrol Hypertens. 2013;22:163–169. doi: 10.1097/MNH.0b013e32835d911e. [DOI] [PMC free article] [PubMed] [Google Scholar]
- 8.Sun P, Antoun J, Lin DH, et al. Cyp2c44 epoxygenase is essential for preventing the renal sodium absorption during increasing dietary potassium intake. Hypertension. 2012;59:339–347. doi: 10.1161/HYPERTENSIONAHA.111.178475. [DOI] [PMC free article] [PubMed] [Google Scholar]
- 9.DeLozier TC, Tsao CC, Coulter SJ, et al. CYP2C44, a new murine CYP2C that metabolizes arachidonic acid to unique stereospecific products. J Pharmacol Exp Ther. 2004;310:845–854. doi: 10.1124/jpet.104.067819. [DOI] [PubMed] [Google Scholar]
- 10.Capdevila JH, Pidkovka N, Mei S, et al. The Cyp2c44 epoxygenase regulates epithelial sodium channel activity and the blood pressure responses to increased dietary salt. J Biol Chem. 2014;289:4377–4386. doi: 10.1074/jbc.M113.508416. [DOI] [PMC free article] [PubMed] [Google Scholar]
- 11.Sodhi K, Inoue K, Gotlinger KH, et al. Epoxyeicosatrienoic acid agonist rescues the metabolic syndrome phenotype of HO-2-null mice. J Pharmacol Exp Ther. 2009;331:906–916. doi: 10.1124/jpet.109.157545. [DOI] [PMC free article] [PubMed] [Google Scholar]
- 12.Theken KN, Deng Y, Schuck RN, et al. Enalapril reverses high-fat diet-induced alterations in cytochrome P450-mediated eicosanoid metabolism. Am J Physiol Endocrinol Metab. 2012;302:E500–509. doi: 10.1152/ajpendo.00370.2011. [DOI] [PMC free article] [PubMed] [Google Scholar]
- 13.Luo P, Chang HH, Zhou Y, et al. Inhibition or deletion of soluble epoxide hydrolase prevents hyperglycemia, promotes insulin secretion, and reduces islet apoptosis. J Pharmacol Exp Ther. 2010;334:430–438. doi: 10.1124/jpet.110.167544. [DOI] [PMC free article] [PubMed] [Google Scholar]
- 14.Luria A, Bettaieb A, Xi Y, et al. Soluble epoxide hydrolase deficiency alters pancreatic islet size and improves glucose homeostasis in a model of insulin resistance. Proc Natl Acad Sci U S A. 2011;108:9038–9043. doi: 10.1073/pnas.1103482108. [DOI] [PMC free article] [PubMed] [Google Scholar]
- 15.Iyer A, Kauter K, Alam MA, et al. Pharmacological inhibition of soluble epoxide hydrolase ameliorates diet-induced metabolic syndrome in rats. Experimental diabetes research. 2012;2012:758614. doi: 10.1155/2012/758614. [DOI] [PMC free article] [PubMed] [Google Scholar]
- 16.Mather KJ, Steinberg HO, Baron AD. Insulin resistance in the vasculature. J Clin Invest. 2013;123:1003–1004. doi: 10.1172/JCI67166. [DOI] [PMC free article] [PubMed] [Google Scholar]
- 17.Zanchi A, Maillard M, Jornayvaz FR, et al. Effects of the peroxisome proliferator-activated receptor (PPAR)-gamma agonist pioglitazone on renal and hormonal responses to salt in diabetic and hypertensive individuals. Diabetologia. 2010;53:1568–1575. doi: 10.1007/s00125-010-1756-2. [DOI] [PubMed] [Google Scholar]
- 18.Imig JD, Zhao X, Zaharis CZ, et al. An orally active epoxide hydrolase inhibitor lowers blood pressure and provides renal protection in salt-sensitive hypertension. Hypertension. 2005;46:975–981. doi: 10.1161/01.HYP.0000176237.74820.75. [DOI] [PMC free article] [PubMed] [Google Scholar]
- 19.Pozzi A, Popescu V, Yang S, et al. The anti-tumorigenic properties of peroxisomal proliferator-activated receptor alpha are arachidonic acid epoxygenase-mediated. J Biol Chem. 2010;285:12840–12850. doi: 10.1074/jbc.M109.081554. [DOI] [PMC free article] [PubMed] [Google Scholar]
- 20.Luther JM, Luo P, Kreger MT, et al. Aldosterone decreases glucose-stimulated insulin secretion in vivo in mice and in murine islets. Diabetologia. 2011;54:2152–2163. doi: 10.1007/s00125-011-2158-9. [DOI] [PMC free article] [PubMed] [Google Scholar]
- 21.Remedi MS, Agapova SE, Vyas AK, Hruz PW, Nichols CG. Acute sulfonylurea therapy at disease onset can cause permanent remission of KATP-induced diabetes. Diabetes. 2011;60:2515–2522. doi: 10.2337/db11-0538. [DOI] [PMC free article] [PubMed] [Google Scholar]
- 22.Williams CA, Shih MF, Taberner PV. Sustained improvement in glucose homeostasis in lean and obese mice following chronic administration of the beta 3 agonist SR 58611A. Br J Pharmacol. 1999;128:1586–1592. doi: 10.1038/sj.bjp.0702946. [DOI] [PMC free article] [PubMed] [Google Scholar]
- 23.Mizunoya W, Wakamatsu J, Tatsumi R, Ikeuchi Y. Protocol for high-resolution separation of rodent myosin heavy chain isoforms in a mini-gel electrophoresis system. Anal Biochem. 2008;377:111–113. doi: 10.1016/j.ab.2008.02.021. [DOI] [PubMed] [Google Scholar]
- 24.Livak KJ, Schmittgen TD. Analysis of relative gene expression data using real-time quantitative PCR and the 2(-Delta Delta C(T)) Method. Methods. 2001;25:402–408. doi: 10.1006/meth.2001.1262. [DOI] [PubMed] [Google Scholar]
- 25.Gilbert K, Nian H, Yu C, Luther JM, Brown NJ. Fenofibrate lowers blood pressure in salt-sensitive but not salt-resistant hypertension. J Hypertens. 2013;31:820–829. doi: 10.1097/HJH.0b013e32835e8227. [DOI] [PMC free article] [PubMed] [Google Scholar]
- 26.Hill KD, Eckhauser AW, Marney A, Brown NJ. Phosphodiesterase 5 inhibition improves beta-cell function in metabolic syndrome. Diabetes Care. 2009;32:857–859. doi: 10.2337/dc08-1862. [DOI] [PMC free article] [PubMed] [Google Scholar]
- 27.Ayers K, Byrne LM, DeMatteo A, Brown NJ. Differential effects of nebivolol and metoprolol on insulin sensitivity and plasminogen activator inhibitor in the metabolic syndrome. Hypertension. 2012;59:893–898. doi: 10.1161/HYPERTENSIONAHA.111.189589. [DOI] [PMC free article] [PubMed] [Google Scholar]
- 28.Karara A, Wei S, Spady D, Swift L, Capdevila JH, Falck JR. Arachidonic acid epoxygenase: structural characterization and quantification of epoxyeicosatrienoates in plasma. Biochem Biophys Res Commun. 1992;182:1320–1325. doi: 10.1016/0006-291x(92)91877-s. [DOI] [PubMed] [Google Scholar]
- 29.Bergman RN, Finegood DT, Ader M. Assessment of insulin sensitivity in vivo. Endocr Rev. 1985;6:45–86. doi: 10.1210/edrv-6-1-45. [DOI] [PubMed] [Google Scholar]
- 30.Boston RC, Stefanovski D, Moate PJ, Sumner AE, Watanabe RM, Bergman RN. MINMOD Millennium: a computer program to calculate glucose effectiveness and insulin sensitivity from the frequently sampled intravenous glucose tolerance test. Diabetes Technol Ther. 2003;5:1003–1015. doi: 10.1089/152091503322641060. [DOI] [PubMed] [Google Scholar]
- 31.R Core Team. R: A Language and Environment for Statistical Computing. R Foundation for Statistical Computing; Vienna, Austria: 2014. URL: https://www.R-project.org/ [Google Scholar]
- 32.Wasserman DH. Four grams of glucose. Am J Physiol Endocrinol Metab. 2009;296:E11–21. doi: 10.1152/ajpendo.90563.2008. [DOI] [PMC free article] [PubMed] [Google Scholar]
- 33.Klett EL, Chen S, Edin ML, et al. Diminished acyl-CoA synthetase isoform 4 activity in INS 832/13 cells reduces cellular epoxyeicosatrienoic acid levels and results in impaired glucose-stimulated insulin secretion. J Biol Chem. 2013;288:21618–21629. doi: 10.1074/jbc.M113.481077. [DOI] [PMC free article] [PubMed] [Google Scholar]
- 34.Kang L, Lantier L, Kennedy A, et al. Hyaluronan accumulates with high-fat feeding and contributes to insulin resistance. Diabetes. 2013;62:1888–1896. doi: 10.2337/db12-1502. [DOI] [PMC free article] [PubMed] [Google Scholar]
- 35.Kang L, Ayala JE, Lee-Young RS, et al. Diet-induced muscle insulin resistance is associated with extracellular matrix remodeling and interaction with integrin alpha2beta1 in mice. Diabetes. 2011;60:416–426. doi: 10.2337/db10-1116. [DOI] [PMC free article] [PubMed] [Google Scholar]
- 36.Shim CY, Kim S, Chadderdon S, et al. Epoxyeicosatrienoic acids mediate insulin-mediated augmentation in skeletal muscle perfusion and blood volume. Am J Physiol Endocrinol Metab. 2014;307:E1097–1104. doi: 10.1152/ajpendo.00216.2014. [DOI] [PMC free article] [PubMed] [Google Scholar]
- 37.Chen W, Yang S, Ping W, Fu X, Xu Q, Wang J. CYP2J2 and EETs protect against lung ischemia/reperfusion injury via anti-inflammatory effects in vivo and in vitro. Cell Physiol Biochem. 2015;35:2043–2054. doi: 10.1159/000374011. [DOI] [PubMed] [Google Scholar]
- 38.Liu W, Wang B, Ding H, Wang DW, Zeng H. A potential therapeutic effect of CYP2C8 overexpression on anti-TNF-alpha activity. Int J Mol Med. 2014;34:725–732. doi: 10.3892/ijmm.2014.1844. [DOI] [PMC free article] [PubMed] [Google Scholar]
- 39.Laakso M, Edelman SV, Brechtel G, Baron AD. Decreased effect of insulin to stimulate skeletal muscle blood flow in obese man. A novel mechanism for insulin resistance. J Clin Invest. 1990;85:1844–1852. doi: 10.1172/JCI114644. [DOI] [PMC free article] [PubMed] [Google Scholar]
- 40.Barrett EJ, Rattigan S. Muscle perfusion: its measurement and role in metabolic regulation. Diabetes. 2012;61:2661–2668. doi: 10.2337/db12-0271. [DOI] [PMC free article] [PubMed] [Google Scholar]
- 41.Cowart LA, Wei S, Hsu MH, et al. The CYP4A isoforms hydroxylate epoxyeicosatrienoic acids to form high affinity peroxisome proliferator-activated receptor ligands. J Biol Chem. 2002;277:35105–35112. doi: 10.1074/jbc.M201575200. [DOI] [PubMed] [Google Scholar]
- 42.White CC, Feng Q, Cupples LA, et al. CYP4A11 variant is associated with high-density lipoprotein cholesterol in women. Pharmacogenomics J. 2013;13:44–51. doi: 10.1038/tpj.2011.40. [DOI] [PMC free article] [PubMed] [Google Scholar]
- 43.Ramirez CE, Shuey MM, Milne GL, et al. Arg287Gln variant of EPHX2 and epoxyeicosatrienoic acids are associated with insulin sensitivity in humans. Prostaglandins Other Lipid Mediat. 2014;113–115:38–44. doi: 10.1016/j.prostaglandins.2014.08.001. [DOI] [PMC free article] [PubMed] [Google Scholar]
- 44.Wang CP, Hung WC, Yu TH, et al. Genetic variation in the G-50T polymorphism of the cytochrome P450 epoxygenase CYP2J2 gene and the risk of younger onset type 2 diabetes among Chinese population: potential interaction with body mass index and family history. Exp Clin Endocrinol Diabetes. 2010;118:346–352. doi: 10.1055/s-0029-1243604. [DOI] [PubMed] [Google Scholar]
- 45.Zeldin DC, Foley J, Boyle JE, et al. Predominant expression of an arachidonate epoxygenase in islets of Langerhans cells in human and rat pancreas. Endocrinology. 1997;138:1338–1346. doi: 10.1210/endo.138.3.4970. [DOI] [PubMed] [Google Scholar]
- 46.Falck JR, Manna S, Moltz J, Chacos N, Capdevila J. Epoxyeicosatrienoic acids stimulate glucagon and insulin release from isolated rat pancreatic islets. Biochem Biophys Res Commun. 1983;114:743–749. doi: 10.1016/0006-291x(83)90843-4. [DOI] [PubMed] [Google Scholar]
- 47.Turk J, Wolf BA, Comens PG, Colca J, Jakschik B, McDaniel ML. Arachidonic acid metabolism in isolated pancreatic islets. IV. Negative ion-mass spectrometric quantitation of monooxygenase product synthesis by liver and islets. Biochim Biophys Acta. 1985;835:1–17. doi: 10.1016/0005-2760(85)90023-2. [DOI] [PubMed] [Google Scholar]
- 48.Flagg TP, Enkvetchakul D, Koster JC, Nichols CG. Muscle KATP channels: recent insights to energy sensing and myoprotection. Physiol Rev. 2010;90:799–829. doi: 10.1152/physrev.00027.2009. [DOI] [PMC free article] [PubMed] [Google Scholar]
- 49.Lu T, Ye D, Wang X, et al. Cardiac and vascular KATP channels in rats are activated by endogenous epoxyeicosatrienoic acids through different mechanisms. J Physiol. 2006;575:627–644. doi: 10.1113/jphysiol.2006.113985. [DOI] [PMC free article] [PubMed] [Google Scholar]
- 50.Yadav VR, Hong KL, Zeldin DC, Nayeem MA. Vascular endothelial over-expression of soluble epoxide hydrolase (Tie2-sEH) enhances adenosine A1 receptor-dependent contraction in mouse mesenteric arteries: role of ATP-sensitive K+ channels. Mol Cell Biochem. 2016;422:197–206. doi: 10.1007/s11010-016-2821-z. [DOI] [PMC free article] [PubMed] [Google Scholar]
Associated Data
This section collects any data citations, data availability statements, or supplementary materials included in this article.