Abstract
Background
The purpose of this study was to determine whether cofilin-2 could serve as a protein marker for predicting radiotherapy response and as a potential therapeutic target in nasopharyngeal carcinoma (NPC).
Material/Methods
Cofilin-2 protein levels in serum and tissue samples from patients with NPC were assessed by sandwich ELISA and IHC. In vitro, cofilin-2 levels in CNE-2R cells were significantly higher than those of CNE-2 cells. Meanwhile, CNE-2R cells were silenced for cofilin-2 to obtain a stable cofilin-2-RNAi-LV3 cell line. Then, cell proliferation, radiosensitivity, invasion and migration abilities, cell cycle, and apoptosis were evaluated by Cell Counting Kit 8 assay (CCK-8), flow cytometry (FCM), clone formation assay, and in vitro.
Results
The secreted levels of the cofilin-2 protein in radioresistant NPC patients were significantly higher than those of radiosensitive cases. After cofilin-2 knockdown in nasopharyngeal carcinoma CNE-2R cells, proliferation was decreased, while apoptosis and radiosensitivity were enhanced; cell cycle distribution was altered, and the transplanted tumors in nude mice grew significantly less.
Conclusions
Overall, our findings suggest that cofilin-2 acts as a marker for predicting radiotherapy response and is a potential therapeutic target in nasopharyngeal carcinoma.
MeSH Keywords: Biological Markers, Cofilin 2, Gene Targeting, Nasopharyngeal Neoplasms, Radiation Oncology
Background
Nasopharyngeal carcinoma (NPC) is a commonly diagnosed malignant tumor worldwide, with high prevalence in Chinese and Malay populations. In China, the southeast has the highest incidence, especially in Guangdong province and Hong Kong [1,2]. Radiation therapy is currently the most effective treatment option; however, local recurrence and distant metastasis of NPC have been reported within a period of 1.5 years after treatment [3,4]. This suggests the presence of radiation-resistant cells in NPC; indeed, radiation resistance in NPC has been widely reported [5,6]. Therefore, in the cancer radiotherapy field, there is an urgent need for methods to eliminate or reverse radiation resistance in cells. Alsbeih et al. and others reported that identifying molecular markers for predicting treatment sensitivity in NPC patients, as well as defining radiation therapy sensitization pathways, could greatly improve the cure rate of NPC [7,8].
Occurrence of radiation resistance involves multiple gene mutations that affect the expression levels and functions of diverse proteins. A previous study [9] used iTRAQ-labeled proteomic techniques to assess intracellular and extracellular differential proteins between CNE-2 and CNE-2R cells, and found that the secreted protein cofilin-2 is highly produced and secreted in CNE-2R cells. Therefore, cofilin-2 may be a protein marker and a potential therapeutic target for predicting radiotherapy response in NPC.
The human cofilin-2 gene is localized on chromosome 14q12; cofilin-2 is a member of the actin depolymerization factor (ADF)/cofilin family, with a molecular weight of 18 kDa. Wang et al. showed that cofilin protein is overexpressed in several cancers and is associated with tumor prognosis [10–12]. In the present study, cofilin-2 protein levels in serum and tissue samples from NPC patients were assessed to explore the associations of radiosensitivity with clinical parameters. To further assess the function of cofilin-2 in the NPC cell line CNE2R, cofilin-2 was knocked down, and cell proliferation, radiosensitivity, cell cycle, and apoptosis were also evaluated.
Material and Methods
Serum and tissue samples
Serum samples were collected from 70 NPC patients who underwent radical radiation therapy at the Affiliated Tumor Hospital of Guangxi Medical University from January December 2013 to December 2015. Tissue specimens were collected from 70 cases of NPC between September 2012 and October 2014 in Guangxi Medical University Affiliated Tumor Hospital. All the patients were diagnosed by histopathology, with no prior radiotherapy or chemotherapy before serum and tissue collection. All patients were treated by Intensity Modulation Radiated Therapy (IMRT) with a total dose of 68.2–72.32 Gy, and a split dose of 2.18–2.26 Gy. Upon IMRT completion, the patients were divided into radiosensitivity and radioresistance groups according to therapeutic effects [13]. Radioresistant NPC patients were defined as individuals having a persistent disease (incomplete regression of primary tumor and/or neck lymph nodes) at >3 months or with local recurrent disease at the nasopharynx and/or neck lymph nodes at ≤12 months after completion of IMRT. Radiosensitive NPC patients were defined as subjects without local residual lesions (complete regression) at >3 months or local recurrent disease at >12 months after completion of IMRT. Each group included 35 patients. The detailed clinical data are shown in Tables 1 and 2.
Table 1.
Clinical and pathological parameters of the radiosensitivity and radioresistance groups (ELISA).
| Classification | Radioresistance group (n=35) | Radiosensitivity group (n=35) | *P | |
|---|---|---|---|---|
| Sex | Male | 30 | 28 | 0.752 |
| Female | 5 | 7 | ||
| Age | <50 | 24 | 25 | 1.000 |
| ≥50 | 11 | 10 | ||
| KPS | 90.00±0.01 | 89.71±1.69 | 0.321 | |
| Pathologic type | Differentiated | 7 | 6 | 1.000 |
| Undifferentiated | 28 | 29 | ||
| Clinical stage | I | 0 | 0 | 0.883 |
| II | 5 | 6 | ||
| III | 12 | 13 | ||
| Iva+IVb | 18 | 16 | ||
| T stage | T1 | 2 | 2 | 0.693 |
| T2 | 5 | 9 | ||
| T3 | 13 | 11 | ||
| T4 | 15 | 13 | ||
| N stage | N0 | 1 | 0 | 0.694 |
| N1 | 14 | 16 | ||
| N2 | 18 | 16 | ||
| N3 | 2 | 3 | ||
| Hemoglobin (g/l) | 137.6±15.5 | 139.8±17.7 | 0.577 | |
| PGTVnx | 71.99±1.14 | 71.77±1.18 | 0.437 | |
| PGTVnd | 68.88±2.15 | 68.20±2.64 | 0.243 | |
| CTV1 | 60.74±0.98 | 60.80±0.99 | 0.809 | |
| CTV2 | 54.72±0.87 | 54.77±0.90 | 0.809 |
There was no significant difference between the 2 groups.
Table 2.
Clinical and pathological parameters of the radiosensitivity and radioresistance groups (IHC).
| Classification | Radioresistance group (n=35) | Radiosensitivity group (n=35) | *P | |
|---|---|---|---|---|
| Sex | Male | 25 | 27 | 1.000 |
| Female | 10 | 8 | ||
| Age | <50 | 22 | 24 | 0.082 |
| ≥50 | 13 | 11 | ||
| KPS | 690.00±0.01 | 89.71±1.69 | 0.321 | |
| Pathologic type | Differentiated | 9 | 7 | 0.191 |
| Undifferentiated | 26 | 28 | ||
| Clinical stage | I | 0 | 0 | 0.706 |
| II | 4 | 6 | ||
| III | 12 | 13 | ||
| Iva+IVb | 19 | 16 | ||
| T stage | T1 | 2 | 2 | 0.494 |
| T2 | 4 | 9 | ||
| T3 | 11 | 9 | ||
| T4 | 18 | 15 | ||
| N stage | N0 | 0 | 0 | 0.918 |
| N1 | 17 | 18 | ||
| N2 | 14 | 14 | ||
| N3 | 4 | 3 | ||
| Hemoglobin (g/l) | 133.2±17.35 | 136.83±16.23 | 0.373 | |
| PGTVnx | 71.44±1.13 | 71.71±1.01 | 0.301 | |
| PGTVnd | 67.38±3.00 | 69.68±1.74 | 0.115 | |
| CTV1 | 60.69±0.96 | 60.63±0.94 | 0.803 | |
| CTV2 | 54.64±0.86 | 54.57±0.85 | 0.707 |
There was no significant difference between the 2 groups.
ELISA for serum cofilin-2 level assessment
Cofilin-2 levels in serum samples from patients with NPC were performed with a human cofilin-2 (CFL-2) ELISA Kit (DL-CFL2-Hu, Develop, Canada) according the manufacturer’s instructions. Absorbance was read at 450 nm on a Bio-Rad spectrophotometer (Bio-Rad, Hercules, CA, USA). Standards and samples were repeated 3 times to take the average; Curve Expert 1.30 was used to derive cofilin-2 levels in each sample based on the standard curve generated.
Immunohistochemistry (IHC) for expression of cofilin-2 quantitation
Immunohistochemistry (IHC) was used to assess cofilin-2 protein levels in human NPC tissue samples. The tissue specimens were routinely fixed with 10% formalin and were paraffin-embedded. After antigen retrieval in 0.01 mol/L sodium citrate buffer (pH 6.0), the sections were sequentially incubated with rabbit polyclonal anti-cofilin-2 antibody (1: 400) (Abcam; # ab96678) overnight at 4°C, biotin-labeled goat anti-rabbit IgG for 1 h at room temperature, and avidin-biotin peroxidase complex (ZSGB-BIO). Finally, tissue sections were incubated with the DAB color reagent (ZSGB-BIO) until brown signals appeared; counterstaining was performed with Harris’ modified hematoxylin. In negative controls, primary antibodies were omitted. Staining intensity was categorized as: no staining, 0; weak, 1; moderate, 2; strong, 3. Percentages of stained cells were categorized as: no staining, 0; <30%, 1; 30–60%, 2; >60%, 3. The overall staining score (0–6) for each tissue sample was calculated by adding the above scores. An overall staining score of >3 was considered to reflect high expression; a score of ≤3 was considered to be low expression.
Cofilin-2 knockdown in CNE-2R cells
To generate CNE-2R cell lines with cofilin-2 knockdown, small interfering RNA (siRNA) targeting 3 different portions of the cofilin-2 gene (TTCGACACTTGGAGAGAAA, TAGCTCTAAAGATGCCATT and ATGCCACATACGAAACAAA) were cloned into the pLV-GV248-lentiviral vector (GeneChem, Shanghai, China), respectively, following to the manufacturer’s instructions. Cells were selected on puromycin (5 μg/mL) for 2 weeks, and CNE-2R cell lines with stable cofilin-2 knockdown and control cells with empty vector were obtained.
Cell culture and infection
CNE-2R cells (a radioresistant human NPC cell line) was generated and maintained at the Cancer Laboratory of Guangxi Medical University. They were cultured in RPMI-1640 (Hyclone, Logan, UT, USA) supplemented with 10% fetal calf serum (Gibco, Grand Island, NY, USA) and 1% penicillin and streptomycin cocktail (Beyotime Bio, China) (100 μg/mL), in a humidified chamber containing 5% CO2 at 37°C. For lentiviral infection, CNE-2R cells were cultured in 6-well plates. Then, cofilin-2-shRNA- (cofilin-2-shRNA) and scrambled shRNA-(NC)-expressing lentiviruses were added at a multiplicity of infection (MOI) of 20 in CNE-2R cells for 96 h. Transduction efficiency was assessed by observation of GFP expression by inverted fluorescence microscopy (Olympus, Tokyo, Japan).
Real-time RT-PCR
According to the manufacturer’s instructions, total RNA was extracted from cells with TRIzol reagent (Invitrogen) and reverse-transcribed with the Prime Script RT reagent Kit (Takara Bio, Otsu, Japan). RT products were amplified using SYBR Premix Ex Taq (Takara Bio) and Light Cycler 480 software v1.5.0 (Roche Diagnostics, Switzerland) according to the manufacturer’s instructions. GAPDH was used for normalization. The primers used for cofilin-2 amplification were: forward, 5′-ACGATGCCACATACGAAACA-3′; reverse, 5′-AAGCCATTTACTTGCCACTCA-3′. Data analysis was performed by the 2−ΔΔCt method.
Western blot
Cells were lysed with RIPA buffer containing 1% protease inhibitor (PMSF). Equal amounts of protein were separated by 10% SDS-PAGE and blotted onto PVDF membranes (Thermo Scientific, Waltham, MA, USA). Blots were blocked with 5% nonfat milk in 1xTBST for 2 h at room temperature and sequentially incubated with primary antibody (overnight at 4°C) and horseradish peroxidase-conjugated secondary antibody (1 h at room temperature). Signals were visualized with an enhanced chemiluminescence detection reagent (Luminol) on an infrared fluorescence imaging system (Odyssey, USA). GAPDH was detected using rabbit monoclonal anti-GAPDH antibody (1: 1000) (CST, #2118) as a loading control. Cofilin-2 was detected simultaneously using rabbit polyclonal anti-cofilin-2 antibody (1: 1000) (Abcam; #ab96678).
Cell irradiation and CCK-8 assay
CCK-8 assay was used to assess cell viability after treatment with different doses of X-ray irradiation. Cells were seeded in 96-well plates at 3×10³ cells/well and allowed to attach overnight. Then, they were cultured for another 48 h after irradiation with 6 MVX-ray at 2, 4, 6, 8, and 10 Gy. After treatment, the cells were incubated with 10 μg/mL CCK-8 solution (Dojindo, Japan) for 1 h in a humidified chamber containing 5% CO2 at 37°C. Absorbance was read on a microplate reader (Bio-Rad, Hercules, CA, USA) at 450 nm. Each group was measured in 5 replicate wells and 3 independent experiments were conducted. Cell survival was calculated based on the following formula: survival rate (%)=OD/OD0h×100%.
Cell cycle analysis
According to the manufacturer’s instructions, cells were collected and resuspended using a Coulter cell cycle staining kit (Multi-Sciences, China). Then, they were analyzed immediately on a FC500 flow cytometry system (Beckman Coulter). All samples were assayed in triplicate.
Apoptosis assessment
Cells were irradiated with a 6 MV X-ray beam at a dose of 10 Gy and collected after 48 h of culturing. Then, the samples were stained with 5 μL Annexin V APC and 5 μL 7-AAD (BD Pharmingen, USA) according to the manufacturer’s instructions. Analysis was carried out immediately on a FC500 flow cytometry system. All samples were assayed in triplicate.
Colony formation assay
Colony formation assay was used to evaluate the radiosensitivity of cells after irradiation. Suspensions consisting of 200, 400, 800, 1000, 5000, and 10 000 cells were seeded into 6-well plates, and individually exposed to doses of 0, 2, 4, 6, 8, and 10 Gy, respectively, with a 6-MV X-ray beam from an Elekta linear accelerator (Precise 1120; Elekta Instrument AB, Stockholm, Sweden) at a dose rate of 220 cGy/min. Then, the cells were incubated for another 14 days until colony appearance. Next, the colonies were fixed with carbinol for 15 min and stained with 0.1% Giemsa (AppliChem, Germany) for 30 min. Colonies with more than 50 cells were counted. All experiments were repeated 3 times. Dose responses were analyzed using the multi-target single-hit model in GraphPad Prism 6.0 software. Survival fraction (SF)=1–(1–e−D/D0) N; D0(mean lethal dose) is the single dose of radiation that kills 63% of cells; Dq(lnN*D0) is the required threshold for cell damage and N represents the number of intracellular radiation-sensitive areas. When Dq increases, survival curve area is widened, and radiation resistance is increased. SF2 is an important indicator of cell radiosensitivity; the greater the SF2, the stronger the radioresistance.
Xenograft mouse model
BALB/c nude mice (4–5 weeks old) from SLAC Laboratory Animals (Shanghai) were randomly divided into 3 groups: CNE-2R, NC, and cofilin-2-shRNA groups. After disinfection by 75% alcohol of right hind-limb groin skin, 0.2 ml of cell suspension (1×10⁷ cells/ml) were subcutaneously injected into the right groin. Tumor formation was determined, and the long (a) and short (b) diameters of each tumor were measured with a Vernier caliper every 3 days after tumor formation. Tumor volumes were calculated as V=0.5×a×b2 and used to generate tumor growth curves. When the transplanted tumor reached about 0.8–1 cm in length, the nude mouse was fixed on a treatment bed, with the right hind limb stretched to expose the tumor to the light field. Tumor irradiation at 10 Gy was performed with a 6-MV X-ray beam from an Elekta linear accelerator (Stockholm, Sweden). The ray was applied with an SSD of 100 cm and a dose rate of 94.45 cGy/min. The irradiation field targeted the mouse hind limb bed site, with lead protection used for the remaining animal parts. The transplanted tumors were irradiated, with a continuous observation for 15 days.
Statistical analysis
All statistical analyses were performed using SPSS 16.0 (SPSS, IL, USA) or GraphPad Prism 6.0 software. Data are presented as mean ± standard deviation (SD). The Wilcoxon rank-sum test was used to assess cofilin-2 expression in serum samples. The chi-square test was used to assess differences in tissue cofilin-2 amounts. Group differences were analyzed by t test or one-way analysis of variance (ANOVA). Two-sided p<0.05 was considered statistically significant.
Results
Cofilin-2 production and secretion are increased in radioresistant patients
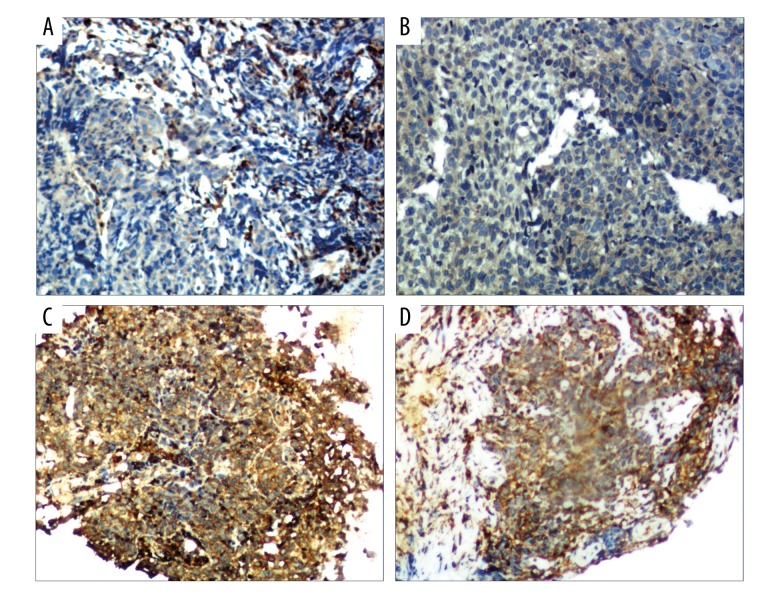
ELISA showed that cofilin-2 protein levels in serum samples from 35 radioresistant and 35 radiosensitive NPC patients were significantly different (P=0.004) (Figure 1). Serum cofilin-2 amounts in the radioresistance group were higher than those of radiosensitive patients. IHC was used to assess cofilin-2 levels in tissue samples from 35 radioresistant and 35 radiosensitive NPC patients. As shown in Table 3, a significant difference (P=0.001) was found between the 2 patient groups, with higher expression rate of cofilin-2 in radioresistant cases compared with the radiosensitivity group (Figure 2). However, cofilin-2 levels in serum or tissue samples were not associated with clinical stage (stage T or N) or other clinical parameters, including pathological types.
Figure 1.
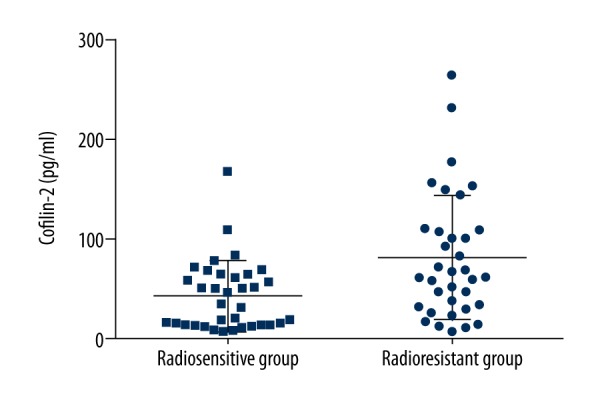
Cofilin-2 protein levels in the radioresistance and radiosensitivity groups. The differences showed a statistical significance (P=0.004).
Table 3.
High expression rate of cofilin-2 in the radiation-resistant group is higher than that of the radiation-sensitivity group (IHC).
| Cofilin-2 | Radioresistance group (n) | Radiosensitivity group (n) | χ2 | P |
|---|---|---|---|---|
| High (4–12) | 29 | 11 | 16.858 | 0.001 |
| Low (0–3) | 6 | 24 |
Figure 2.
Cofilin-2 expression in NPC tissues. Cofilin-2 levels were assessed by IHC. (A, B) Low expression; (C, D) high expression (200×, HP).
Effective shRNA-mediated knockdown of cofilin-2 in CNE-2R cells
ShRNA lentivirus was successfully constructed and transduced into CNE-2R cells. The percentage of green fluorescence protein (GFP)-positive cells was ~90% at 96h after transduction. The efficiency of cofilin-2 gene silencing of various recombinants was assessed by RT-PCR and Western blotting at the gene and protein levels, respectively. As shown in Figure 3, both mRNA and protein had a significantly higher level of cofilin-2 expression in the shRNA-transduction group than in the control group. We also evaluated cofilin-2 expression in CNE-2 and CNE-2R cells, and CNE-2R cells showed higher amounts (P=0.001), consistent with previous studies [9]. Finally, cofilin-2-shRNA-lv3 was selected for subsequent experiments involving cofilin-2 knockdown.
Figure 3.
Cofilin-2 levels are reduced by lentiviral cofilin-2-shRNA. (A) Quantitative analysis of cofilin-2 mRNA expression in different groups as assessed by RT-PCR. (B) Western blot analysis showing cofilin-2 protein expression in different groups. GAPDH was used as an internal control. Control – non-transfected group; NC – scrambled shRNA-transfected group.
Cofilin-2 knockdown sensitizes NPC cells to irradiation
To assess the regulatory role of cofilin-2 in cell proliferation, CCK 8 assay was performed to evaluate CNE-2R cells after irradiation. As shown in Figure 4, compared with the control and NC groups, the cofilin-2-shRNA-lv3 group showed significantly decreased survival rates at 2, 4, 6, 8, and 10 Gy (all P<0.001). There were no statistically significant differences between the control and NC groups, indicating that the cofilin-2-shRNA-lv3 group was more sensitive to irradiation.
Figure 4.
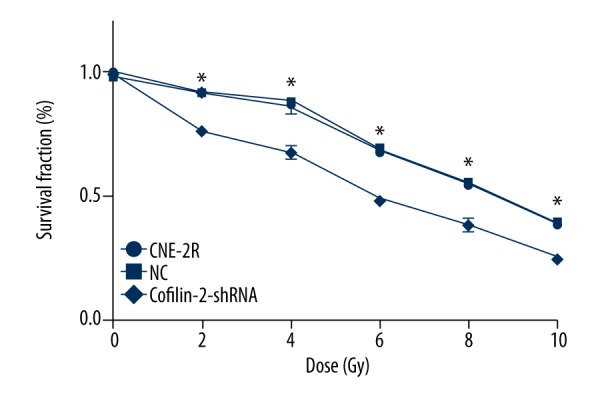
Cofilin-2 silencing by shRNA results in cell growth inhibition. CCK-8 assay was used to assess cell viability in CNE-2R cells. Survival rates of the control, NC, and cofilin-2-shRNA groups were significantly different at the radiation doses of 2, 4, 6, 8, and 10 Gy (* p<0.001).
Cofilin-2 knockdown induces G2/M cell cycle arrest
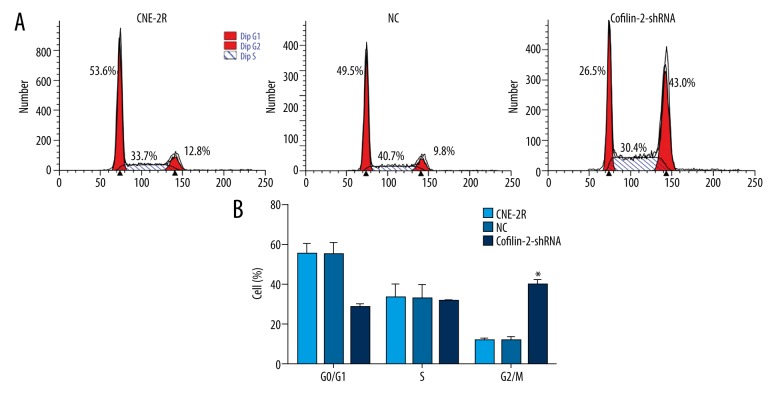
To explore the mechanism by which cofilin-2 knockdown inhibits cell proliferation in CNE-2R cells, cell cycle distribution was assessed by flow cytometry. As shown in Figure 5, compared with the control and NC groups, the cofilin-2-shRNA group showed clearly increased numbers of cells in the G2/M phase (P<0.001).
Figure 5.
ShRNA-mediated knockdown of cofilin-2 promotes G2/M cell cycle arrest in CNE-2R cells. (A) Representative flow-cytograms assessing cell cycle distribution in the control, NC, and cofilin-2-shRNA groups. (B) Quantification of A (* p<0.001).
Cofilin-2 silencing promotes apoptosis in CNE-2R cells
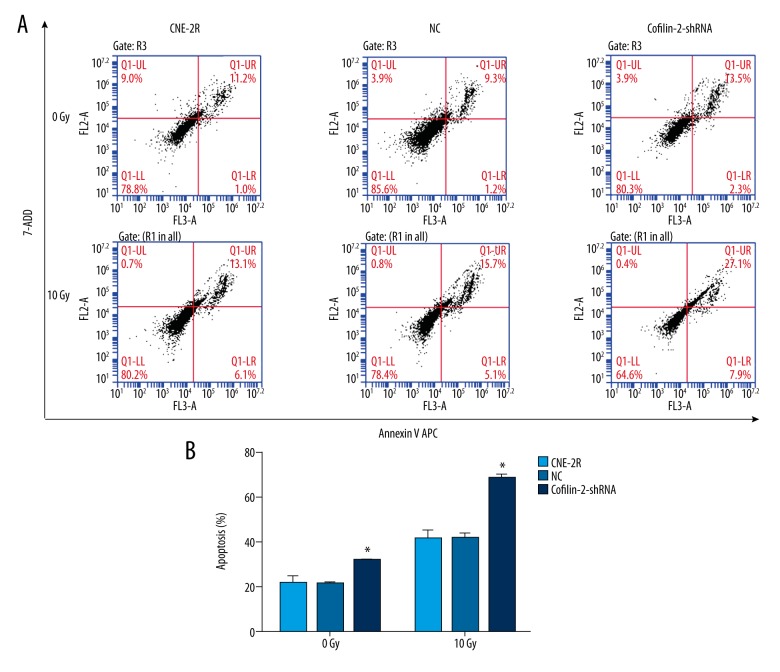
Flow cytometry (FCM) was used to evaluate the effects of cofilin-2 silencing on apoptosis in CNE-2R cells. As shown in Figure 6, the apoptosis rate of CNE-2R cells was significantly increased after cofilin-2-shRNA lentivirus transduction without irradiation; apoptosis rates of the control, NC, and cofilin-2-shRNA groups were 10.60±1.71, 10.63±0.51, and 15.90±0.17, respectively (all P=0.001). After irradiation at 10 Gy, the apoptosis rate of CNE-2R cells was also increased significantly in cofilin-2-shRNA groups; apoptosis rates of the control, NC, and cofilin-2-shRNA groups were 20.53±1.89, 20.60±1.21, and 34.00±0.89, respectively (all P=0.001). No significant differences were observed between the control and NC groups.
Figure 6.
ShRNA-mediated knockdown of cofilin-2 enhances apoptosis in CNE-2R cells. Cells were submitted to Annexin V APC staining and assessed by flow cytometry. (A) Representative flow-cytograms showing Annexin V APC staining in the control, NC, and cofilin-2-shRNA groups. (B) Quantification of A (* p=0.001).
Cofilin-2 silencing decreases colony formation in NPC cells
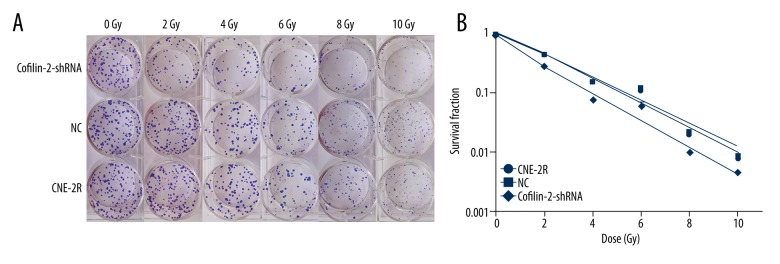
We evaluated the radiosensitivity of CNE-2R cells by performing colony formation assays (Figure 7) and using GraphPad Prism 6.0 software to fit the cell survival curves according to the multi-target model. Figure 7B shows that the survival rate of cofilin-2-shRNA cells was lower than those of the CNE2R and NC groups at 2, 4, 6, 8, and 10 Gy doses. The main radiobiological parameters are shown in Table 4. The Dq (quasi-threshold dose required for cell damage) and SF2 (surviving fraction of cells when irradiated with 2 Gy) values show that shRNA-mediated cofilin-2 silencing resulted in decreased survival and enhanced radiosensitivity compared with the CNE-2R and NC groups.
Figure 7.
Cofilin-2 knockdown increases radiosensitivity in CNE-2R cells. (A) Effect of cofilin-2 silencing on clone formation ability of CNE-2R cells at different doses of irradiation. (B) Fit curves were generated with the Graph Pad Prism 6.0 software.
Table 4.
Correlation parameters in the multi-target single-hit model.
| Cells | D0 | Dq | SF2 |
|---|---|---|---|
| CNE-2R | 1.317±0.162 | 2.086±0.257 | 0.714±0.073 |
| NC | 1.379±0.231 | 2.009±0.388 | 0.703±0.103 |
| Cofilin-2-shRNA | 1.413±0.329 | 1.001±0.325 | 0.436±0.062 |
| F | 0.140 | 10.244 | 11.250 |
| P | 0.865 | 0.012 | 0.009 |
Cofilin-2 silencing promotes radiosensitivity in a xenograft nude mouse model
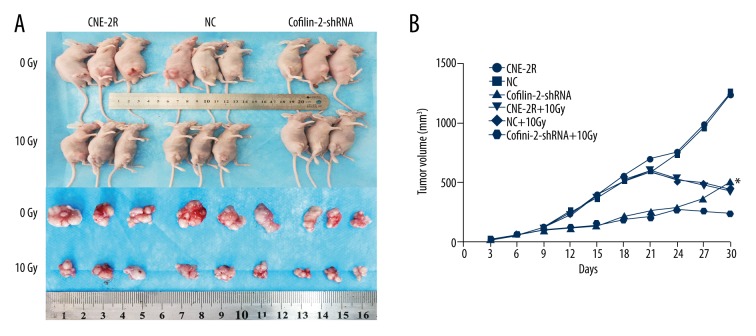
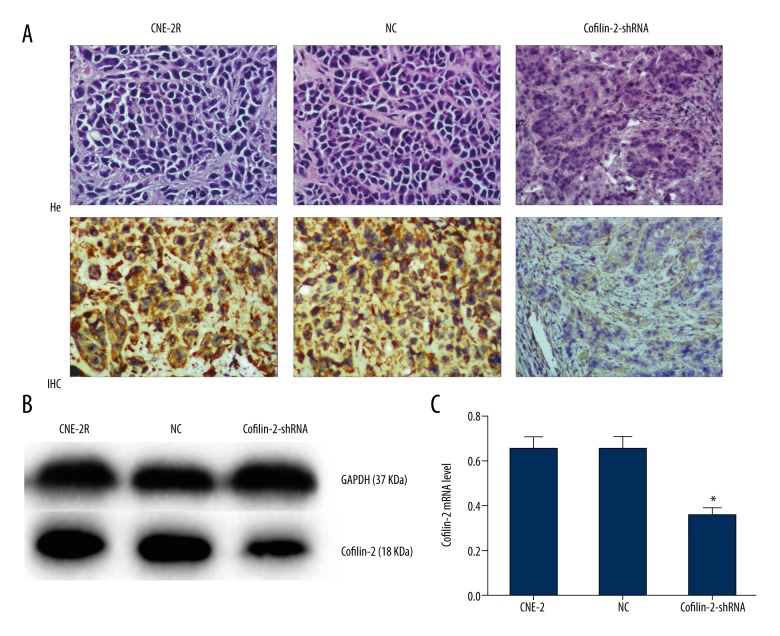
Three groups of cells were inoculated into nude mice, and tumors in each group were observed at 3 days. Nude mice were randomized into 6 groups at 15 days, for irradiation at 0 and 10 Gy. The growth of transplanted tumors was observed after irradiation for about 15 days. As shown in Figure 8B and Table 5, there were no significant differences among the 3 groups before irradiation and in the early irradiation course (0–9 days). However, tumor growth changed gradually in the later stages (9–30 days), with tumor volume in the cofilin-2-shRNA group significantly reduced compared with those of the CNE-2R and NC groups. Nude mice were sacrificed at 15 days after irradiation at 10 Gy, and tumor tissues were removed (Figure 8A). Interestingly, the volumes of transplanted tumors (241.00±53.02 mm3) in the cofilin-2-shRNA group after irradiation at 10 Gy were significantly decreased compared with that of the 0 Gy group at 30 days (464.46±89.61 mm3) (P=0.021). There was no significant difference between the CNE-2R and NC groups. We also assessed cofilin-2 protein expression in nude mice by WB and IHC and found that relative cofilin-2 protein amounts in nude mice transplanted with cofilin-2-shRNA-transfected cells were significantly lower than those of the CNE-2R and NC groups (Figure 9). These findings suggest that lentivirus-mediated cofilin-2-shRNA interference was stably inherited and expressed efficiently in vivo. Therefore, cofilin-2 gene silencing in CNE-2R cells inhibited tumor growth and enhanced radiosensitivity in nude mice.
Figure 8.
Effects of cofilin-2 silencing in the nude mouse xenograft tumor model. (A) Nude mice and transplanted tumors. (B) Growth curves of the transplanted tumors in nude mice.
Table 5.
Volume changes of transplanted tumors in nude mice.
| Days (D) | Dose (Gy) | Transplanted tumor volume (mm3) | F | P | ||
|---|---|---|---|---|---|---|
| CNE-2R | NC | Cofilin-2-shRNA | ||||
| 3 | 0 | 18.143±0.913 | 16.896±1.142 | 16.512±1.878 | 2.311 | 0.133 |
| 6 | 0 | 57.784±2.919 | 56.553±5.365 | 53.017±4.704 | 1.855 | 0.191 |
| 9 | 0 | 121.56±28.06 | 121.81±13.33 | 99.52±13.41 | 2.574 | 0.109 |
| 12 | 0 | 232.22±22.18 | 243.16±38.99 | 117.01±13.57 | 40.024 | <0.001 |
| 15 | 0 | 394.07±19.47 | 374.54±37.45 | 137.34±13.54 | 187.165 | <0.001 |
| 18 | 0 | 553.50±81.84 | 507.67±116.53 | 212.80±48.90 | 13.574 | 0.006 |
| 10 | 523.70±12.75 | 519.21±41.68 | 185.38±16.28 | 156.567 | <0.001 | |
| 21 | 0 | 698.04±76.69 | 593.19±134.41 | 256.68±71.50 | 15.162 | 0.005 |
| 10 | 604.60±10.28 | 589.44±40.56 | 208.20±13.90 | 233.508 | <0.001 | |
| 24 | 0 | 756.63±195.57 | 742.59±218.26 | 294.28±77.12 | 6.778 | 0.029 |
| 10 | 531.13±26.15 | 520.54±58.18 | 274.09±45.00 | 31.239 | 0.001 | |
| 27 | 0 | 987.91±253.62 | 960.92±318.13 | 360.32±90.55 | 6.521 | 0.031 |
| 10 | 477.73±25.95 | 491.55±48.89 | 254.58±47.25 | 30.061 | 0.001 | |
| 30 | 0 | 1242.00±384.32 | 1268.40±445.03 | 464.46±89.61 | 5.306 | 0.047 |
| 10 | 425.67±17.91 | 445.81±83.64 | 241.00±53.02 | 11.324 | 0.009 | |
Figure 9.
Expression of the cofilin-2 protein in nude mouse transplanted tumors. (A) Xenograft tumor morphology after H&E staining; IHC showing cofilin-2 protein levels in nude mice (200×, HP). (B, C) Protein expression of cofilin-2 in nude mice as detected by WB.
Discussion
In recent years, due to precise staging of tumors and advances in radiotherapy, NPC patients usually achieve good local control; however, radioresistance is a major obstacle for long-term survival in NPC patients undergoing radiotherapy. Therefore, identifying effective molecular targets to eliminate or attenuate radioresistance in NPC is of great importance.
The human cofilin gene has 2 subtypes: cofilin-1 and cofilin-2 [14]. The cofilin gene sequence is highly conserved, with the corresponding protein showing very high homology among species. Cofilin is composed of 5 α helices, 5 β sheets, and 1 C-terminal β short chain. The C-terminal β short chain is bound to the R3 and R4 chains. The 2 isoforms of the polypeptide chain are folded into a structure homologous to the conserved actin depolymerization factor (ADF) domain, which is characteristic of the actin depolymerization factor [15]. The serine 3 residue of the cofilin protein is key to regulating its dephosphorylation activation. Meanwhile, cofilin dephosphorylated at the serine 3 binds the filamentous actin in the nucleus to regulate cell mitosis and tumor cell proliferation [16]. In addition, phosphorylation of serine 3 determines the binding and depolymerization ability of cofilin and actin, as well as its translocation into the mitochondria, inducing mitochondrial damage, cytochrome C release, and tumor cell apoptosis [17–20]. Cofilin, as an important actin depolymerization factor, induces the formation of pseudopodia cells, regulates the dynamic changes of the actin cytoskeleton, affects cell morphology and polarity, and participates in cell movement regulation and tumorigenesis [21–25]. Furthermore, cofilin is an important gene in tumor cell invasion and metastasis [26,27].
Multiple studies have shown that the high protein expression of cofilin is associated with early diagnosis, tumor progression, and prognosis in multiple tumors, and could be used as an important biomarker and potential target for tumor therapy. Cofilin is highly expressed in serum and tissue samples from patients with well-differentiated thyroid carcinoma, esophageal squamous cell carcinoma, MALT lymphoma, vulvar squamous cell carcinoma, cervical cancer, and pancreatic cancer. It may play a role in tumor development and be an important early-diagnosis biomarker of tumors [28–33]. Ensley and others proposed that cofilin is significantly upregulated in several tumors and is associated with malignant progression; indeed, cofilin is considered a potential tumor biomarker and a molecular target for the treatment of bladder cancer [34,35]. In addition, high expression of cofilin in tumor cells is associated with shorter overall survival, indicating that it is a prognostic factor for tumors and can be used as a potential therapeutic target [36,37]. In the present study, we found that cofilin-2 was highly expressed in serum and tissue samples from patients with radiation-resistant NPC, while low serum and tissue levels were found in the radiosensitivity group. This indicates that cofilin-2 is a NPC radioactive resistance gene that can serve as a molecular marker for predicting radiotherapy response and is a potential therapeutic target in NPC.
Cofilin regulates multiple growth factors and cytokines participating in cell growth and proliferation [29,38]. By CCK8 and clone formation assays, we found that shRNA lentivirus-mediated cofilin-2 silencing inhibited the proliferative activity of CNE-2R cells at different radiation doses. Wang et al. showed that downregulation of cofilin 1 could inhibit cell proliferation in the human bladder cancer RT4 cell line [39], corroborating our findings. Cofilin promotes apoptosis in gastric cancer BGC-823 and SGC-7901 cells via mitochondrial translocation and induces mitochondrial damage and cytochrome c release; therefore, it may be a key target for the treatment of gastric cancer in the future [40,41]. In addition, studies have shown that cofilin inhibition or silencing increases cell apoptosis in human bladder cancer RT4 cells and resistant HCC cells [39,42]. ShRNA-mediated knockdown of cofilin-2 enhanced apoptosis in CNE-2R cells, as demonstrated by flow cytometry in this study.
Studies have shown that the G2/M phase of the cell cycle is most sensitive to radiation, followed by the G1 phase, while the S phase is least sensitive [43,44]. Du et al. demonstrated that cofilin silencing in human glioma U251 cells results in increased percentage of G2 phase cells and significantly decreased cell viability, while enhancing radiosensitivity [45]. As shown above, ShRNA-mediated knockdown of cofilin-2 resulted in increased proportion of G2/M cells, inhibited proliferation, and enhanced sensitivity to radiation in CNE-2R cells, consistent with previous reports. Furthermore, Li et al. demonstrated that cofilin mediates tumor growth inhibition in breast cancer xenograft mouse models via apoptosis, suggesting that cofilin may serve as a potential therapeutic target [40]. In this study, lentiviral-mediated cofilin-2-shRNA interfering vectors were stably inherited and efficiently expressed in nude mouse transplanted tumors, inhibiting the growth of transplanted tumors by the increased sensitivity of cells to irradiation.
Conclusions
Our study demonstrates that cofilin-2 protein was highly expressed in serum and tissue samples from patients with radioresistant NPC. Cofilin-2 is an NPC radioresistance protein, which can be used as a molecular marker for predicting radiotherapy response in NPC. In addition, cofilin-2 knockdown inhibited cell proliferation and clone formation, promoted apoptosis, and induced G2/M arrest in CNE-2R cells after radiotherapy, enhancing radiosensitivity. Moreover, inoculation of cofilin-2 knockdown cells resulted in reduced tumor growth in nude mice in vivo, indicating that cofilin-2 could serve as a potential therapeutic target for radioresistant NPC.
Footnotes
Source of support: Departmental sources
Conflicts of interest
None.
References
- 1.Chen W, Zheng R, Baade PD, et al. Cancer statistics in China, 2015. Cancer J Clin. 2016;66(2):115–32. doi: 10.3322/caac.21338. [DOI] [PubMed] [Google Scholar]
- 2.Tang LL, Chen WQ, Xue WQ, et al. Global trends in incidence and mortality of nasopharyngeal carcinoma. Cancer Lett. 2016;374(1):22–30. doi: 10.1016/j.canlet.2016.01.040. [DOI] [PubMed] [Google Scholar]
- 3.Leung SF, Teo PM, Shiu WW, et al. Clinical features and management of distant metastases of nasopharyngeal carcinoma. J Otolaryngol. 1991;20(1):27–29. [PubMed] [Google Scholar]
- 4.Lee AW, Poon YF, Foo W, et al. Retrospective analysis of 5037 patients with nasopharyngeal carcinoma treated during 1976–1985: Overall survival and patterns of failure. Int J Radiat Oncol Biol Phys. 1992;23(2):261–70. doi: 10.1016/0360-3016(92)90740-9. [DOI] [PubMed] [Google Scholar]
- 5.Li ZQ, Xia YF, Liu Q, et al. Radiotherapy-related typing in 842 patients in canton with nasopharyngeal carcinoma. Int J Radiat Oncol Biol Phys. 2006;66(4):1011–16. doi: 10.1016/j.ijrobp.2006.06.028. [DOI] [PubMed] [Google Scholar]
- 6.Han Q, Li L, Liang H, et al. Downregulation of lncRNA X inactive specific transcript (XIST) suppresses cell proliferation and enhances radiosensitivity by upregulating mir-29c in nasopharyngeal carcinoma cells. Med Sci Monit. 2017;23:4798–807. doi: 10.12659/MSM.905370. [DOI] [PMC free article] [PubMed] [Google Scholar]
- 7.Alsbeih G, Al-Harbi N, Al-Hadyan K, et al. Association between normal tissue complications after radiotherapy and polymorphic variations in TGFB1 and XRCC1 genes. Radiat Res. 2010;173(4):505–11. doi: 10.1667/RR1769.1. [DOI] [PubMed] [Google Scholar]
- 8.Chen Z, Guo Q, Lu T, et al. Pretreatment serum lactate dehydrogenase level as an independent prognostic factor of nasopharyngeal carcinoma in the intensity-modulated radiation therapy era. Med Sci Monit. 2017;23:437–45. doi: 10.12659/MSM.899531. [DOI] [PMC free article] [PubMed] [Google Scholar]
- 9.Chen ZT, Li L, Guo Y, et al. Analysis of the differential secretome of nasopharyngeal carcinoma cell lines CNE-2R and CNE-2. Oncol Rep. 2015;34(5):2477–88. doi: 10.3892/or.2015.4255. [DOI] [PubMed] [Google Scholar]
- 10.Wang Y, Kuramitsu Y, Kitagawa T, et al. Cofilin-phosphatase slingshot-1L (SSH1L) is over-expressed in pancreatic cancer (PC) and contributes to tumor cell migration. Cancer Lett. 2015;360(2):171–76. doi: 10.1016/j.canlet.2015.02.015. [DOI] [PubMed] [Google Scholar]
- 11.Muller CB, de Barros RL, Castro MA, et al. Validation of cofilin-1 as a biomarker in non-small cell lung cancer: Application of quantitative method in a retrospective cohort. J Cancer Res Clin Oncol. 2011;137(9):1309–16. doi: 10.1007/s00432-011-1001-5. [DOI] [PubMed] [Google Scholar]
- 12.Maimaiti Y, Jie T, Jing Z, et al. Aurora kinase A induces papillary thyroid cancer lymph node metastasis by promoting cofilin-1 activity. Biochem Biophys Res Commun. 2016;473(1):212–18. doi: 10.1016/j.bbrc.2016.03.081. [DOI] [PubMed] [Google Scholar]
- 13.Yuan L, Yi HM, Yi H, et al. Reduced RKIP enhances nasopharyngeal carcinoma radioresistance by increasing ERK and AKT ctivity. Oncotarget. 2016;7(10):11463–77. doi: 10.18632/oncotarget.7201. [DOI] [PMC free article] [PubMed] [Google Scholar]
- 14.Gillett GT, Fox MF, Rowe PS, et al. Mapping of human non-muscle type cofilin (CFL1) to chromosome 11q13 and muscle-type cofilin (CFL2) to chromosome 14. Ann Hum Genet. 1996;60(Pt 3):201–11. doi: 10.1111/j.1469-1809.1996.tb00423.x. [DOI] [PubMed] [Google Scholar]
- 15.Ostrowska Z, Moraczewska J. Cofilin – a protein controlling dynamics of actin filaments. Postepy Hig Med Dosw (Online) 2017;71(0):339–51. doi: 10.5604/01.3001.0010.3818. [DOI] [PubMed] [Google Scholar]
- 16.Kalendova A, Kalasova I, Yamazaki S, et al. Nuclear actin filaments recruit cofilin and actin-related protein 3, and their formation is connected with a mitotic block. Histochem Cell Biol. 2014;142(2):139–52. doi: 10.1007/s00418-014-1243-9. [DOI] [PMC free article] [PubMed] [Google Scholar]
- 17.Wang J, Yao Y, Wu J, et al. The mechanism of cytoskeleton protein beta-actin and cofilin-1 of macrophages infected by Mycobacterium avium. Am J Translat Res. 2016;8(2):1055–63. [PMC free article] [PubMed] [Google Scholar]
- 18.Bernstein BW, Bamburg JR. ADF/cofilin: A functional node in cell biology. Trends Cell Biol. 2010;20(4):187–95. doi: 10.1016/j.tcb.2010.01.001. [DOI] [PMC free article] [PubMed] [Google Scholar]
- 19.Bravo-Cordero JJ, Sharma VP, Roh-Johnson M, et al. Spatial regulation of RhoC activity defines protrusion formation in migrating cells. J Cell Sci. 2013;126(Pt 15):3356–69. doi: 10.1242/jcs.123547. [DOI] [PMC free article] [PubMed] [Google Scholar]
- 20.Li GB, Cheng Q, Liu L, et al. Mitochondrial translocation of cofilin is required for allyl isothiocyanate-mediated cell death via ROCK1/PTEN/PI3K signaling pathway. Cell Commun Signal. 2013;11:50. doi: 10.1186/1478-811X-11-50. [DOI] [PMC free article] [PubMed] [Google Scholar]
- 21.Van Troys M, Huyck L, Leyman S, et al. Ins and outs of ADF/cofilin activity and regulation. Eur J Cell Biol. 2008;87(8–9):649–67. doi: 10.1016/j.ejcb.2008.04.001. [DOI] [PubMed] [Google Scholar]
- 22.Minamide LS, Striegl AM, Boyle JA, et al. Neurodegenerative stimuli induce persistent ADF/cofilin-actin rods that disrupt distal neurite function. Nat Cell Biol. 2000;2(9):628–36. doi: 10.1038/35023579. [DOI] [PubMed] [Google Scholar]
- 23.Chugh P, Clark AG, Smith MB, et al. Actin cortex architecture regulates cell surface tension. Nat Cell Biol. 2017;19(6):689–97. doi: 10.1038/ncb3525. [DOI] [PMC free article] [PubMed] [Google Scholar]
- 24.Shishkin S, Eremina L, Pashintseva N, et al. Cofilin-1 and other ADF/Cofilin superfamily members in human malignant cells. Int J Mol Sci. 2016;18(1) doi: 10.3390/ijms18010010. pii: E10. [DOI] [PMC free article] [PubMed] [Google Scholar]
- 25.Semprucci E, Tocci P, Cianfrocca R, et al. Endothelin A receptor drives invadopodia function and cell motility through the beta-arrestin/PDZ-RhoGEF pathway in ovarian carcinoma. Oncogene. 2016;35(26):3432–42. doi: 10.1038/onc.2015.403. [DOI] [PubMed] [Google Scholar]
- 26.Wang W, Eddy R, Condeelis J. The cofilin pathway in breast cancer invasion and metastasis. Nat Rev Cancer. 2007;7(6):429–40. doi: 10.1038/nrc2148. [DOI] [PMC free article] [PubMed] [Google Scholar]
- 27.Gainullin MR, Zhukov IY, Zhou X, et al. Degradation of cofilin is regulated by Cbl, AIP4 and Syk resulting in increased migration of LMP2A positive nasopharyngeal carcinoma cells. Sci Rep. 2017;7(1):9012. doi: 10.1038/s41598-017-09540-3. [DOI] [PMC free article] [PubMed] [Google Scholar]
- 28.Zhang Y, Liao R, Li H, et al. Expression of Cofilin-1 and transgelin in esophageal squamous cell carcinoma. Med Sci Monit. 2015;21:2659–65. doi: 10.12659/MSM.895242. [DOI] [PMC free article] [PubMed] [Google Scholar]
- 29.Paricharttanakul NM, Saharat K, Chokchaichamnankit D, et al. Unveiling a novel biomarker panel for diagnosis and classification of well-differentiated thyroid carcinomas. Oncol Rep. 2016;35(4):2286–96. doi: 10.3892/or.2016.4567. [DOI] [PubMed] [Google Scholar]
- 30.Wu Q, Jiang Y, Cui S, et al. The role of cofilin-l in vulvar squamous cell carcinoma: A marker of carcinogenesis, progression and targeted therapy. Oncol Rep. 2016;35(5):2743–54. doi: 10.3892/or.2016.4625. [DOI] [PubMed] [Google Scholar]
- 31.Pappa KI, Lygirou V, Kontostathi G, et al. Proteomic analysis of normal and cancer cervical cell lines reveals deregulation of cytoskeleton-associated proteins. Cancer Genomics Proteomics. 2017;14(4):253–66. doi: 10.21873/cgp.20036. [DOI] [PMC free article] [PubMed] [Google Scholar]
- 32.Cui L, Elzakra N, Xu S, et al. Investigation of three potential autoantibodies in Sjogren’s syndrome and associated MALT lymphoma. Oncotarget. 2017;8(18):30039–49. doi: 10.18632/oncotarget.15613. [DOI] [PMC free article] [PubMed] [Google Scholar]
- 33.Satoh M, Takano S, Sogawa K, et al. Immune-complex level of cofilin-1 in sera is associated with cancer progression and poor prognosis in pancreatic cancer. Cancer Sci. 2017;108(4):795–803. doi: 10.1111/cas.13181. [DOI] [PMC free article] [PubMed] [Google Scholar]
- 34.Hensley PJ, Zetter D, Horbinski CM, et al. Association of epithelial-mesenchymal transition and nuclear cofilin with advanced urothelial cancer. Hum Pathol. 2016;57:68–77. doi: 10.1016/j.humpath.2016.06.020. [DOI] [PMC free article] [PubMed] [Google Scholar]
- 35.Zheng Y, Fang Y, Li S, et al. [Detection of plasma cofilin protein for diagnosis of lung cancer]. Nan Fang Yi Ke Da Xue Xue Bao. 2013;33(10):1551–55. [PubMed] [Google Scholar]
- 36.Maimaiti Y, Tan J, Liu Z, et al. Overexpression of cofilin correlates with poor survival in breast cancer: A tissue microarray analysis. Oncol Lett. 2017;14(2):2288–94. doi: 10.3892/ol.2017.6413. [DOI] [PMC free article] [PubMed] [Google Scholar]
- 37.Neely BA, Wilkins CE, Marlow LA, et al. Proteotranscriptomic analysis reveals stage specific changes in the molecular landscape of clear-cell renal cell carcinoma. PLoS One. 2016;11(4):e0154074. doi: 10.1371/journal.pone.0154074. [DOI] [PMC free article] [PubMed] [Google Scholar]
- 38.Reyhani V, Tsioumpekou M, van Wieringen T, et al. PDGF-BB enhances collagen gel contraction through a PI3K-PLCgamma-PKC-cofilin pathway. Sci Rep. 2017;7(1):8924. doi: 10.1038/s41598-017-08411-1. [DOI] [PMC free article] [PubMed] [Google Scholar]
- 39.Wang F, Wu D, Fu H, et al. Cofilin 1 promotes bladder cancer and is regulated by TCF7L2. Oncotarget. 2017;8(54):92043–54. doi: 10.18632/oncotarget.20664. [DOI] [PMC free article] [PubMed] [Google Scholar]
- 40.Li G, Zhou J, Budhraja A, et al. Mitochondrial translocation and interaction of cofilin and Drp1 are required for erucin-induced mitochondrial fission and apoptosis. Oncotarget. 2015;6(3):1834–49. doi: 10.18632/oncotarget.2795. [DOI] [PMC free article] [PubMed] [Google Scholar]
- 41.Li R, Wang X, Zhang XH, et al. Ursolic acid promotes apoptosis of SGC-7901 gastric cancer cells through ROCK/PTEN mediated mitochondrial translocation of cofilin-1. Asian Pac J Cancer Prev. 2014;15(22):9593–97. doi: 10.7314/apjcp.2014.15.22.9593. [DOI] [PubMed] [Google Scholar]
- 42.Liao PH, Hsu HH, Chen TS, et al. Phosphorylation of cofilin-1 by ERK confers HDAC inhibitor resistance in hepatocellular carcinoma cells via decreased ROS-mediated mitochondria injury. Oncogene. 2017;36(14):1978–90. doi: 10.1038/onc.2016.357. [DOI] [PubMed] [Google Scholar]
- 43.Ramp U, Krieg T, Caliskan E, et al. XIAP expression is an independent prognostic marker in clear-cell renal carcinomas. Hum Pathol. 2004;35(8):1022–28. doi: 10.1016/j.humpath.2004.03.011. [DOI] [PubMed] [Google Scholar]
- 44.White JS, Choi S, Bakkenist CJ. Irreversible chromosome damage accumulates rapidly in the absence of ATM kinase activity. Cell Cycle (Georgetown, Tex) 2008;7(9):1277–84. doi: 10.4161/cc.7.9.5961. [DOI] [PubMed] [Google Scholar]
- 45.Du HQ, Chen L, Wang Y, et al. Increasing radiosensitivity with the downregulation of cofilin-1 in U251 human glioma cells. Mol Med Rep. 2015;11(5):3354–60. doi: 10.3892/mmr.2014.3125. [DOI] [PMC free article] [PubMed] [Google Scholar]


