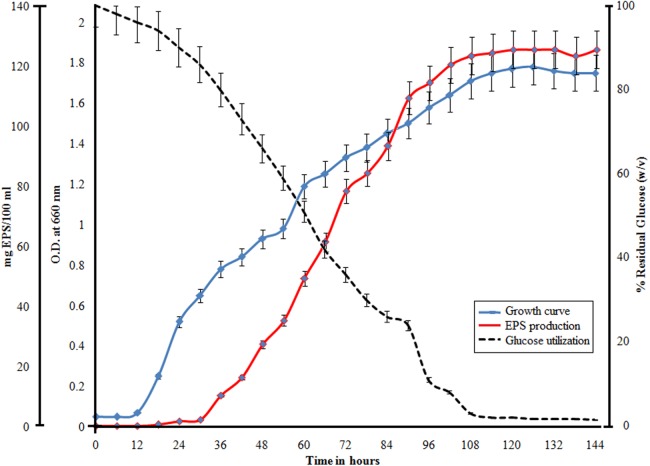
Figure 3. Demonstration of bacterial growth along with utilization of glucose and EPS production by H. nitroreducens strain WB1.
All the variables are plotted with respect to time (X-axis). The blue line indicates growth curve, the red line indicates EPS production and the dotted line indicates the utilization of glucose. 100% glucose corresponds to 10 g/L of glucose.

