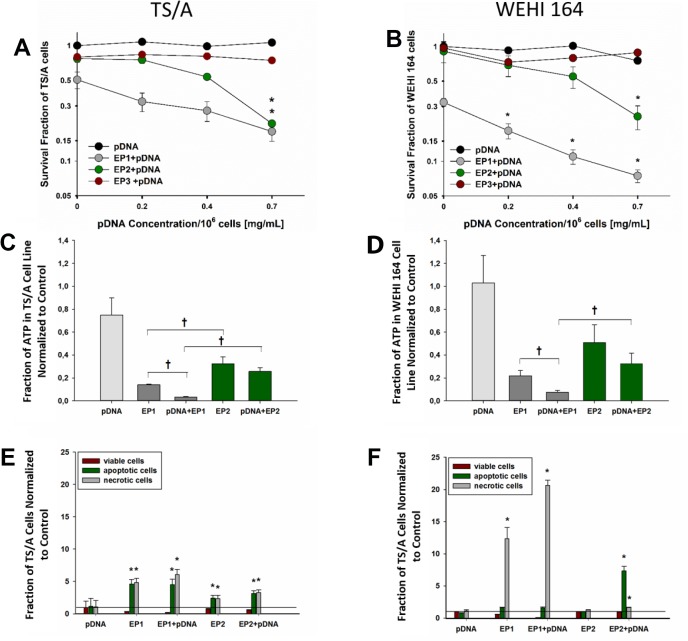
Figure 2. Cell survival, ATP level determination and cell death mechanism after electrotransfer in TS/A and WEHI 164 cell lines.
Cell survival was measured 72 hours after electrotransfer of pDNA using the pulse protocols described in methods and Figure 1 in (A) TS/A cells and (B) WEHI 164 cells. The survival fraction was normalized to an unexposed control group. The concentrations on X-axis represent final pDNA concentrations; 10 µg/106 cells, 20 µg/106 cells and 35 µg/106 cells in 50 µl of total volume, respectively. The percentage of ATP inside (C) TS/A and (D) WEHI 164 cells was determined immediately after electrotransfer. Cell death mechanisms were quantified in (E) TS/A and cells (F) WEHI 164 cells for the EP1 and EP2 electrotransfer protocols in the presence and absence of pDNA by flow cytometry for Annexin V and 7-AAD. *Statistically significant difference compared to different electrotransfer pulse protocol (EP) groups (P < 0.05). †statistically significant difference between indicated groups (P < 0.05). #statistically significant difference from pDNA group (p < 0.05).

