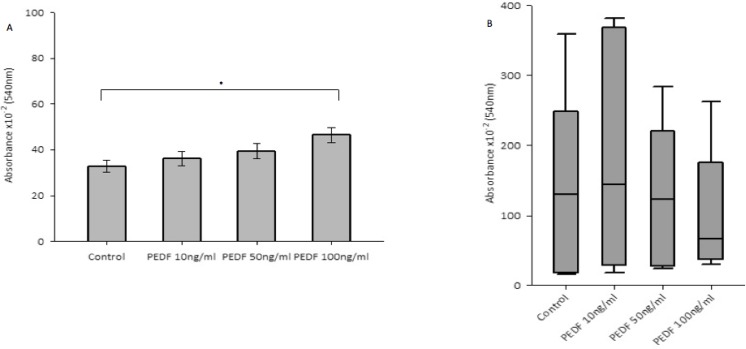
Figure 3.
(A) Impact of rhPEDF on cellular attachment in HT115 cells. Mean values of 3 independent repeats are shown. Error bars represent SEM. (B) Impact of rhPEDF on cellular attachment in HRT-18 cells. Median values and IQR of 3 independent repeats are shown. Error bars represent 95% confidence intervals. Absorbance × 10–2 (540 nm) readings used as a marker of cellular attachment, in response to varying concentrations of rhPEDF. *p < 0.05.

