

Abstract
The purpose of the current study was to develop syndrome-specific standardized growth curves for growth hormone–treated Prader-Willi syndrome (PWS) individuals aged 0 to 18 years. Anthropometric growth-related measures were obtained on 171 subjects with PWS who were treated with growth hormone for at least 40% of their lifespan. They had no history of scoliosis. PWS standardized growth curves were developed for 7 percentile ranges using the LMS method for weight, height, head circumference, weight/length, and BMI along with normative 3rd, 50th, and 97th percentiles plotted using control data from the literature and growth databases. Percentiles were plotted on growth charts for comparison purposes. Growth hormone treatment appears to normalize stature and markedly improves weight in PWS compared with standardized curves for non–growth hormone–treated PWS individuals. Growth chart implications and recommended usage are discussed.
Keywords: infants, children, genetic subtype, Prader-Willi syndrome, standardized growth curves, growth hormone treatment
Introduction
Prader-Willi syndrome (PWS) is a rare obesity-related genetic disorder that was first reported by Prader and others in 1956.1 PWS is characterized by infantile hypotonia, a poor suck with feeding problems leading to failure to thrive, hypogenitalism/hypogonadism, and growth hormone deficiency with short stature and small hands and feet.2-4 Hyperphagia often develops in early childhood, which leads to obesity, if not controlled by diet intervention and planned exercise activities. Behavioral problems including compulsions, temper tantrums, and self-injury are common along with mental deficiency and a particular facial appearance.5 Although rare, PWS affects about 400 000 people worldwide or approximately 1 in 15 000 births.6 This disorder is considered the most common known syndromic cause of life-threatening obesity.5
The cause of this syndrome is due to a deletion of the chromosome 15q11-q13 region,7 which is de novo and paternal in origin.8 The deletion is seen in about 70% of cases.2,9 The pair of chromosome 15s when inherited from the mother leads to maternal disomy 1510 causing PWS in about 25% of cases.11 The remaining subjects have either imprinting defects (microdeletions or epimutations)12,13 or rearrangements involving chromosome 155,6,14 ultimately with the loss of genomically imprinted paternally expressed genes in the 15q11-q13 region. More recent data may support a higher frequency of maternal disomy 15 in PWS possibly due to maternal age effect with mothers having children at older ages.15,16 Most cases of PWS are sporadic with the chance for recurrence at less than 1%. However, in those PWS children with a defect of the imprinting center on chromosome 15 that controls the paternally expressed genes and due to a microdeletion then the recurrence risk is as high as 50%.2-5,12-14
The clinical course and natural history of PWS have changed over the years due to earlier diagnosis, better recognition of health-related problems, and treatment with growth hormone. Historically, 2 clinical stages have been recognized including failure to thrive with feeding difficulties during infancy and later food seeking and hyperphagia leading to morbid obesity in early childhood, if not controlled. The clinical course is now divided into 7 nutritional phases and subphases17 with the first phase noted with or without failure to thrive and ranges from 0 to 15 months of age followed by weight gain in phase 2 with a median age of onset at 4.5 years of age. Phase 3 occurs at a median age of 8 years and characterized by hyperphagia, food seeking, and lack of satiety then followed by phase 4 when a diminished insatiable appetite occurs in some adults with advancing age.17
Clinical differences have been reported in those with the typical 15q11-q13 deletion consisting of 2 subtypes, the longer type I and the shorter type II deletion, and maternal disomy 15. Those with typical deletions are more prone to cognitive dysfunction, particularly lower verbal IQ scores than seen in those with maternal disomy 1518 and have more behavioral problems such as self-injury, compulsions, and hypopigmentation.2-4,19 Those with maternal disomy 15 are also more prone to experience autistic features and psychosis in young adulthood.2,20 Furthermore, those with the longer typical 15q11-q13 type I deletion may be more prone to the self-injury and obsessive compulsions seen in this syndrome and lower academic performance than those with the shorter type II deletion.21-23
The increased use of growth hormone in treating patients with PWS began in earnest in the year 2000 when approved by the Food and Drug Administration for those with genetic confirmation and without documentation of growth hormone deficiency. Most children with PWS are born with a normal weight and length24 but failure to thrive and feeding problems in infancy alters growth rate.2 Later onset of hyperphagia and obesity occurs most notably in early childhood, if not controlled. Hence, fat increases more rapidly than muscle mass or stature without growth hormone treatment. The vast majority of infants and children with PWS are now treated with growth hormone, which not only normalizes stature but also alters body composition by increasing muscle mass and bone density and decreases fat leading to increased physical activity, energy level, and metabolism. Changes in body composition, metabolism, and physical activity related to growth hormone treatment lower risk factors for diabetes and cardiopulmonary problems by improving lipid profiles and increasing alertness and self-esteem in older children leading to better quality-of-life measures.2,25-34
Syndrome-specific standardized growth charts are important for monitoring growth and development during health care surveillance of affected infants, and children have been reported for weight, length, head circumference, weight/length, and body mass index (BMI) for non–growth hormone–treated PWS infants (0-3 years of age)35,36 and for PWS individuals from 3 to 18 years of age.37 Standardized growth charts previously reported by Butler et al35 in non–growth hormone– treated infants with PWS in both males and females from the United States showed that the average weight fell below the normative 50th percentile from birth to about 25 months of age in PWS females and by 30 months in PWS males, indicative of early failure to thrive, which is common in this syndrome. In non– growth hormone–treated infants with PWS, the average length paralleled the normative 50th percentile until 2 months of age in both PWS females and males but the normative 50th percentile paralleled the PWS 75th percentile in PWS females by 12 months of age until 36 months. In PWS males, the normative 50th percentile paralleled the PWS 75th percentile beginning at 8 months of age then the length gradually decreased whereby the normative 50th percentile was similar to the PWS 97th percentile by 30 months of age supporting growth failure and short stature seen in this syndrome due to growth hormone deficiency.
Later, Butler et al37 reported syndrome-specific standardized growth charts for PWS in individuals between 3 and 18 years of age. The average weight in both PWS males and females in this study measured above the normative 50th percentile beginning before 4 years of age indicating increased weight gain in PWS. In PWS females, the PWS 75th percentile for weight was similar to the normative 97th percentile throughout most of this age interval until 18 years. In PWS males, the PWS 50th percentile for weight was similar to the normative 97th percentile from 3 to 18 years of age. These standardized syndrome-specific growth charts were developed from non–growth hormone–treated White males and females with PWS from the United States.
Methods
Subjects
Data on growth measures were obtained and utilized from 171 subjects (78 males, 93 females) with previous genetic confirmation of the diagnosis of PWS. Most of the subjects were recruited and enrolled from 2003 to 2013 as a component of a large multisite rare disease consortium on the investigation of PWS from 4 states (Kansas, Florida, Tennessee, and California). Each clinic site specializes in the care and treatment of PWS. All patients were cared for by clinicians, endocrinologists, geneticists, and dietitians with expertise in treating individuals with PWS. Calorie-restricted diets were followed and exercise plans established (eg, 30 minutes of walking per day) for each patient depending on his or her age and weight.38 Criteria for inclusion in the current study not only required genetic confirmation of the diagnosis of PWS but also no history of scoliosis and an inclusion criteria selected for lifespan growth hormone treatment at 40% or greater with growth hormone compliance determined by measuring plasma IGF-1 levels at regular intervals.39 For example, among the PWS patients at 5 years of age, growth hormone treatment would have been documented for at least 2 years before his or her growth data were included for development of the syndrome-specific standardized growth curves. Genetic testing for confirmation of the diagnosis consisted of fluorescence in situ hybridization using chromosome 15 probes, methylation-specific multiplex ligation probe amplification for copy number and methylation status, genotyping of chromosome 15 polymorphic DNA markers of proband and parental DNA, and/ or use of high resolution chromosomal microarrays.3 The growth data were collected at each clinical site using an investigator-approved manual of operation following standard measurement protocols.
Among the total number of 171 subjects with PWS, 57.3% (n = 98) had a 15q11-q13 deletion, 40.4% (n = 69) had maternal disomy 15, and 2.3% (n = 4) had an imprinting defect. The majority of subjects (56.7%, n = 97) had repeated measurements for weight, height, and/or head circumference, 28.7% (n = 49) had 2 repeated measurements, and 28.1% (n = 48) had 3 or more repeated measurements, thereby producing a total of 332 data points utilized for development of the standardized growth curves. Approximately, 16.9% of the data were available from 0 to 3 years of age, 64.3% from 3 to 10 years, and 18.6% from 10 to 18 years of age. About 49.1% of the data were available from males and 50.9% from females. The mean age of onset of growth hormone treatment was 1.29 years (SD = 1.28 years), while the mean length of time for hormone treatment was 6.46 years (SD = 3.24 years). The distributional properties of the anthropometric measures were not different among PWS male or female subjects with the 15q11-q13 deletion, maternal disomy 15 or an imprinting defect for any of the age ranges (ie, 0-3, 3-10, 10-18 years). Therefore, the growth data were combined regarding their genetic subtype status in the production of the individual growth charts for each gender. For the purpose of comparison with the PWS growth data, 3 “normative” (3rd, 50th, and 97th percentile) curves were added to each growth chart with shaded areas representing the normative data and percentile ranges. The normative growth data were obtained from the Centers for Disease Control and Prevention (www.cdc.gov/growthcharts/percentile_data_files.htm) for height, weight, and BMI and from Nellhaus40 for head circumference.
Methods and Measures
Anthropometric measures including weight, height or length, and head circumference were obtained according to standard techniques and protocols established in the clinical setting. Height was measured in standing position or length in supine position prior to standing age (eg, < 3 years of age in PWS) and to the nearest 0.1 cm with a sliding stadiometer. Head (occipital-frontal) circumference was measured to the nearest millimeter using a steel tape. Weight was recorded to the nearest 0.01 kg with a calibrated balanced beam or electronic digital scale.
Standardized growth charts are widely used to observe or track an individual's growth in reference to the population distributions and more useful for syndrome-specific disorders such as Down syndrome, Turner syndrome, and now PWS. The PWS growth charts for weight, height, head circumference, weight/ height, and BMI were developed for each gender by using the LMS method as described previously.35,37 The LMS method demonstrates the distribution of an anthropometric measure Y with regard to Box-Cox power λ (L), median μ (M), and coefficient of variation σ (S) at each value of an age range:
Optimal values of Box-Cox power are derived via penalized maximum likelihood estimation and summarized by L curve over the range of age. Similarly, the estimated medians and coefficients of variation are summarized by M and S curves, respectively. The degree of spline smoothing in the L, M, and S curves is indicated by equivalent degrees of freedom (edf). The LMS Chartmaker 2.4 was utilized to create a set of growth curves (3rd, 10th, 25th, 50th, 75th, 90th, and 97th percentiles) and the deviance test performed to determine the best-fitting models.
Results
Individuals with a genetically confirmed diagnosis of PWS were recruited and enrolled through a multisite consortium on the study of rare diseases, particularly PWS, and representing academic medical centers from the United States with expertise in the diagnosis, treatment, and medical management of this rare genetic obesity-related disorder. Syndrome-specific standardized growth charts were developed from White PWS participants from 0 to 18 years of age with growth hormone treatment during at least 40% of their lifespan and without a history of scoliosis. Individuals from other racial or ethnic backgrounds were few in number and not included. Height (or length), weight and head circumference measures were obtained for development of standardized growth curves for height, weight, head circumference, weight/height, and BMI using the LMS method as previously reported.35,37 Data for healthy control subjects were obtained from the literature40 or growth parameter databases from Centers for Disease Control and Prevention (www.cdc.gov/growthcharts/percentile_data_files.htm).
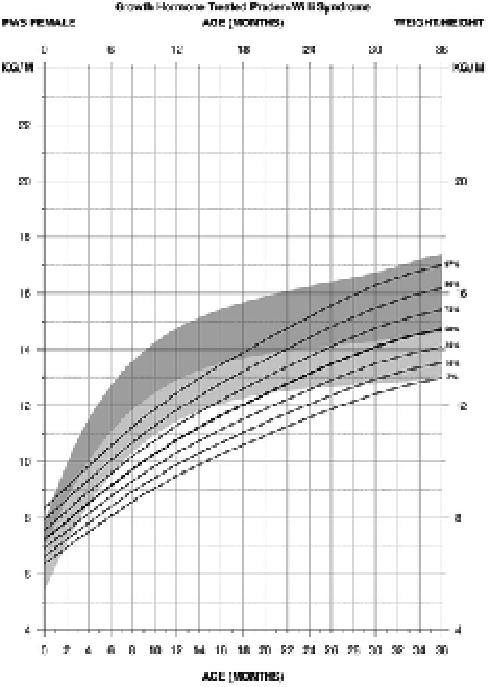
For weight in PWS females between 0 and 36 months of age treated with growth hormone (edf = 1, 4, 1), the normative 50th percentile was similar to the PWS 50th percentile at birth but by 2 months of age the normative 50th percentile was similar to the PWS 90th percentile. By 4 months of age, the normative 50th percentile plotted above the PWS 97th percentile and remained until 17 months of age then fell gradually to the PWS 50th percentile by 36 months of age. The PWS 3rd and 50th percentile ranges were similar to the normative 3rd and 50th percentile ranges by 36 months of age while the PWS 97th percentile was more similar to the normative 75th percentile by this age (see Figure 1).
Figure 1.
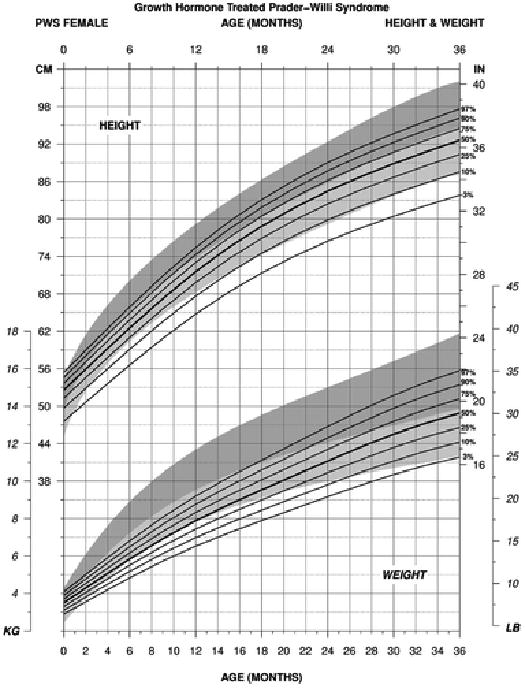
Standardized curves for height (upper) and weight (lower) from birth to 3 years of age for growth hormone– treated females with Prader-Willi syndrome (solid lines) and normative percentile ranges (shaded area) with normative 97th to 50th percentiles in dark shade and normative 50th to 3rd percentiles in light shade.
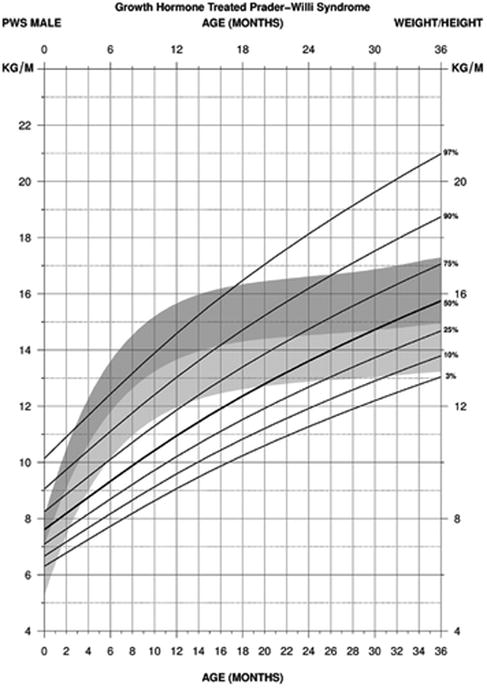
For weight in PWS males between 0 to 36 months of age treated with growth hormone (edf = 1, 4, 1), the normative 50th percentile was similar to the PWS 50th percentile at birth but by 1 month of age the normative 50th percentile was more similar to the PWS 75th percentile and PWS 90th percentile by 2 months of age. By 4 months of age, the normative 50th percentile plotted between the PWS 90th and PWS 97th percentile ranges. Gradual improvement of weight gain was noted in PWS with the normative 50th percentile being more similar to the PWS 90th percentile by 16 months of age. At 24 months of age, the normative 50th percentile was similar to the PWS 75th percentile. By 36 months of age, the PWS 3rd and 90th percentile ranges were similar to the normative 3rd and 97th percentile ranges (see Figure 2).
Figure 2.
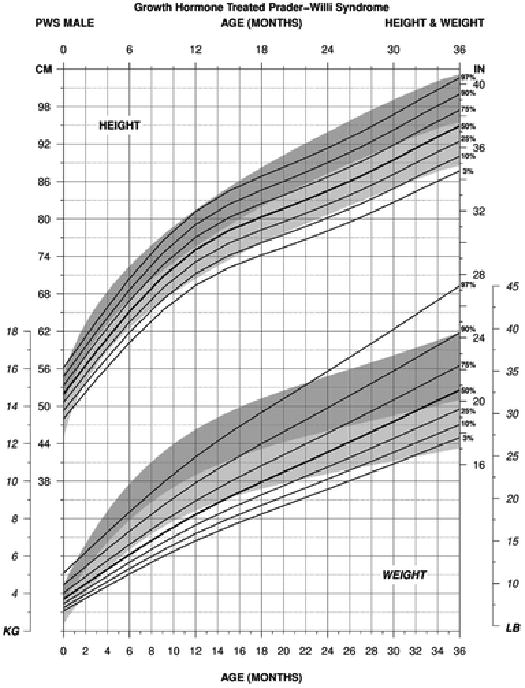
Standardized curves for height (upper) and weight (lower) from birth to 3 years of age for growth hormone– treated males with Prader-Willi syndrome (solid lines) and normative percentile ranges (shaded area) with normative 97th to 50th percentiles in dark shade and normative 50th to 3rd percentiles in light shade.
For weight in PWS females between 3 and 18 years of age treated with growth hormone (edf = 2, 6, 3), the normative 97th percentile plotted higher than the PWS 97th percentile at 3 years of age but decreased to the PWS 75th percentile by 6 years of age and similarly continued to 18 years of age. The normative 3rd percentile and PWS 3rd percentile ranges were similar from 3 to 18 years of age. The normative 50th percentile was similar to the PWS 50th percentile until about 4 years of age then the normative 50th percentile paralleled the PWS 25th percentile until about 14 years then fell to the PWS 10th percentile by 18 years (see Figure 3).
Figure 3.
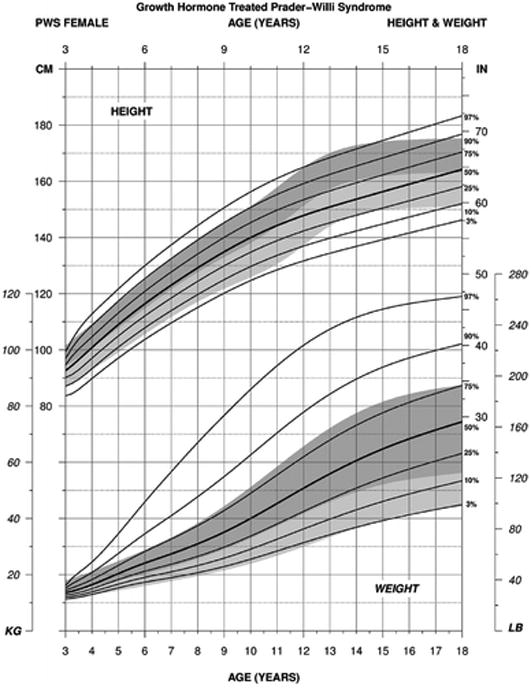
Standardized curves for height (upper) and weight (lower) from 3 to 18 years of age for growth hormone–treated females with Prader-Willi syndrome (solid lines) and normative percentile ranges (shaded area) with normative 97th to 50th percentiles in dark shade and normative 50th to 3rd percentiles in light shade.
For weight in PWS males between 3 and 18 years of age treated with growth hormone (edf = 3, 6, 3), the normative 97th percentile was similar to the PWS 75th percentile beginning at 4 years of age, and by about 12 years, the PWS 75th percentile was lower. The normative 97th percentile and the PWS 97th percentile ranges were more similar by 18 years of age. The normative 3rd percentile and PWS 3rd percentile ranges were similar from 3 to 14 years of age at which time the normative 3rd percentile was more similar to the PWS 10th percentile by 18 years of age (see Figure 4).
Figure 4.
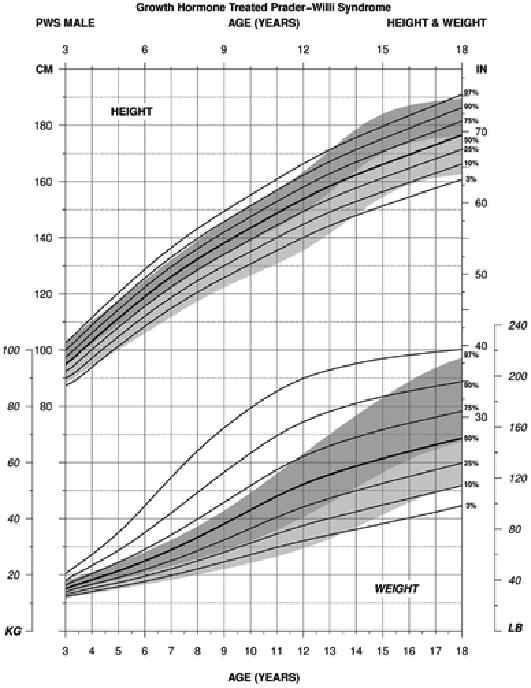
Standardized curves for height (upper) and weight (lower) from 3 to 18 years of age for growth hormone–treated males with Prader-Willi syndrome (solid lines) and normative percentile ranges (shaded area) with normative 97th to 50th percentiles in dark shade and normative 50th to 3rd percentiles in light shade.
For height in PWS females between 3 and 18 years of age treated with growth hormone (edf = 1, 5, 1), the normative 97th percentile was similar to the PWS 97th percentile by 3 years of age but by 4 years, the normative 97th percentile was more similar to the PWS 90th percentile. This pattern was present until 11 years of age, and by 12 years, the normative 97th percentile and PWS 97th percentile ranges were similar. By 18 years of age, the normative 97th percentile plotted close to the PWS 90th percentile. The normative 50th percentile was similar to the PWS 50th percentile from about 4 years of age until about 11 years of age at which time the anticipated growth spurt due to puberty was reflected in the normative data but not reflected in the graph generated for PWS subjects, which are known to lack the increased growth pattern seen in normal puberty. Yet the 50th percentile ranges for both PWS and normative data were similar by 18 years, which would be attributed to the growth hormone therapy in PWS (see Figure 3).
For height in PWS males between 3 and 18 years of age treated with growth hormone (edf = 1, 5, 1), the normative 97th percentile was similar to the PWS 90th percentile beginning at about 4 years of age and continued until about 12 years at which time the normative pubertal growth spurt occurred but not seen in PWS. By 18 years of age, the percentile growth curves were similar between PWS and normative for the 3rd, 50th, and 97th percentile ranges reflecting the positive response of growth hormone treatment in PWS (see Figure 4).
For head circumference in PWS females between birth and 18 years of age treated with growth hormone (edf = 1, 4, 1 for both 0-36 months and 3-18 years age groups), the percentile ranges were similar from birth to 36 months with a tendency for a smaller head size in PWS female infants noted at about 4 months of age to 35 months with a wider variation in size at birth and early infancy. Later, wider percentile ranges were observed from 3 to 18 years of age with a tendency for a larger head size in both PWS females during childhood to 18 years of age. The normative 97th percentile was similar to the PWS 75th percentile from about 9 to 18 years of age reflecting a wider range in head size or possibly an increased rate of head circumference growth in response to growth hormone treatment in PWS females (see Figure 5).
Figure 5.
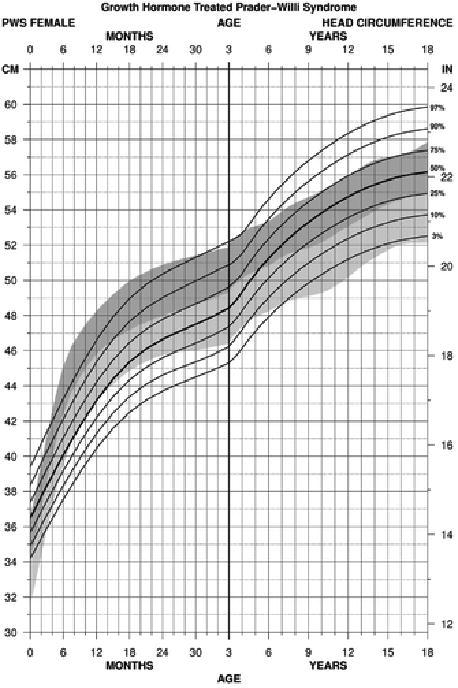
Standardized curves for head circumference from birth to 18 years of age for growth hormone–treated females with Prader-Willi syndrome (solid lines) and normative percentile ranges (shaded area) with normative 97th to 50th percentiles in dark shade and normative 50th to 3rd percentiles in light shade.
For head circumference in PWS males between birth and 18 years of age treated with growth hormone (edf = 1, 5, 1 for 0-36 months; 1, 3, 1 for 3-18 years age groups), the head size in PWS male infants appeared smaller in relationship to the normative data with the normative 3rd percentile being more similar to the PWS 25th percentile by 4 months of age and with the normative 50th percentile more similar to the PWS 75th percentile at this age. The normative 50th percentile was also more similar to the PWS 90th percentile by 13 months of age. At 36 months, the normative 97th and PWS 97th percentile ranges were similar but the normative 3rd percentile was similar to the PWS 10th percentile with a wider range of measurements noted in PWS males. The normative 3rd percentile was equal to the PWS 3rd percentile beginning at 10 years of age until 18 years while the normative 97th percentile was similar to the PWS 75th percentile beginning at about 15 years of age until 18 years (see Figure 6).
Figure 6.

Standardized curves for head circumference from birth to 18 years of age for growth hormone–treated males with Prader-Willi syndrome (solid lines) and normative percentile ranges (shaded area) with normative 97th to 50th percentiles in dark shade and normative 50th to 3rd percentiles in light shade.
For standardized weight/height curves for PWS female infants (edf = 1, 4, 1), the normative 50th percentile was similar to the PWS 25th percentile at birth. The normative 3rd percentile was similar to the PWS 50th percentile by 4 months and the PWS 75th percentile by 7 months to about 14 months of age at which time the normative 3rd percentile became more flattened in relationship to the PWS percentile ranges. By 36 months of age, the normative 3rd percentile was similar to the PWS 3rd percentile while the normative 97th percentile was similar to the PWS 97th percentile (see Figure 7).
Figure 7.
Standardized curves for weight/height from birth to 3 years of age for growth hormone–treated females with Prader-Willi syndrome (solid lines) and normative percentile ranges (shaded area) with normative 97th to 50th percentiles in dark shade and normative 50th to 3rd percentiles in light shade.
For standardized weight/height curves for PWS male infants (edf = 1, 3, 1), the normative 50th was similar to the PWS 25th percentile at birth. The normative 3rd percentile was similar to the PWS 50th percentile at about 3 months of age and then at the PWS 75th percentile by 6 months to 14 months at which time the normative 3rd percentile became more flattened in relationship to the PWS percentile ranges. By 36 months of age, the normative 3rd percentile was similar to the PWS 3rd percentile while the normative 95th percentile was similar to the PWS 75th percentile. Hence, the normative and PWS percentile ranges were similar at the end of this age interval (0-36 months) for both PWS males and females (see Figure 8).
Figure 8.
Standardized curves for weight/height from birth to 3 years of age for growth hormone–treated males with Prader-Willi syndrome (solid lines) and normative percentile ranges (shaded area) with normative 97th to 50th percentiles in dark shade and normative 50th to 3rd percentiles in light shade.
For BMI in PWS females between 3 and 18 years of age treated with growth hormone (edf = 2, 3, 3), the normative 97th percentile was similar to the PWS 75th percentile beginning at 5 years of age. The PWS 90th and 97th percentile ranges were above the normative ranges throughout this age interval. All normative percentiles ranged between the PWS 75th and 3rd percentile ranges indicating an increased obesity status in females with PWS beginning at about 4 years of age (see Figure 9).
Figure 9.
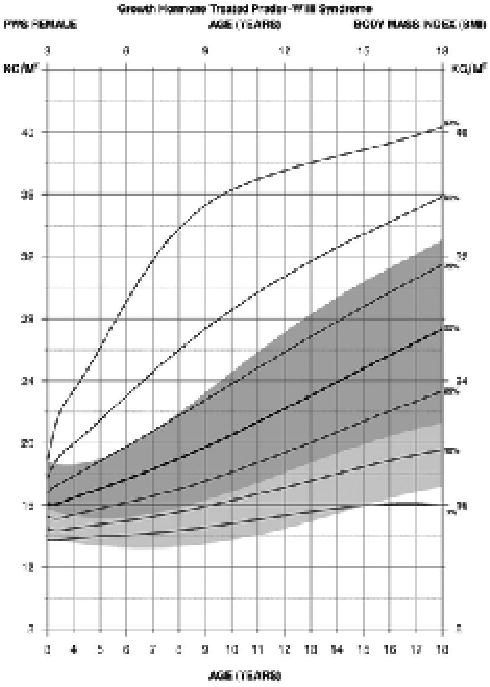
Standardized curves for body mass index from 3 to 18 years of age for growth hormone–treated females with Prader-Willi syndrome (solid lines) and normative percentile ranges (shaded area) with normative 97th to 50th percentiles in dark shade and normative 50th to 3rd percentiles in light shade.
For BMI in PWS males between 3 and 18 years of age treated with growth hormone (edf = 1, 3, 3), the normative 50th percentile ranged between the PWS 10th and 25th percentile ranges from 4 to 14 years of age then ranged between the PWS 25th and 50th percentiles by 18 years. The normative 3rd percentile generally ranged between the PWS 3rd and 10th percentile ranges from 3 to 18 years of age. The normative 97th percentile ranged between the PWS 75th percentile at 3 years of age and the PWS 90th percentile by 18 years. The PWS 90th and 97th percentile ranges were consistently above the normative 97th percentile from 3 to 18 years of age indicating the increased obesity status in males with PWS beginning at about 4 years of age (see Figure 10).
Figure 10.
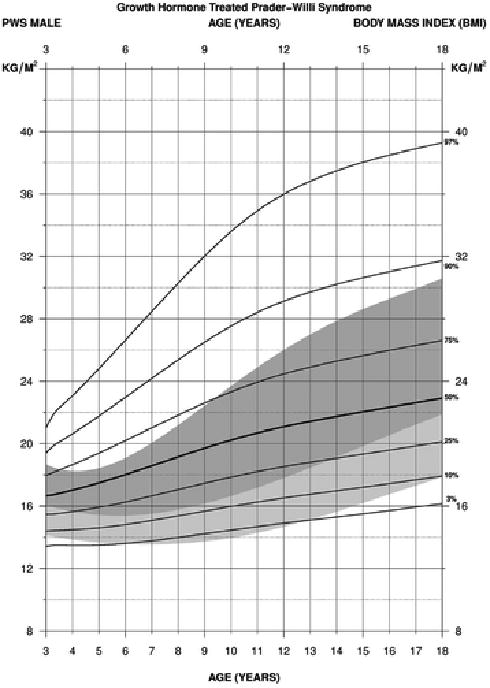
Standardized curves for body mass index from 3 to 18 years of age for growth hormone–treated males with Prader-Willi syndrome (solid lines) and normative percentile ranges (shaded area) with normative 97th to 50th percentiles in dark shade and normative 50th to 3rd percentiles in light shade.
Discussion
Syndrome-specific growth standards are becoming more common and used routinely in most clinical genetics and endocrine clinics to monitor growth and development of affected individuals with certain syndromes (eg, Down syndrome) and specifically in those syndromes with growth failure requiring growth hormone therapy such as Turner syndrome and now PWS. The treatment and medical management of individuals with PWS is complex and often requires multispecialty care to optimize treatment and monitor the abnormal growth patterns particularly height and weight before and during growth hormone therapy, which is most often prescribed during infancy. The use of standardized growth standards can help in identifying specific growth patterns and response to growth hormone treatment as well as in natural history studies.
The standardized growth charts for PWS were developed from cross-sectional data using 332 data points from 171 PWS participants from 0 to 18 years of age. Length in growth hormone–treated PWS subjects increased at a comparable rate to the normative standards beginning at about 4 months of age in both PWS male and female infants indicating the positive impact of growth hormone therapy on stature. At 3 years of age, the normative 50th and PWS 50th percentile ranges for height were equal (95.0 cm) in growth hormone–treated PWS males. These positive effects continued throughout childhood to 18 years of age at which time the PWS 50th percentile equaled the normative 50th percentile (175.0 cm). However, the PWS female height growth pattern remained below the normative range at 3 years of age, but the PWS 50th percentile equaled the normative 50th percentile (165.0 cm) at 18 years of age. The pubertal growth spurt seen in normal healthy individuals was absent in both PWS males and females, which may be best explained by hypogonadism, a common characteristic in PWS.2 The normative 50th and PWS 50th percentile ranges were similar at 18 years of age indicating normalization of stature in PWS subjects by this time further supporting the role of growth hormone therapy in this obesity-related genetic disorder.
The impact of any intervention in PWS requires careful consideration of collateral effects on weight, BMI, and head circumference status as these are critical features of importance in clinical outcomes. For weight in PWS females treated with growth hormone, the normative 50th percentile plotted at or above the PWS 97th percentile beginning at 3 months of age to 16 months when weight increased in PWS females. The PWS 50th percentile was similar to the normative 50th percentile by 36 months of age. This pattern continued until about 5 years of age when the normative 50th percentile was similar to the PWS 25th percentile by 14 to 18 years of age when the normative 50th percentile ranged between the PWS 25th and 10th percentiles. For weight in PWS males treated with growth hormone, the normative 50th percentile was similar to the PWS 25th percentile by 4 years of age and the normative 50th percentile ranged between the PWS 25th and 10th percentiles by 14 years. The normative 50th percentile was similar to the PWS 50th percentile at 18 years of age indicating nearly normalization of weight in PWS males treated with growth hormone. Hence, growth hormone treatment had a significant positive impact on both stature and weight in PWS males and females by adulthood. The standardized BMI curves (3-18 years) in growth hormone–treated PWS males and females by 18 years of age showed that the normative 50th percentile plotted between the PWS 25th and 10th percentile ranges in PWS females and between the PWS 50th and 25th percentile ranges in PWS males. PWS males and females treated with growth hormone showed variability in growth data utilized for development of BMI curves, which showed that the upper percentile ranges when plotted were at a higher level than seen in the normative BMI curves plotted from non-PWS control subjects.
Growth hormone treatment did not result in complete normalization of growth patterns for weight or BMI status in PWS males or females between 3 and 18 years of age in our study. However, when compared with previously published standards for non–growth hormone– treated PWS subjects, a downward shift in weight profile is clearly evident.37 The PWS 50th and PWS 97th percentile ranges for weight in non–growth hormone– treated PWS males at 18 years of age corresponded to 210 lb (95.3 kg) and 380 lb (172.4 kg), respectively, when reported previously37 while the standardized PWS 50th and PWS 97th percentile ranges among growth hormone–treated PWS males in our study corresponded to 150 lb (68.0 kg) and 220 lb (99.8 kg), respectively, which closely approximated the normative 50th percentile (150 lb [68.0 kg]) and the normative 97th percentile (215 lb [97.5 kg]). A similar effect was apparent in PWS females but not to the same degree. The PWS 50th and PWS 97th percentile ranges for weight when previously reported37 for non–growth hormone–treated PWS females at 18 years of age corresponded to 190 lb (86.2 kg) and 325 lb (147.4 kg), respectively. The comparable PWS 50th and 97th percentile ranges for weight with growth hormone treatment corresponded to 160 lb (72.6 kg) and 260 lb (117.9 kg), respectively, representing a major reduction and improvement in weight in PWS females. However, these values remain substantially higher than normative values of 125 lb (56.7 kg) at the normative 50th percentile and 190 lb (86.2 kg) at the normative 97th percentile. Similar trends were observed for BMI, which was driven largely by weight as growth hormone treatment effectively normalized height in both PWS males and females. The basis for the gender differences in responsivity of body mass to growth hormone therapy is unknown and will require further exploration.
Growth hormone treatment in PWS was also associated with an increased head size noted by 18 years of age, which reflected an increased rate of growth in head size beginning at 3 years of age. For example, the PWS 97th percentile for PWS males was 61.5 cm versus the normative 97th percentile at 58.5 cm and the PWS 97th percentile for PWS females was 60.0 cm versus the normative 97th percentile at 58.0 cm. These changes in head circumference and rate of growth have been suggested from observations of natural history studies in PWS at multiple sites (personal communications by Drs. M. Butler, V. Kimonis and D. Driscoll).
Our PWS participants ranged in age between 0 and 18 years of age but few subjects were included before 3 months of age reflecting our inclusion criteria of genetic confirmation and growth hormone treatment covering 40% of life span. The use of sex hormones and atypical antipsychotics was infrequent (<10% of the cases) in our studied PWS cohort. Less than 20% of the PWS subjects had a history of diabetes mellitus and fewer than 10% were being treated for hypothyroidism or adrenal gland problems, as similarly reported elsewhere in PWS subjects.2,41,42 Furthermore, the use of standardized growth charts in treating individuals with syndromes and measuring clinical outcomes can vary depending on medical care, morbidity and mortality, age at diagnosis as well as medical practice guidelines (eg, in PWS32,33,38,39) and resources available worldwide.2-4,43
Conclusions
The recognition and confirmed diagnosis of PWS in early infancy has led to the need to develop standardized growth charts to closely monitor growth before and during growth hormone therapy. The use of syndrome-specific growth charts is vital to optimize medical care and treatment not only during infancy but also later to improve quality of life and monitor clinical outcomes in PWS. Caloric intake and individualized exercise plans should be in place to maximize the impact of growth hormone therapy and assist the clinician and dietitian to avoid the onset of obesity and related medical comorbidities. Syndrome-specific standardized growth charts can be used to guide the care and treatment in regulating growth hormone dosages and growth response, monitor orthopedic problems such as scoliosis or other clinical features related to obesity to meet the growing need to improve care and outcomes in PWS.
The authors encourage the use of these syndrome-specific standardized growth charts in those with PWS treated with growth hormone from infancy to 18 years of age in the evaluation, follow-up and medical management of obesity and short stature, cardinal features seen in this rare obesity-related genetic disorder as well as for comparison of others similarly affected in relationship to normative data. In addition, previous standardized growth charts for non–growth hormone–treated PWS infants35 and those between 3 and 18 years of age have been reported37 and in use clinically for the medical care and treatment of individuals with PWS.
Acknowledgments
We thank Carla Meister for preparation of the manuscript.
Funding: The author(s) disclosed receipt of the following financial support for the research, authorship, and/or publication of this article: Prader-Willi Syndrome Association (USA) and the Angelman, Rett and Prader-Willi Syndromes Consortium (U54 HD06122), which was part of the National Institutes of Health (NIH) Rare Disease Clinical Research Network (RDCRN) supported through collaboration between the NIH Office of Rare Disease Research (ORDR) at the National Center of Advancing Translational Science (NCATS) and the National Institute of Child Health and Human Development (NICHD).
Footnotes
Author Contribution: MGB was the primary investigator responsible for the oversight of all aspects of study design, implementation, data analysis and interpretation as well as subject recruitment. He was primarily responsible for composing the manuscript. JL performed all data analyses for development of the figures and contributed to the manuscript composition. DMC was involved with data collection and entry and contributed to manuscript composition. AMM contributed to data analysis and interpretation along with figures and manuscript composition and preparation. JAG contributed to the study protocol and manuscript composition. JLM contributed to subject recruitment, study protocol and manuscript composition. ER was involved with data collection and entry and contributed to manuscript composition. ED was involved with study protocol, data collection and analysis subject recruitment and contributed to manuscript composition. VK was involved with study protocol, data collection and analysis subject recruitment and contributed to manuscript composition. DJD was involved with study protocol, data collection and analysis subject recruitment and contributed to manuscript composition.
Declaration of Conflicting Interests: The author(s) declared no potential conflicts of interest with respect to the research, authorship, and/or publication of this article.
References
- 1.Prader A, Labhart A, Willi H. Ein Syndrom von Adipositas, Kleinwuchs, Kryptorchismus und Oligophrenie nach Myatonieartigem Zustand im Neugeborenenalter. Schweiz Med Wschr. 1956;86:1260–1261. [Google Scholar]
- 2.Butler MG, Lee PDK, Whitman BY, editors. Management of Prader-Willi Syndrome. 3rd. New York, NY: Springer-Verlag; 2006. [Google Scholar]
- 3.Butler MG. Prader-Willi syndrome: obesity due to genomic imprinting. Curr Genomics. 2011;12:204–215. doi: 10.2174/138920211795677877. [DOI] [PMC free article] [PubMed] [Google Scholar]
- 4.Cassidy SB, Schwartz S, Miller JL, Driscoll DJ. Prader-Willi syndrome. Genet Med. 2012;14:10–26. doi: 10.1038/gim.0b013e31822bead0. [DOI] [PubMed] [Google Scholar]
- 5.Butler MG. Prader-Willi syndrome: current understanding of cause and diagnosis. Am J Med Genet. 1990;35:319–332. doi: 10.1002/ajmg.1320350306. [DOI] [PMC free article] [PubMed] [Google Scholar]
- 6.Butler MG, Thompson T. Prader-Willi syndrome: clinical and genetic findings. Endocrinologist. 2000;10(suppl 1):3S–16S. doi: 10.1097/00019616-200010041-00002. [DOI] [PMC free article] [PubMed] [Google Scholar]
- 7.Ledbetter DH, Riccardi VM, Airhart SD, Strobel RJ, Keenan BS, Crawford JD. Deletions of chromosome 15 as a cause of the Prader-Willi syndrome. N Engl J Med. 1981;304:325–329. doi: 10.1056/NEJM198102053040604. [DOI] [PubMed] [Google Scholar]
- 8.Butler MG, Palmer CG. Parental origin of chromosome 15 deletion in Prader-Willi syndrome. Lancet. 1983;321:1285–1286. doi: 10.1016/s0140-6736(83)92745-9. [DOI] [PMC free article] [PubMed] [Google Scholar]
- 9.Butler MG, Meaney FJ, Palmer CG. Clinical and cytogenetic survey of 39 individuals with Prader-Labhart-Willi syndrome. Am J Med Genet. 1986;23:793–809. doi: 10.1002/ajmg.1320230307. [DOI] [PMC free article] [PubMed] [Google Scholar]
- 10.Nicholls RD, Knoll JH, Butler MG, Karam S, Lalande M. Genetic imprinting suggested by maternal heterodisomy in nondeletion Prader-Willi syndrome. Nature. 1989;342:281–285. doi: 10.1038/342281a0. [DOI] [PMC free article] [PubMed] [Google Scholar]
- 11.Mascari MJ, Gottlieb W, Rogan PK, et al. The frequency of uniparental disomy in Prader-Willi syndrome: implications for molecular diagnosis. N Engl J Med. 1992;326:1599–1607. doi: 10.1056/NEJM199206113262404. [DOI] [PMC free article] [PubMed] [Google Scholar]
- 12.Buiting K, Gross S, Lich C, Gillessen-Kaesbach G, el-Maarri O, Horsthemke B. Epimutations in Prader-Willi and Angelman syndromes: a molecular study of 136 patients with an imprinting defect. Am J Hum Genet. 2003;72:571–577. doi: 10.1086/367926. [DOI] [PMC free article] [PubMed] [Google Scholar]
- 13.Ohta T, Gray TA, Rogan PK, et al. Imprinting-mutation mechanisms in Prader-Willi syndrome. Am J Hum Genet. 1999;64:397–413. doi: 10.1086/302233. [DOI] [PMC free article] [PubMed] [Google Scholar]
- 14.Bittel DC, Butler MG. Prader-Willi syndrome: clinical genetics, cytogenetics and molecular biology. Expert Rev Mol Med. 2005;7:1–20. doi: 10.1017/S1462399405009531. [DOI] [PMC free article] [PubMed] [Google Scholar]
- 15.Whittington JE, Butler JV, Holland AJ. Changing rates of genetic subtypes of Prader-Willi syndrome in the UK. Eur J Hum Genet. 2007;15:127–130. doi: 10.1038/sj.ejhg.5201716. [DOI] [PubMed] [Google Scholar]
- 16.Angulo MA, Butler MG, Cataletto ME. Prader-Willi syndrome: a review of clinical, genetic, and endocrine findings. J Encorinol Invest. 2015;38:1249–1263. doi: 10.1007/s40618-015-0312-9. [DOI] [PMC free article] [PubMed] [Google Scholar]
- 17.Miller JL, Lynn CH, Driscoll DC, et al. Nutritional phases in Prader-Willi syndrome. Am J Med Genet A. 2011;155A:1040–1049. doi: 10.1002/ajmg.a.33951. [DOI] [PMC free article] [PubMed] [Google Scholar]
- 18.Roof E, Stone W, MacLean W, Feurer ID, Thompson T, Butler MG. Intellectual characteristics of Prader-Willi syndrome: comparison of genetic subtypes. J Intellect Disabil Res. 2000;44(pt 1):25–30. doi: 10.1046/j.1365-2788.2000.00250.x. [DOI] [PMC free article] [PubMed] [Google Scholar]
- 19.Butler MG. Hypopigmentation: a common feature of Prader-Labhart-Willi syndrome. Am J Hum Genet. 1989;45:140–146. [PMC free article] [PubMed] [Google Scholar]
- 20.Larson FV, Whittington J, Webb T, Holland AJ. A longitudinal follow-up study of people with Prader-Willi syndrome with psychosis and those at increased risk of developing psychosis due to genetic subtype. Psychol Med. 2014;44:2431–2435. doi: 10.1017/S0033291713002961. [DOI] [PubMed] [Google Scholar]
- 21.Butler MG, Bittel DC, Kibiryeva N, Talebizadeh Z, Thompson T. Behavioral differences among subjects with Prader-Willi syndrome and type I or type II deletion and maternal disomy. Pediatrics. 2004;113(3 pt 1):565–573. doi: 10.1542/peds.113.3.565. [DOI] [PMC free article] [PubMed] [Google Scholar]
- 22.Hartley SL, Maclean WE, Jr, Butler MG, Zarcone J, Thompson T. Maladaptive behaviors and risk factors among the genetic subtypes of Prader-Willi syndrome. Am J Med Genet A. 2005;136:140–145. doi: 10.1002/ajmg.a.30771. [DOI] [PMC free article] [PubMed] [Google Scholar]
- 23.Zarcone J, Napolitano D, Peterson C, et al. The relationship between compulsive behaviour and academic achievement across the three genetic subtypes of Prader-Willi syndrome. J Intellect Disabil Res. 2007;51(pt 6):478–487. doi: 10.1111/j.1365-2788.2006.00916.x. [DOI] [PMC free article] [PubMed] [Google Scholar]
- 24.Butler MG, Sturich J, Myers SE, Gold JA, Kimonis V, Driscoll DJ. Is gestation in Prader-Willi syndrome affected by the genetic subtype? J Assist Reprod Genet. 2009;26:461–466. doi: 10.1007/s10815-009-9341-7. [DOI] [PMC free article] [PubMed] [Google Scholar]
- 25.Butler MG, Smith BK, Lee J, et al. Effects of growth hormone treatment in adults with Prader-Willi syndrome. Growth Horm IGF Res. 2013;23:81–87. doi: 10.1016/j.ghir.2013.01.001. [DOI] [PMC free article] [PubMed] [Google Scholar]
- 26.Carrel AL, Myers SE, Whitman BY, Eickhoff J, Allen DB. Long-term growth hormone therapy changes the natural history of body composition and motor function in children with Prader-Willi syndrome. J Clin Endocrinol Metab. 2010;95:1131–1136. doi: 10.1210/jc.2009-1389. [DOI] [PMC free article] [PubMed] [Google Scholar]
- 27.Lindgren AC, Lindberg A. Growth hormone treatment completely normalizes adult height and improves body composition in Prader-Willi syndrome: experience from KIGS (Pfizer International Growth Database) Horm Res. 2008;70:182–187. doi: 10.1159/000145019. [DOI] [PubMed] [Google Scholar]
- 28.Haqq AM, Stadler DD, Jackson RH, Rosenfeld RG, Purnell JQ, LaFranchi SH. Effects of growth hormone on pulmonary function, sleep quality, behavior, cognition, growth velocity, body composition, and resting energy expenditure in Prader-Willi syndrome. J Clin Endocrinol Metab. 2003;88:2206–2212. doi: 10.1210/jc.2002-021536. [DOI] [PubMed] [Google Scholar]
- 29.Eiholzer U, Gisin R, Weinmann C, et al. Treatment with human growth hormone in patients with Prader-Labhart-Willi syndrome reduces body fat and increases muscle mass and physical performance. Eur J Pediatr. 1998;157:368–377. doi: 10.1007/s004310050832. [DOI] [PubMed] [Google Scholar]
- 30.Myers SE, Carrel AL, Whitman BY, Allen DB. Sustained benefit after 2 years of growth hormone on body composition, fat utilization, physical strength and agility and growth in Prader-Willi syndrome. J Pediatr. 2000;137:42–49. doi: 10.1067/mpd.2000.105369. [DOI] [PubMed] [Google Scholar]
- 31.Angulo MA, Castro-Magana M, Lamerson M, Arguello R, Accacha S, Khan A. Final adult height in children with Prader-Willi syndrome with and without human growth hormone treatment. Am J Med Genet A. 2007;143A:1456–1461. doi: 10.1002/ajmg.a.31824. [DOI] [PubMed] [Google Scholar]
- 32.Goldstone AP, Holland AJ, Hauffa BP, Hokken-Koelega AC, Tauber M. Recommendations for the diagnosis and management of Prader-Willi syndrome. J Clin Endocrinol Metab. 2008;93:4183–4197. doi: 10.1210/jc.2008-0649. [DOI] [PubMed] [Google Scholar]
- 33.McCandless SE, Saal HM, Braddock SR, et al. Clinical report-health supervision for children with Prader-Willi syndrome. Pediatrics. 2011;127:195–204. doi: 10.1542/peds.2010-2820. [DOI] [PubMed] [Google Scholar]
- 34.Hoybye C. Endocrine and metabolic aspects of adult Prader-Willi syndrome with special emphasis on the effect of growth hormone treatment. Growth Horm IGF Res. 2004;14:1–15. doi: 10.1016/j.ghir.2003.09.003. [DOI] [PubMed] [Google Scholar]
- 35.Butler MG, Sturich J, Lee J, et al. Growth standards of infants with Prader-Willi syndrome. Pediatrics. 2011;127:687–695. doi: 10.1542/peds.2010-2736. [DOI] [PMC free article] [PubMed] [Google Scholar]
- 36.Rosenbloom ST, Butler MG. Development and implementation of electronic growth charts for infants with Prader-Willi syndrome. Am J Med Genet A. 2012;158A:2743–2749. doi: 10.1002/ajmg.a.35581. [DOI] [PMC free article] [PubMed] [Google Scholar]
- 37.Butler MG, Lee J, Manzardo AM, et al. Growth charts for non-growth hormone treated Prader-Willi syndrome. Pediatrics. 2015;135:e126–e135. doi: 10.1542/peds.2014-1711. [DOI] [PMC free article] [PubMed] [Google Scholar]
- 38.Butler MG. Management of obesity in Prader-Willi syndrome. Nat Clin Pract Endocrinol Metab. 2006;2:592–593. doi: 10.1038/ncpendmet0320. [DOI] [PMC free article] [PubMed] [Google Scholar]
- 39.Deal CL, Tony M, Hoybye C, Allen DB, Tauber M, Christiansen JS. Growth Hormone Research Society workshop summary: consensus guidelines for recombinant human growth hormone therapy in Prader-Willi syndrome. J Clin Endocrinol Metab. 2013;98:e1072–e1087. doi: 10.1210/jc.2012-3888. [DOI] [PMC free article] [PubMed] [Google Scholar]
- 40.Nellhaus G. Head circumference from birth to eighteen years: practical composite international and interracial graphs. Pediatrics. 1968;41:106–114. [PubMed] [Google Scholar]
- 41.Butler MG, Theodoro M, Skouse JD. Thyroid function studies in Prader-Willi syndrome. Am J Med Genet A. 2007;143A:488–492. doi: 10.1002/ajmg.a.31683. [DOI] [PMC free article] [PubMed] [Google Scholar]
- 42.Butler MG, Brandau DT, Theodoro M, Garg U. Cortisol levels in Prader-Willi syndrome support changes in routine care. Am J Med Genet A. 2009;149A:138–139. doi: 10.1002/ajmg.a.32633. [DOI] [PMC free article] [PubMed] [Google Scholar]
- 43.Whittington JE, Holland AJ, Webb T, Butler J, Clarke D, Boer H. Population prevalence and estimated birth incidence and mortality rate for people with Prader-Willi syndrome in one UK health region. J Med Genet. 2001;38:792–798. doi: 10.1136/jmg.38.11.792. [DOI] [PMC free article] [PubMed] [Google Scholar]