

Abstract
Genome-wide association studies (GWAS) identified susceptibility loci associated with decreased hippocampal volume, and found hippocampal subfield-specific effects at MSRB3 (methionine sulfoxide reductase-B3). The MSRB3 locus was also linked to increased risk for late onset Alzheimer’s disease (AD). In this study we uncovered novel sites of MsrB3 expression in CA pyramidal layer and arteriolar walls by using automated immunohistochemistry on hippocampal sections from 23 individuals accompanied by neuropathology reports and clinical dementia rating scores. Controls, cognitively intact subjects with no hippocampal neurofibrillary tangles, exhibited MsrB3 signal as distinct but rare puncta in CA1 pyramidal neuronal somata. In CA3, however, MsrB3-immunoreactivity was strongest in the neuropil of the pyramidal layer. These patterns were replicated in rodent hippocampi where ultrastructural and immunohistofluorescence analysis revealed MsrB3 signal associated with synaptic vesicles and colocalized with mossy fiber terminals. In AD subjects, the number of CA1 pyramidal neurons with frequent, rather than rare, MsrB3-immunoreactive somatic puncta increased in comparison to controls. This change in CA1 phenotype correlated with the occurrence of AD pathological hallmarks. Moreover, the intensity of MsrB3 signal in the neuropil of CA3 pyramidal layer correlated with the signal pattern in neurons of CA1 pyramidal layer that was characteristic of cognitively intact individuals. Finally, MsrB3 signal in the arteriolar walls in the hippocampal white matter decreased in AD patients. This characterization of GWAS-implicated MSRB3 protein expression in human hippocampus suggests that patterns of neuronal and vascular MsrB3 protein expression reflect or underlie pathology associated with Alzheimer’s disease.
Keywords: MsrB3, Alzheimer’s disease, CA1, CA3, synaptic vesicles, hippocampal arterioles
Introduction
Loss of hippocampal volume is a recognized biological marker of Alzheimer’s disease (AD) and, while influenced by vascular and metabolic factors, is also heritable[1–5]. Genome-wide association studies (GWAS) identified six independent low hippocampal volume (LHV) risk alleles, additionally linked to increased AD risk[6]. The Methionine Sulfoxide Reductase-B3 (MSRB3) locus (rs61921502) demonstrated effects specific to subfields of hippocampal formation, including the sites of the earliest neurofibrillary tangles in AD – subiculum and CA1 [6]. However, nothing is known about the MsrB3 protein expression in either normal hippocampus of cognitively intact aged individuals, or whether and how that expression may change with AD-associated pathology and cognitive decline. We hypothesized that investigating MsrB3 expression in human and rodent hippocampus will provide clues for the role of MsrB3 in the loss of hippocampal volume in the context of AD.
Reactive oxygen species oxidize protein methionine residues. The resulting methionine sulfoxides can be repaired by reductases such as Methionine-R-sulfoxide reductase B, a zinc containing protein [7]. Human and mouse genomes contain three MsrB genes (designated as 1, 2 and 3) [7]. The human MSRB3 encodes two isoforms with sequences for translocation to the endoplasmic reticulum (ER; MsrB3A) or mitochondria (MsrB3B), and MsrB3 protein has been detected in these targeted organelles in transfected primate kidney epithelial cells [7]. However, mouse MsrB3 appears to target only ER but not mitochondria, suggesting that a single ER isoform exists in rodents [8]. In this study, we evaluated MsrB3 protein expression using immunohistochemical staining in postmortem human hippocampi from 23 aged individuals including AD patients. MsrB3 immunoreactivity was observed in CA pyramidal layer and in arteriolar walls within the brain and its pattern changed during the progression of AD correlating with the AD-associated pathological hallmarks and clinical dementia. Ultrastructural analysis of MsrB3 in rat hippocampi, which mimicked the general pattern of MsrB3 expression seen in humans, revealed that it localized to synaptic vesicles (SV) in CA3 and CA1, and subsequent immunohistofluorescence studies demonstrated that MsrB3 co-localized with vesicle associated membrane protein 2 (VAMP2) and vesicular glutamate transporter 1 (VGLUT1). MsrB3 immunoreactivity in the hippocampal white matter arteriolar walls was reduced in AD as compared to the control subjects.
Materials and Methods
Human hippocampi
Human formalin-fixed paraffin-embedded (FFPE) tissue blocks of hippocampi of twenty-three subjects were acquired through the Framingham Heart Study Brain Donation Program, Framingham, Massachusetts, the Netherlands Brain Bank, Amsterdam, Netherlands, and Boston Medical Center as described in Table 1. Boston University Medical Center’s Institutional Review Board approved this study and the authors state adherence to these standards. The analyzed subjects were stratified into three groups based on Clinical Dementia Rating (CDR) score[9–11] and Braak and Braak (BB) stage[12]. The CDR was assigned months prior to death based on antemortem assessment and a post mortem retrospective CDR based on a family interview with one or more family members [13]. Group 1 consisted of true control individuals defined as cognitively healthy subjects without any presence of NFTs in the CA fields (CDR0, BB0; n = 6, age mean 66.33 ± 5.82 years, 2 female (F)/4 male (M)); Group 2 included subjects either cognitively intact or with minimal cognitive dysfunction (CDR0-0.5) in the limbic BB stages (CDR0-0.5, BBI-III; n = 11, age mean 91.27 ± 7.35 years, 5F/6M); and Group 3 consisted of subjects with definite AD by NINCDS-ADRDA criteria and in the isocortical BB stages (CDR1-2, BBIV-V; n = 6, age mean 89.50 ± 4.64 years, 3F/3 M) (Table 1). Group 1 subjects (true controls without any evidence of NFTs in the hippocampus) are inherently younger than Group 2 and 3 subjects, as NFTs increase with age even in cognitively intact subjects. No Lewy body pathology was reported in any of the subjects.
Table 1.
Analyzed hippocampi of subjects organized according to Clinical Dementia Rating (CDR) score and Braak and Braak (BB) stage. Group 1: cognitively intact subjects without neurofibrillary tangles (NFTs) in the hippocampus (CDR0, BB0), n=6; Group 2: cognitively normal or mildly impaired subjects with or without AD-associated NFT pathology (CDR0-0.5, BBI-III), n=11; and Group 3: AD patients with AD-associated NFT pathology (CDR1-2, BBIV-V), n=6.
| Subject | Braak & Braak stage | Neuritic Plaques (CERAD criteria)* |
Cerebral Amyloid Angiopathy** (F, O) |
Cognitive status | Age (y) | Sex | PMI (h) | ||||
|---|---|---|---|---|---|---|---|---|---|---|---|
| H | F | T | P | O | |||||||
| CDR 0, BB 0 (Group 1) | |||||||||||
|
| |||||||||||
| NBB 2012 052 | 0 | 0 | 0 | 0 | 0 | 0 | 0 | No evidence of dementia# | 64 | F | 5.7 |
| NBB 2010 115 | 0 | 0 | 0 | 0 | 0 | 0 | 1+(O) | No evidence of dementia | 70 | M | 3.6 |
| NBB 2011 091 | 0 | 0 | 0 | 0 | 0 | 0 | 0 | No evidence of dementia | 76 | M | 6.8 |
| BM 23 | 0 | 0 | 0 | – | – | – | – | No evidence of dementia | 66 | F | 24 |
| BM 29 | 0 | 0 | 0 | – | – | – | – | No evidence of dementia | 61 | M | 24 |
| BVAX 85 | 0 | 0 | 0 | 0 | 0 | 0 | 0 | No evidence of dementia | 61 | M | 7.5 |
|
| |||||||||||
| CDR 0-0.5, BB I-III (Group 2) | |||||||||||
|
| |||||||||||
| BVAX 255 | I | 0 | 0 | 0 | 0 | 0 | 0 | 0 | 92 | F | 16 |
| NBB 2012 059 | II | 0 | 1+ | 0 | 1+ | 0 | 1+ (O) | 0 | 98 | F | 4.6 |
| NBB 2012 070 | II | 1+ | 0 | 1+ | 0 | 1+ | 2+ (F, O) | 0 | 79 | M | 5.8 |
| NBB 2012 092 | II | 0 | 0 | 0 | 0 | 0 | 0 | 0 | 90 | M | 5.8 |
| NBB 2013 011 | III | 0 | – | – | – | – | 1+ (region not specified) | 0 | 92 | F | 4.4 |
| NBB 2012 001 | II | 0 | 1+ | 1+ | 0 | 1+ | 1+ (F), 3+ (O) | 0.5 | 79 | M | 5.7 |
| NBB 2013 013 | II | 0 | 0 | 0 | 0 | 0 | 0 | 0.5 | 89 | M | 6.8 |
| BVAX 219 | II | 0 | 1+ | 0 | 1+ | 0 | 0 | 0.5 | 97 | F | 6 |
| BVAX 226 | II | 0 | 0 | 0 | 0 | 0 | 0 | 0.5 | 97 | F | – |
| BVAX 147 | III | 1+ | 3+ | 3+ | 3+ | 2+ | 2+ (F), 3+ (O) | 0.5 | 89 | M | – |
| NBB 2012 067 | III | 0 | 1+ | 0 | 1+ | 1+ | 1+ (F), 2+ (O) | 0.5 | 102 | M | 5.0 |
|
| |||||||||||
| CDR 1-2, BB IV-V (Group 3) | |||||||||||
|
| |||||||||||
| NBB 2013 009 | IV | 3+ | 1+ | 2+ | 0 | 0 | 2+ (F, O) | 1 | 92 | F | 7.4 |
| NBB 2008 075 | IV | 1+ | 1+ | 2+ | 1+ | 1+ | 3+ (F, O) | Overt dementia# | 88 | M | 5.0 |
| BVAX 100 | IV | 2+ | 2+ | 2+ | 2+ | 2+ | 2+ (F, O) | 1 | 89 | M | 3.0 |
| BVAX 205 | IV | 2+ | 2+ | 1+ | 1+ | 1+ | 1+ (O) | 1 | 96 | F | 3.5 |
| BVAX 170 | V | 1+ | 3+ | 3+ | 3+ | 3+ | 1+ (F, O) | 2 | 90 | F | 3.5 |
| BVAX 253 | V | 1+ | 2+ | 2+ | 2+ | 1+ | 1+ (F), 4+ (O) | 2 | 82 | M | 24 |
0 = none; 1+ = sparse; 2+ = moderate; 3+ = frequent; CERAD = The Consortium to Establish a Registry for Alzheimer’s Disease.
0 = none; 1+ = mild; 2+ = moderate; 3+ = severe; 4+ = very severe. H = hippocampus, F = medial frontal gyrus (prefrontal cortex), T = temporal pole, P = parietal, O = occipital (visual cortex). # = CDR not performed. - = not reported. NBB = Netherlands Brain Bank. BM = Boston Medical Center. BVAX = Brain Bank of the Boston University Alzheimer Disease Center. F = female; M = male. PMI (h) = post mortem interval (hours).
All subjects were de-identified and authors were blinded to subjects’ CDR score and BB stage during data acquisition. We performed tau immunohistochemistry (IHC) on all obtained hippocampi to corroborate reported BB stages in the accompanying neuropathological reports and to perform quantification of neurofibrillary tangles (NFTs) in CA1 field. In this study we deliberately omitted the analysis of the ultimate BB stage (BBVI) because of the associated pervasive but fluctuating neuronal loss in CA1 regions of end-stage AD patients precludes reliable analysis. No neuritic plaques were present in cognitively intact subjects of Group 1 (CDR0, BB0; Table 1) while beta-amyloid pathology was reported in all Group 3 subjects - patients diagnosed with AD clinically and neuropathologicaly (CDR1-2, BBIV-V; Table 1). In between Groups 1 and 3, were subjects with only hippocampal/limbic NFTs (BBI-III) and heterogeneous in terms of both beta-amyloid pathology and cognitive status (CDR0-0.5; Table 1). Neuropathology reports for four subjects (two cognitively intact individuals, CDR0, and two with minimal cognitive deficits, CDR 0.5; Group 2, Table 1) reported absence of any beta-amyloid pathology. It is possible that some or all four of these individuals (ages 89-97) could have met criteria for Primary Age-Related Tauopathy (PART)[14]and not develop AD.
Immunohistochemistry (IHC) in human hippocampi
FFPE blocks were sectioned at 5 μm thickness, dried at room temperature for 24 hours, and heated at 80°C for 24 hours before IHC experiments. Deparaffinization, antigen retrieval, and subsequent staining were performed with Ventana Benchmark Ultra automated IHC instrument using commercially available primary antibodies, Horseradish Peroxidase-conjugated secondary antibody with diaminobenzidine chromogen and hematoxylin counterstain. Primary antibodies included rabbit anti-MsrB3 polyclonal antibody, a pan-MsrB3 antibody[15] (1:40; HPA014432 Atlas Antibodies, Stockholm, Sweden, and NBP1-84259, Novus Biologicals, Littleton, CO), mouse anti-human beta-amyloid [6F/3D] monoclonal antibody (1:25, Dako, Glostrup, Denmark), rabbit anti-human tau [A0024] polyclonal antibody (1:3200, Dako, Glostrup, Denmark), and mouse anti-human phospho-Paired Helical Filament-tau [AT8] monoclonal antibody (1:2000, Pierce, Rockford, IL) for analyses. Polyclonal anti-MsrB3 immunohistochemical specificity in FFPE tissues was characterized with immunoabsorption assay with 10X molar excess of the MsrB3 immunogen (APrEST72630, Atlas Antibodies, Stockholm, Sweden) (Supplemental Figure 1, SF 1). Endoplasmic reticulum marker mouse anti-Calregulin monoclonal antibody (1:4000, sc-373863, Santa Cruz, Dallas, TX) and mouse anti-mitochondrial marker MTC02 monoclonal antibody (1:50, ab3298, Abcam, Cambridge, MA) were used to examine MsrB3 localization in these organelles[7] in human hippocampus. Mouse anti-muscle-specific actin monoclonal antibody (prediluted, Cat#760-2601, Ventana Medical Systems, Tucson, AZ) was used to highlight vascular walls. IHC was performed in independent, triplicate experiments, conducted on the Ventana Benchmark Ultra to remove human error and diminish variables between independent experiments. Representative cases with established immunoreactivity (IR) patterns were stained together with subsequently added samples in order to verify consistency in IHC experiments. We analyzed MsrB3 IR quantitatively in CA1 field in all subjects (n = 23) and semi-quantitatively in CA3 field in most subjects (n = 18) with a distinctly identifiable CA3 field (Table 1). Semi-quantitative examination of MsrB3-IR in the walls of blood vessels within the hippocampal cortex and white matter (WM) was also conducted using triplicate IHC sections in all subjects.
Quantitative IHC analysis
Quantitative analysis of FFPE tissue samples utilized three step-wise sections separated by at least 10 μm, and quantitative results from image analysis were averaged to obtain representative values for each subject. De-identified slides were imaged using an Olympus BX60 light microscope, QImaging Retiga 2000R camera, and QCapture Suite software. ImageJ Stitching plugin was used to compose high resolution images for figure illustrations[16]. Three 20× field images, encompassing the majority of CA1 field, were used in MsrB3 IHC analysis from each hippocampal section (SF 2 A, B). Mean data values from three 20× field images of CA1 field in triplicate experiments comprised representative values for each subject (a total of nine 20× fields analyzed). The percentages of two main MsrB3-ir phenotypes in CA1 pyramidal neurons (SF 2 C) were obtained manually using the ImageJ CellCounter plugin. The percentage of NFT-containing neurons in CA1 pyramidal neuronal population of each subject was analyzed using three 10× field images from three independent tau IHC experiments. All field images were analyzed with ImageJ, version 1.48, Bethesda, MD National Institutes of Health.
Semi-quantitative IHC analysis
De-identified slides were viewed at 40× magnification by two independent observers for semi-quantitative analysis of MsrB3 signal in CA3 pyramidal neuron somata and in CA3 neuropil in triplicate IHC experiments. Similarly, MsrB3-IR in blood vessel walls in CA cortex and white matter was scored semi-quantitatively by three independent, blinded observers. Both the CA3 and blood vessel analysis used a scale of 0-3; 0 = no MsrB3-IR, 3 = strongest MsrB3-IR. Semi-quantitative scores of triplicate IHC experiments were averaged to find the mean MsrB3-IR in CA3 and in the hippocampal blood vessel walls for each subject.
Statistical analyses
Quantitative data among subject groups were analyzed by two-tailed one-way ANOVA and post-hoc Tukey multiple comparison test in CA1 field analysis of 23 subjects. The number of cells displaying each MsrB3-ir phenotype in CA1 was compared across subject groups, testing the null hypothesis that no significant difference should be observed across groups (alpha = 0.05). CA3 and CA1 MsrB3-IR were tested empirically using bivariate linear fits as to refine the findings. Again, the null hypothesis was that no significant difference should be observed (alpha = 0.05). MsrB3-IR in CA1 and CA3 fields was ultimately analyzed by Pearson r correlation. The respective R2 values are representative of the percent of response variable variation or percent variation explained by the model. The p-values of the F-statistic were used to test the null hypotheses formulated and were representative of the goodness of fit. Correlation analyses between MsrB3-IR and CERAD neuritic plaque (NP) scores, according to neuropathology reports accompanying each case, and between MsrB3-IR and NFT quantification were performed by Pearson r correlation. Statistical analyses were performed with GraphPad Prism, version 5.0b, San Diego, CA: GraphPad Software Inc., and with JMP®, Version 11.2.1. SAS Institute Inc., Cary, NC, 1989-2013.
Rodent hippocampi
Eight month old C57BL/6J mice and three month old Wistar rats (strain 003, Charles River Laboratories International, Massachusetts) were anesthetized with 10 mg/kg xylazine and 80 mg/kg ketamine hydrochloride given intraperitoneally and subsequently perfused transcardially with 0.1M phosphate buffer (PB) followed by 4% paraformaldehyde with 0.01% glutaraldehyde in 0.1M PB, pH 7.4, for use in EM and IF studies. All animal procedures were approved by the Institutional Animal Care and Use Committee of Boston University and the authors state adherence to these standards.
Immunohistofluorescence (IF)
We examined MsrB3 localization in comparison to synaptic markers and hippocampal transmitters using mouse anti-VAMP2 monoclonal antibody (1:50-1:100, AM05628PU-S, Acris Antibodies) and mouse anti-VGLUT1 monoclonal antibody (1:50, #135311, Synaptic Systems) in hippocampal sections from a well-perfused rat brain. Secondary antibodies used were donkey anti-mouse IgG cross absorbed Dylight 488 (1:15 SA5-10166, ThermoFisher, Rockford, IL), and donkey anti-rabbit IgG Alexa Fluor 594 (1:100 A21207, ThermoFisher, Rockford, IL). Sections were counterstained with DAPI (1μg/ml, Cat#62247, ThermoFisher, Rockford, IL) and then treated with 0.05% Sudan Black B (Cat#199664, Sigma, Dallas, TX) wash in 70% ethanol to reduce autofluorescence in FFPE tissues[17] before mounting. Slides were imaged on a Zeiss LSM 700 laser scanning confocal microscope and digital images analyzed with ZEN 2009 software at BUSM Housman Medical Research Center.
Electron Microscopy (EM)
For ultrastructural analysis, animals were perfused transcardially with 0.1M phosphate buffer (PB) followed by 4% paraformaldehyde with 0.01% glutaraldehyde in 0.1M PB, pH 7.4 (EM fixative). After 6 hours of post-perfusion fixation in EM fixative, rodent brains were transferred to 0.5% PFA in PBS and stored at 4°C. EM immuno-gold visualization of MsrB3 (1:10; HPA014432 Atlas Antibodies, Stockholm, Sweden in rodent hippocampus was performed at Harvard Medical School EM core facility, Boston, MA.
Results
MsrB3-immunoreactivity is found in the human hippocampal pyramidal layer, vascular walls, choroid plexus epithelium, and ependymal ventricular lining
We observed MsrB3-immunoreactivity (MsrB3-IR) in multiple tissue compartments (Figure 1A). Cortical blood vessel walls were MsrB3-immunoreactive (MsrB3-ir) throughout while CA1 and CA3 pyramidal layers exhibited specific patterns of MsrB3 signal (Figure 1B, C). In CA1, MsrB3 IHC highlighted distinct somatic puncta in pyramidal neurons (Figure 1B). In contrast, CA3 field was characterized by fine, diffuse MsrB3 signal in pyramidal somata and punctate signal in the surrounding neuropil (Figure 1C). In addition to blood vessel luminal linings, epithelium in the choroid plexus showed strong cytoplasmic signal (Figure 1D). Finally, ependymal cells were MsrB3-ir, in particular at the apical surface (Figure 1E).
Figure 1. MsrB3 protein signal in hippocampal pyramidal layer, vascular walls, choroid epithelium, and ependymal ventricular lining.
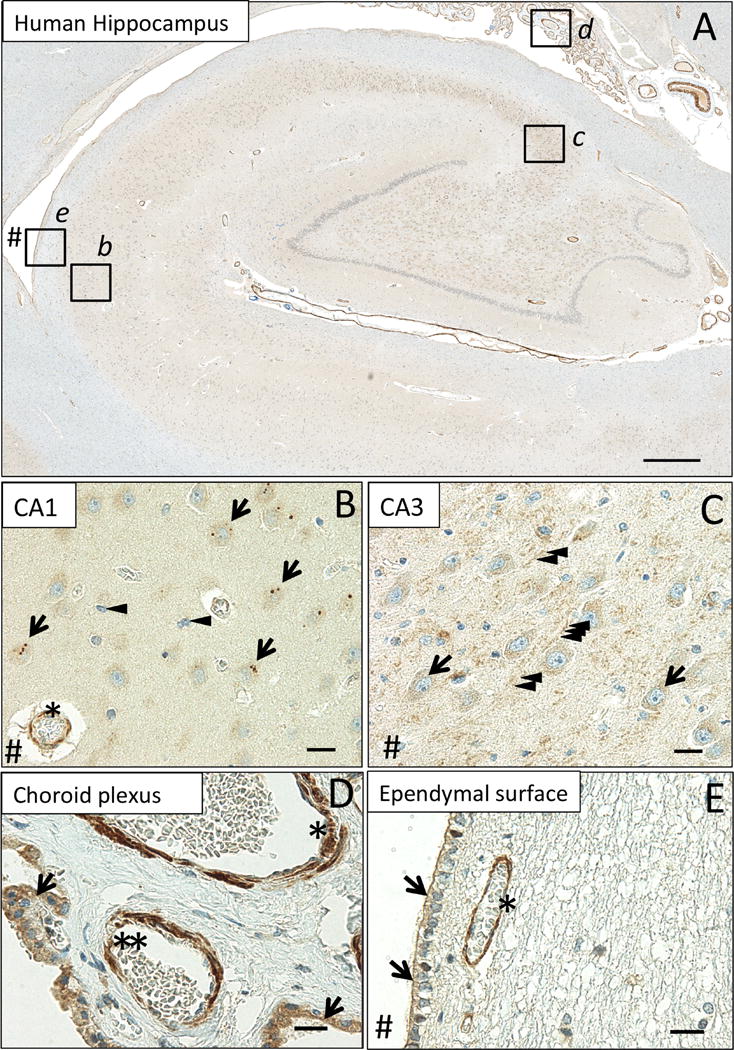
(A) MsrB3-immunoreactivity in CA1 (inset b), CA3 (inset c), choroid plexus (inset d) and the ependymal ventricular lining (inset e). In pyramidal neurons of healthy human (CDR0, BB0) CA1, MsrB3 was visualized as few somatic, sharply demarcated, 1-3 μm puncta (B, arrows); cortical glial cells do not give rise to MsrB3 signal (B, arrowheads). Asterisk indicates MsrB3-immunoreactive (-ir) cortical blood vessel wall. CA3 neuropil displays punctate MsrB3 signal (C, arrowheads) while CA3 pyramidal somata show diffuse signal (C, arrows). (D) The choroid plexus epithelium is MsrB3-ir (arrows). The thicker vascular wall of an artery (asterisk) and a thinner wall of a small vein (double asterisk) are MsrB3-ir. (E) Ependymal cells are MsrB3-ir at the apical surface (arrows) near an MsrB3-ir blood vessel wall (asterisk). # indicates (direction of) lateral ventricle. Scale bar A = 200 μm, B-E = 20 μm.
MsrB3-immunoreactivity patterns in CA1 and CA3 have similar features in human and rat hippocampus
To determine the subcellular localization of MsrB3 in hippocampal cell populations, we performed studies on freshly fixed transcardially-perfused rat brain – a biological material superior to the post-fixed human tissue obtained a significant period of time after death. In comparative analysis of human and rat CA1 and CA3, we found similar MsrB3 signal patterns, while the overall signal was stronger in rat (Figure 2). Somatic MsrB3-ir puncta were found in human and rat CA1 pyramidal neurons (Figure 2A, B), while the punctate neuropil signal in human CA3 (Figure 2C) was more robust in rat CA3 where prominent MsrB3-IR puncta frequently outlined pyramidal somata and their apical dendrites (Figure 2D). The similarity of the staining patterns in humans and rats indicated that the rat may be a good model to study MsrB3 expression at the ultrastructural levels.
Figure 2. MsrB3-immunoreactive pattern in CA1 and CA3 is similar in human and rat hippocampus.
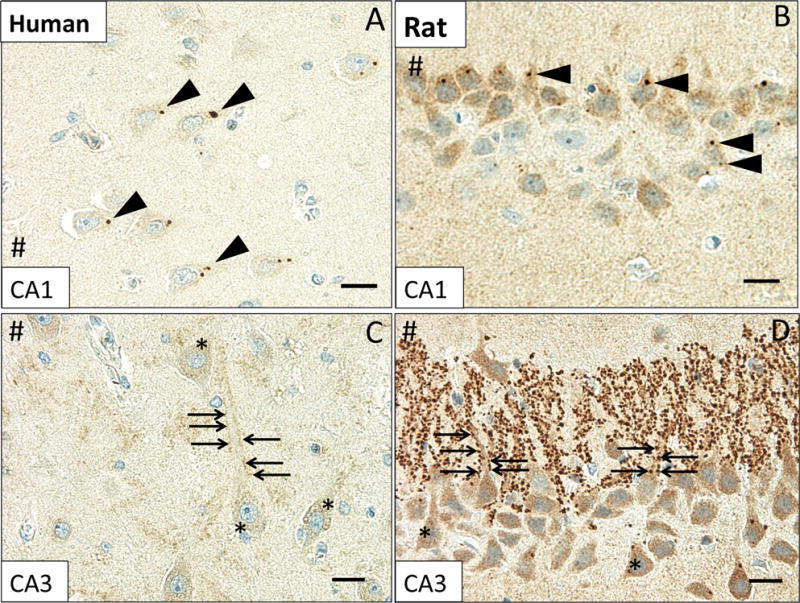
MsrB3 punctate signal in human CA1 pyramidal neuron somata (A, arrowheads) was also observed in the rat (B, arrowheads). Punctate MsrB3 neuropil signal surrounding the pyramidal neuron apex (C, arrows) and diffuse MsrB3 signal in the pyramidal somata (C, asterisks) in human CA3 are similar in distribution to the signals in rat CA3 (D). Rat CA3 shows particularly prominent MsrB3-immunoreactive puncta along apical dendrites of pyramidal neurons (D, arrows); diffuse somatic signal is also strong (D, asterisks). # indicates direction of lateral ventricle. Scale bar A, C, D = 20 μm, B = 15 μm.
Some synaptic vesicles of rodent hippocampi associate with MsrB3
To identify the cellular organelle that might harbor MsrB3 signal we examined sections from mouse and rat hippocampus using electron microscopy (EM), as human postmortem brain tissue is seldom suitable for ultrastructural analysis. Human CA1 and CA3 field–specific patterns of MsrB3 protein expression were not reflected in markers for endoplasmic reticulum (ER) and mitochondria (SF 3), the sites of MsrB3 localization in primate epithelial cell lines[7]. Considering that rodents had a single MsrB3 isoform (MsrB3A) that was found to associate with ER in epithelial cell lines, we carefully looked for ER-associated MsrB3 signal in mouse and rat hippocampal sections. However, we found MsrB3 signal labeling at multiple synaptic vesicles (SV) in CA3 (Figure 3). Immunogold labeling was suboptimal in CA1 of mouse hippocampus, and we repeated the experiment using Wistar rat hippocampus, which is heavily MsrB3-immunoreactive (see Figure 2).
Figure 3. Hippocampal MsrB3 signal associates with some synaptic vesicles in mouse CA3.
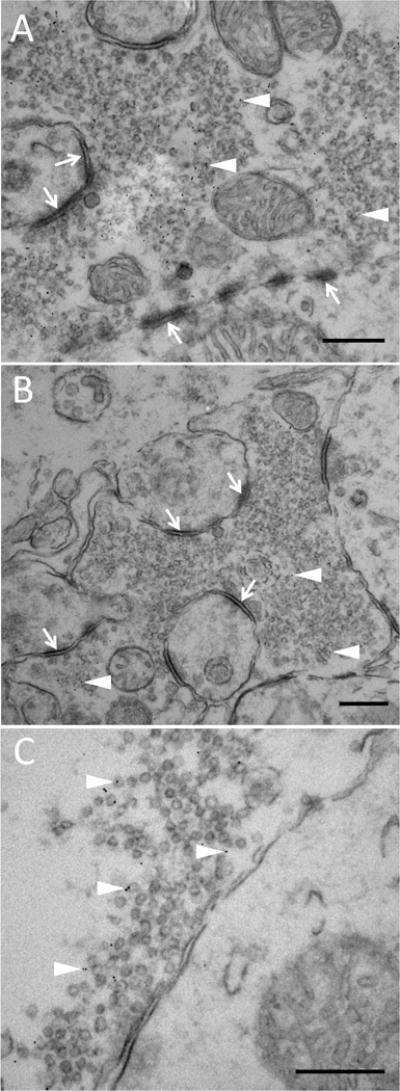
MsrB3 immuno-gold labeling highlights some synaptic vesicles (SV) (A-C, arrowheads) in the presynaptic terminal; asymmetric, excitatory synapses (A and B, arrows) in CA3 of mouse hippocampi. Scale bars = 300 nm.
Consistently, ultrastructural evaluation of MsrB3 immuno-gold signal in CA3 (Figure 4A) and CA1 (Figure 4B) in rat hippocampus revealed MsrB3-IR in many SVs. We next sought to identify SV- and neurotransmitter-associated proteins in the hippocampal subregions that might co-localize with MsrB3 (Figure 4C-I). Consistent with ultrastructural findings in mouse and rat hippocampus in CA3, we found MsrB3 signal co-localized with vesicle-associated membrane protein 2 (VAMP2) (Figure 4D-F). Consistent with strong MsrB3 punctate signal along apical dendrites in rat CA3 pyramidal neurons (as shown in Figure 2D), the site of glutamatergic mossy fibers synapses, we observed co-localization of MsrB3 and vesicular glutamate transporter 1, VGLUT1 (Figure 4G-I). However, the rare MsrB3-ir puncta at CA1 cell bodies did not co-localize with VAMP2 or VGLUT1 (SF 4).
Figure 4. MsrB3 co-localizes with synaptic vesicle proteins VAMP2 and VGLUT1 in CA3.
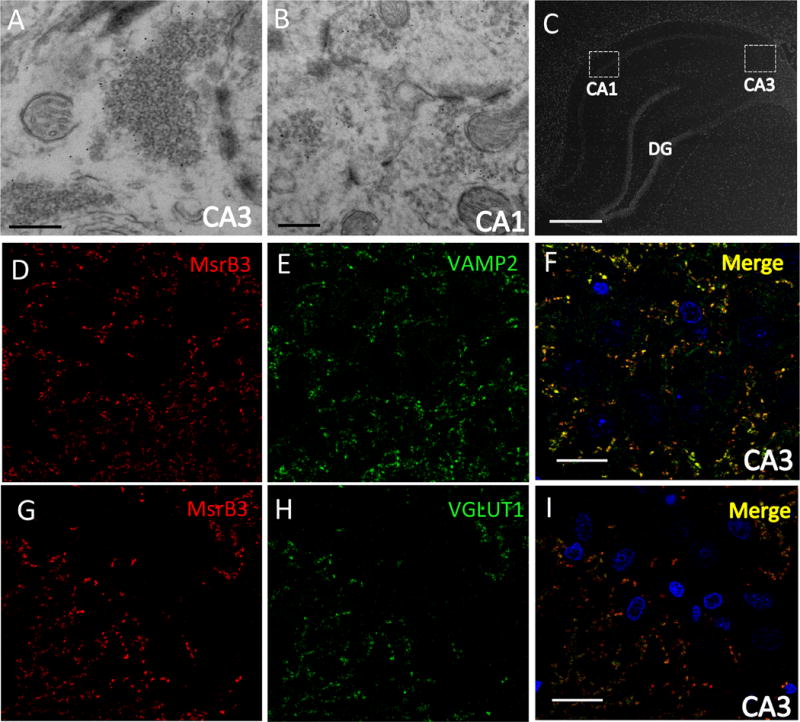
MsrB3 immuno-gold labeled synaptic vesicles in rat CA3 (A) and CA1 (B). In rat CA3 immunohistofluorescence (C) MsrB3 punctate signal outlined pyramidal somata and co-localized with vesicle associated membrane protein 2 (VAMP2) (D-F) and with vesicular glutamate transporter type 1 (VGLUT1) (G-I). Scale bar A, B = 300 nm, C = 800 μm, F, I = 30 μm.
MsrB3 expression pattern in CA1 pyramidal layer changes in AD
Because MsrB3 signal associated with SVs and demonstrated localization consistent with intrinsic connections of pyramidal layers of CA1 and CA3, we examined whether MsrB3-IR patterns in these hippocampal fields might change with onset and progression of AD. As shown earlier in Figures 1B and 2A, the MsrB3-IR pattern in CA1 pyramidal neurons of a healthy human hippocampus is apparent as distinct but rare somatic puncta (Figure 5A). Across the three groups of subjects (see Table 1), we observed that as NFTs accumulated in progressive BB stages (I-V) and cognitive status declined (CDR0.5-2), MsrB3-ir puncta appeared smaller and became more numerous (Figure 5B). Consistently, NFT-containing neurons often contained frequent, smaller MsrB3-ir puncta (Figure 5C, D).
Figure 5. MsrB3 signal in CA1 changes during AD progression.
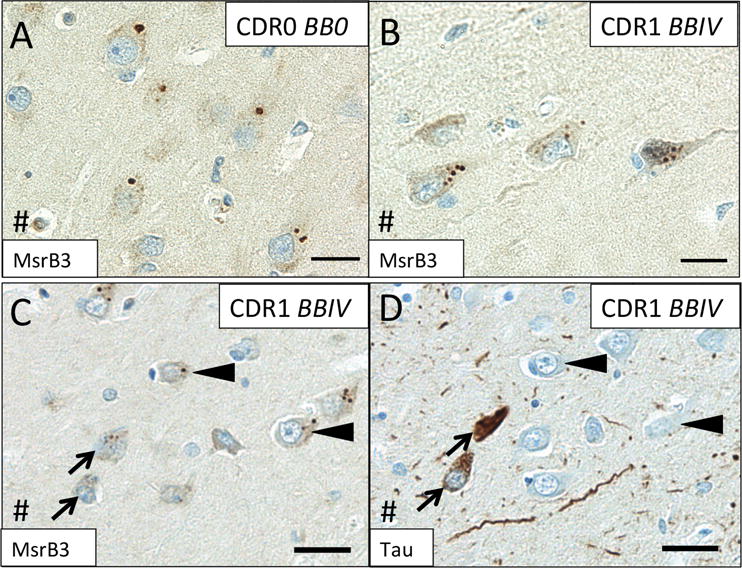
In CA1 neurons in cognitively intact subjects without hippocampal neurofibrillary tangles (NFTs) (Group 1 - CDR0, BB0), MsrB3 signal appears as rare somatic puncta (A) that become more frequent in AD patients (Group 3 - CDR1, BBIV) (B). IHC for MsrB3 (C) and tau (D) in adjacent CA1 sections from an AD patient show NFT-containing neurons with frequent, smaller MsrB3-immunoreactive puncta in the soma (arrows), while non-tangled neurons have rare, larger MsrB3-immunoreactive somatic puncta (arrowheads). # indicates direction of lateral ventricle. Scale bar A, B = 20 μm, C, D = 30 μm.
Quantitative analysis confirmed a significant decrease in the percentages of CA1 pyramidal neurons with rare MsrB3-ir somatic puncta (“healthy phenotype”) in subjects with early AD-associated pathology (Group 2 - CDR0-0.5, BBI-III) and in AD patients (Group 3 - CDR1-2, BBIV-V) compared to controls (Figure 6A, Supplemental Table (ST) 1.1). Simultaneously, compared to control subjects, the percentage of neurons with frequent somatic (≥5) MsrB3-ir puncta (“degenerative phenotype”) was increased significantly in AD patients (Figure 6B, ST 1.2). The degenerative MsrB3-IR phenotype correlated positively with the accumulation of NFTs in CA1 while the healthy MsrB3-IR phenotype did not (Figure 6C; ST 1.3, 1.4).
Figure 6. MsrB3-immunoreactive phenotypes in CA1 pyramidal neurons during Alzheimer’s disease (AD) progression correlate with the accumulation of AD pathological hallmarks.
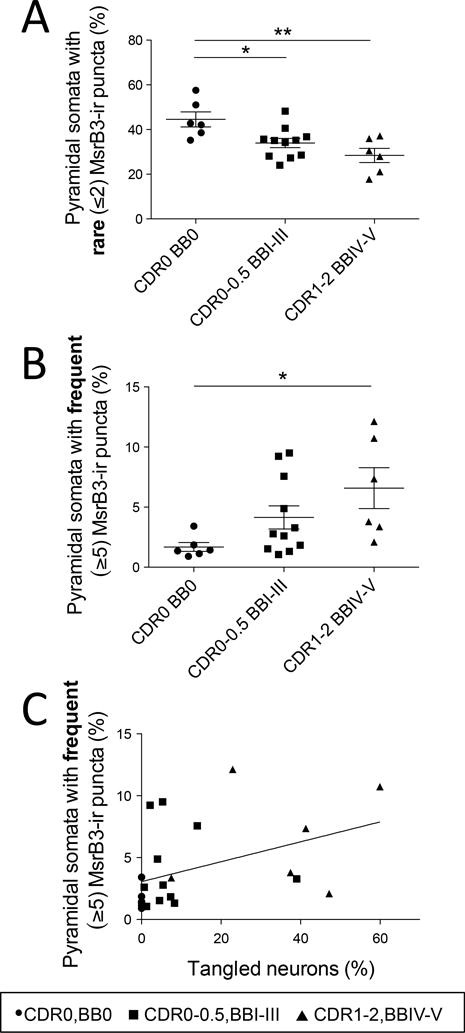
The percentage of CA1 pyramidal neurons with rare somatic (≤2) MsrB3-immunoreactive (-ir) puncta decreased in AD patients (CDR1-2, BBIV-V) and subjects with early AD pathology (CDR0-0.5, BBI-III) compared to controls (CDR0, BB0) (A), while the percentage of neurons with frequent somatic (≥5) MsrB3-ir puncta increased in AD patients compared to controls (B). The percentage of pyramidal neurons with frequent MsrB3-ir puncta correlated positively with the percentage of tangled neurons in CA1 (C). *p<0.05, **p<0.01, by one-way ANOVA and Pearson correlation.
Considering CA3 subfield-specific MsrB3 neuropil signal and intrinsic connections between CA3 and CA1, we examined the relationship between MsrB3-IR phenotypes in CA1 pyramidal neurons and CA3 MsrB3 neuropil signal intensity. Indeed, the intensity of MsrB3 signal in CA3 neuropil correlated positively with the percentage of CA1 pyramidal neurons exhibiting the MsrB3-IR healthy phenotype, i.e. rare (≤2) somatic puncta (Figure 7, ST 1.5).
Figure 7. MsrB3 signal in CA3 neuropil correlates positively with the percentage of CA1 pyramidal neurons exhibiting “healthy” MsrB3-immunoreactive phenotype (rare, ≤2, somatic puncta).
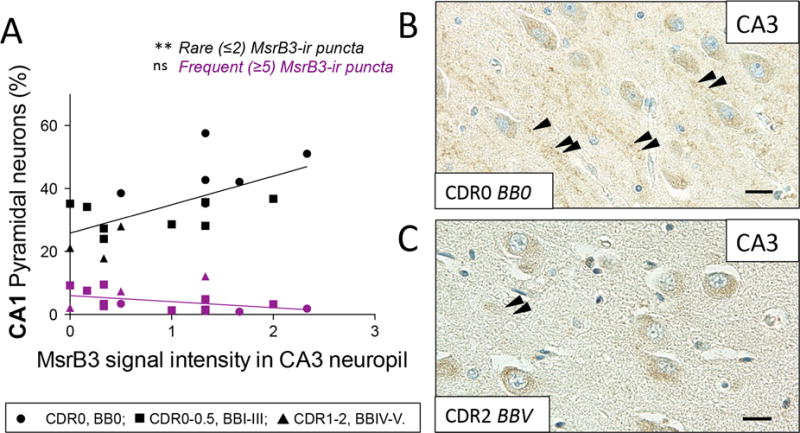
(A) The intensity of MsrB3 signal in CA3 neuropil positively correlated with the percentage of CA1 pyramidal neurons with rare (≤2) MsrB3-immunoreactive (-ir) puncta. (B) MsrB3 signal in CA3 neuropil in a healthy control (CDR0, BB0, arrowheads) compared to a hardly discernible neuropil signal in an AD subject (CDR2, BBV) (C, arrowheads). Scale bars = 20 μm. ns=nonsignificant, **p<0.01, by Pearson correlation.
MsrB3 signal intensity decreases in white matter arteriolar walls of AD patients’ hippocampi
As indicated in Figure 1, MsrB3 signal was observed in the vessel walls of choroid plexus and hippocampal cortex and white matter. MsrB3 IHC highlighted strongly arteriolar smooth muscle layer (Figure 8A). Endothelial/pericyte cell layer appeared MsrB3-ir as well (Figure 8B). We observed variation in the intensity of MsrB3-IR in the hippocampal arteriolar walls in our subjects, often depending on the BB stage and CDR score (Figure 8C, D). The presence of cerebral amyloid angiopathy (CAA) did not explain the variation in MsrB3 signal within the arteriolar walls in our sample, as CAA was present in the hippocampi of only four of our subjects and often restricted to leptomeningeal vessels (see Table 1, ST 2.1). Due to the presence of vascular comorbidity in our subjects, we evaluated MsrB3 signal in the arteriolar vascular walls in the hippocampal cortex and white matter in relationship to various parameters of neurologic vascular health (ST 2.1). The level of arteriolosclerosis in the hippocampal white matter (ST 2.2) and cortex (ST 2.3) did not correlate with MsrB3-IR measures or AD pathological hallmarks. There was no significant difference in most MsrB3-IR measures when subjects were grouped according to the history of hypertension (ST 2.4), history of stroke or transient ischemic attack (TIA) (ST 2.5), microscopic infarcts present in the hippocampus (ST 2.6), or hippocampal vascular white matter disease (ST 2.7). Only in subjects with a history of stroke or TIA, the MsrB3-IR signal in arteriolar walls in white matter, but not in cortex, was significantly increased compared to subjects without stroke or TIA (ST 2.5). Also, subjects with hippocampal microinfarcts had significantly lower MsrB3-IR in CA3 neuropil compared to subjects without hippocampal microinfarcts (ST 2.6). To examine the significance of variation in MsrB3 signal intensity in arteriolar walls further, we tested the vascular MsrB3-IR in correlation with the MsrB3-IR in CA pyramidal neurons and neuropil. MsrB3 signal intensity in the arteriolar walls in hippocampal white matter and cortex correlated positively with the percentage of CA1 neurons with the healthy MsrB3-ir phenotype (i.e. rare (≤2) somatic puncta) (ST 2.8). Further, MsrB3 signal intensity in arteriolar walls in hippocampal white matter (but not cortex) was significantly decreased in AD patients compared to controls (Group 1) and subjects with early AD-associated pathology (Group 2) (Figure 8E, ST 2.9, 2.10).
Figure 8. MsrB3-immunoreactivity in the hippocampal white matter arteriolar walls changes in Alzheimer’s disease.
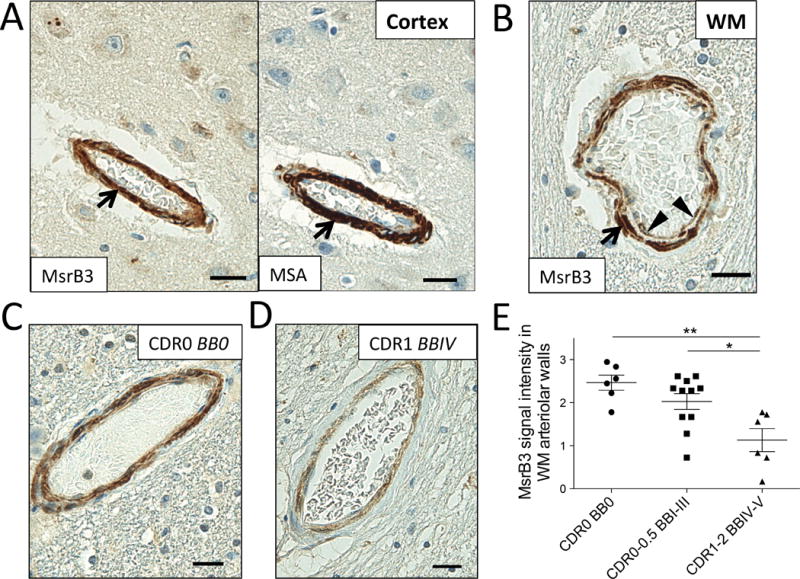
MsrB3 was strongly expressed in smooth muscle of vessel walls (arrows), highlighted in adjacent section with muscle-specific actin (MSA) IHC, in hippocampal cortex (A) and white matter (WM) (B). (B) An arteriole in hippocampal WM shows MsrB3 immunoreactivity in smooth muscle (arrow) and endothelial/pericyte (arrowheads) cell layers. Hippocampal WM arteriolar walls were strongly MsrB3-immunoreactive in healthy controls (CDR0, BB0) (C), while weak signal was often found in AD subjects (CDR1, BBIV) (D). (E) The intensity of MsrB3 signal in the arteriolar walls of hippocampal white matter was significantly reduced in AD patients compared to controls and subjects with early AD-associated pathology. Scale bars = 20 μm. *p<0.05, **p<0.01, by one-way ANOVA.
Discussion
In this study we uncovered novel sites of MsrB3 protein expression of potential relevance for AD and hippocampal volume pathology. The presence of MsrB3 in CA pyramidal neurons and neuropil might have multifaceted relevance for the role of MsrB3 in hippocampal functional morphology.
First, MsrB3 protein was associated with synaptic vesicles (SV) (Fig. 3) as evidenced by immuno-EM and by colocalization VAMP2/synaptobrevin using IF (Fig. 4). MsrB3 was expressed in CA3 pyramidal layer neuropil, in particular in rat stratum lucidum (Fig. 2), where glutamatergic axons of dentate granule cell mossy fibers terminate on apical dendrites of CA3 pyramidal neurons. Consistently, MsrB3 did co-localize with type 1 vesicular glutamate transporter VGLUT1 in CA3 (Fig 4), present in CA3 mossy fibers terminals[18]. Mossy fiber projections to CA3 in human hippocampus have strong proximal basilar dendrites component (in addition to the aforementioned apical dendrite) which is thought to underlie spatial task performance [19] impaired in AD. The presence of MsrB3 in mossy fiber synapses on apical and basilar dendrites of CA3 pyramidal neurons thus might be important for spatial memory in humans. In contrast, we did not find co-localization of MsrB3 with VAMP2 or VGLUT1 in the CA1 region (Fig 4). Both IHC and IF experiments in human and rat CA1 localized MsrB3 punctate signal at the somata of pyramidal neurons (Figs 1, 2, 5, SF 4). Because EM ultrastructural analysis found MsrB3-labeled synaptic vesicles in CA1 of rat hippocampus (Fig. 4) it is likely that the MsrB3-ir CA1 pyramidal somatic puncta associate with somatic synapses. CA1 pyramidal neurons have somatic synapses with presynaptic zones belonging to inhibitory interneurons [20]. Somatic inhibitory synapses in CA1 pyramidal neurons are characterized by the excitatory activity-related rapid structural plasticity resulting in synapse enlargement and increased efficiency of somatic inhibition[21]. The observed changes in the prevalent phenotype of MsrB3-IR in CA1 pyramidal neurons of examined subjects - from rare, larger somatic puncta in healthy subjects to frequent, smaller somatic puncta in AD patients - might reflect or underlie the changes in the activity-related synaptic plasticity in AD.
Second, mossy fiber boutons contain zinc transporter-3 which has been shown to decorate SV of both mouse and monkey[22]. Historically, zinc histochemical staining has been used to highlight entorhinal cortex, amygdala and hippocampus[23]. MsrB3 is a zinc-containing enzyme and the ability to bind zinc is essential for its enzymatic activity[24]. Upon reducing methionine R-sulfoxide, the regeneration of MsrB3 is dependent on reducing agents such as dithiothreitol (in vitro) and thioredoxin[24]. Thus, in mossy fiber terminals, where MsrB3 is localized, high concentration of zinc would be expected to support MsrB3 activity.
Third, we demonstrated that the MsrB3 signal pattern in CA1 pyramidal neurons changed in hippocampi of AD patients, correlated with the burden of AD-associated NFTs in CA1, and correlated with MsrB3 signal intensity in CA3 neuropil (Figs 6, 7). These changes in MsrB3 expression may reflect or contribute to synaptic circuitry dysfunction in AD-mediated neurodegeneration. The frequency of the degenerative CA1 phenotype increased as NFTs accumulated (Fig. 6 C). Additionally, though only one AD subject was attributed a CERAD NP score of 3 (Table 1), the MsrB3-IR degenerative phenotype correlated with neuritic plaques (ST 1.4), again suggesting specific relevance for AD.
Finally, we demonstrated stronger MsrB3 signal in the vascular walls than in mitochondria and ER (see SF 3 H-J), sites of reported MsrB3 localization in vitro[7]. In ultrastructural analysis of rat hippocampus we did see MsrB3 signal in synaptic vesicles in axonal terminals close to the walls of small vessels (data not shown). Because mouse MsrB3 (~90% identical to rat) appears to target only ER and not mitochondria[8], we cannot exclude the possibility that smooth muscle, endothelial cells, and pericytes in human blood vessels do harbor mitochondrial MsrB3. The significance of decreased MsrB3-IR in the arteriolar walls in the hippocampal white matter of AD patients (Fig. 8) in the context of AD-associated hippocampal volume loss might be elucidated in future correlative studies of MRI-measured HV and the presence of low HV -associated MSRB3 risk allele. MsrB3 may influence hippocampal volume in aging, AD and neurovascular diseases, which are all associated with increased oxidative stress[25–29].
With our experimental design to study the earliest AD-associated pathological changes we could not have Group 1 true controls (no NFTs and no NPs in CA) as old as the subjects in Groups 2 and 3. Indeed, our control subjects (Group 1) are inherently younger than the subjects in Groups 2 and 3 (Material and Methods and Table 1), as pathologic AD hallmarks accumulate with age even in cognitively intact subjects. Notably, subject age did significantly correlate with the percentage of CA1 pyramidal neurons with rare somatic MsrB3-ir puncta (healthy phenotype) and the intensity of MsrB3-IR in CA3 neuropil (ST 3.1). The significantly younger Group 1 may have artificially correlated the findings with age, although we cannot rule out a role of MsrB3 in aging. However, Group 2 (age mean 91.27 ± 7.35 years) and Group 3 (age mean 89.50 ± 4.64 years) subjects while age-matched, differ significantly in the intensity of MsrB3 signal in white matter arterial walls (Fig. 8E). In addition, MsrB3-IR pattern in CA1 pyramidal neurons changes incrementally across all 3 groups (Fig. 6A, B). This argues against the findings being attributable to age alone.
In summary, our study discovered novel locations of MsrB3 protein signal, synaptic vesicles and arteriolar walls, providing venues for the MSRB3 risk allele to affect hippocampal volume in the context of AD - neuronal connectivity and arteriolar health. These indispensable morphological data from brains of healthy individuals and of those undergoing AD-associated pathological changes will inform studies in experimental models probing mechanisms of MsrB3 involvement in AD pathogenesis in search of novel therapeutic targets.
Supplementary Material
(A) MsrB3 antibody (1:40) labels somatic puncta in pyramidal neurons (arrows) in human CA1 region, and the labeling of adjacent section is blocked by incubating the antibody with 10X molar excess of the MsrB3 immunogen (B). (C) In human CA3 field, MsrB3-immunoreactivity, which highlights neuropil (asterisks) and pyramidal cytoplasm (arrows), is blocked with the immunoabsorption assay (D). (E) MsrB3 signal in leptomeningeal arteriolar walls (arrowheads) and choroid epithelium (arrows) is blocked in immunoabsorption assay as well (F). Scale bars = 50 μm.
(A) Boxes highlight three 20x fields capturing pyramidal layer of CA1 used for quantitative analysis in each section. # indicates temporal horn of the lateral ventricle. * indicates choroid plexus epithelium and vasculature, both strongly MsrB3-immunoreactive (-ir). Inset b marks 20x field shown in B. (B) Representative 20x field for CA1 image analysis. # indicates direction of ependymal surface. (C) CA1 pyramidal neurons with 1 or 2 somatic MsrB3-ir puncta were binned as “rare puncta” phenotype; CA1 pyramidal neurons with 5 or more MsrB3-ir somatic puncta were binned as “frequent puncta” phenotype in cell counts conducted in ImageJ software. Scale bar A = 600 μm, B = 50 μm, C = 25 μm.
IHC on consecutive sections identified overlapping IR for MTC02, MsrB3, and Calregulin in CA1 (A, B-D) and CA3 (A, E-G); the same cells in adjacent sections are indicated with same type of arrowheads. MsrB3-IR patterns changed from CA1 (somatic puncta, C) to CA3 (diffuse somatic (arrowheads) and patchy neuropil (asterisks) signals, F), while mitochondrial and ER marker (MTC02 B, E and Calregulin D, G) IR patterns were rather consistent. While antibodies for MTC02, MsrB3, and Calregulin show considerably overlapping signals in the cytoplasm of the choroid plexus epithelium (arrows), MsrB3 signal in blood vessel (BV) walls (asterisks) is more intense (H-J). Scale bar A = 200 μm, D,G = 50 μm, J = 40 μm.
In CA1 MsrB3-immunoreactive somatic puncta (arrows) were visualized away from Vesicle associated membrane protein 2 (VAMP2)- (A) highlighted cell contours. Vesicular glutamate transporter type 1 (VGLUT1) signal was weak in CA1 and did not overlap with MsrB3-immunoreactive somatic puncta (B, arrows). Scale bars = 30 μm.
Acknowledgments
We thank Terri Lima, Emily Aniskovich, and Cheryl Spencer for expert immunohistochemistry advice and assistance, Dr. Joel Henderson for the use of imaging equipment, Dr. Rebecca Canter, Dr. Christina Tognoni, and David Cawston for assistance with animal studies, Kerry Cormier of Framingham Heart Study Brain Bank and Michiel Kooreman of Netherlands Brain Bank for specimen procurement, and Dr. Zhigang Xie for careful reading of the manuscript. This work is supported by the National Institutes of Health, National Institute on Aging grants R01 AG033193 (SLA, ID, SS, JJH), AG049505 (SS, JJH), AG008122 (SS, JJH), AG054076 (SS, JJH), AG045031 (SLA, ID, JKB). The Framingham Heart Study is supported by the National Heart, Lung, and Blood Institute (contract no. N01-HC-25195 and no. HHSN268201500001I).
Funding: This work is supported by the National Institutes of Health, National Institute on Aging grants R01 AG033193 (SLA, ID, SS, JJH), AG049505 (SS, JJH), AG008122 (SS, JJH), AG054076 (SS, JJH), AG045031 (SLA, ID, JKB). The Framingham Heart Study is supported by the National Heart, Lung, and Blood Institute (contract no. N01-HC-25195 and no. HHSN268201500001I).
Footnotes
Author’s contributions: SLA and ID made substantial contributions to design of experiments, data collection and analysis. SLA and LB made substantial contributions to statistical analyses and method descriptions. KT, SLA performed IHC experiments to characterize MsrB3 IHC expression in human hippocampus. LB, OC made substantial contributions to data collection of human IHC measures. JJH contributed to acquisition of human subject materials and data interpretation. JKB made substantial contributions to animal studies and critical manuscript revisions. ID and SS conceived the study. ID and SLA prepared the manuscript. ID coordinated the study. The authors give approval for the manuscript to be published and agree to be accountable for all aspects of the work.
Consent for publication: The authors give approval for the manuscript to be published and agree to be accountable for all aspects of the work.
The authors have no conflicts of interest to report.
References
- 1.Ridha BH, Barnes J, Bartlett JW, Godbolt A, Pepple T, Rossor MN, Fox NC. Tracking atrophy progression in familial Alzheimer’s disease: a serial MRI study. Lancet Neurol. 2006;5:828–834. doi: 10.1016/S1474-4422(06)70550-6. [DOI] [PubMed] [Google Scholar]
- 2.Small GW. Use of neuroimaging to detect early brain changes in people at genetic risk for Alzheimer’s disease. Adv Drug Deliv Rev. 2002;54:1561–1566. doi: 10.1016/s0169-409x(02)00151-5. [DOI] [PubMed] [Google Scholar]
- 3.den Heijer T, Vermeer SE, van Dijk EJ, Prins ND, Koudstaal PJ, Hofman A, Breteler MM. Type 2 diabetes and atrophy of medial temporal lobe structures on brain MRI. Diabetologia. 2003;46:1604–1610. doi: 10.1007/s00125-003-1235-0. [DOI] [PubMed] [Google Scholar]
- 4.Seshadri S, Wolf PA, Beiser AS, Selhub J, Au R, Jacques PF, Yoshita M, Rosenberg IH, D’Agostino RB, DeCarli C. Association of plasma total homocysteine levels with subclinical brain injury: cerebral volumes, white matter hyperintensity, and silent brain infarcts at volumetric magnetic resonance imaging in the Framingham Offspring Study. Arch Neurol. 2008;65:642–649. doi: 10.1001/archneur.65.5.642. [DOI] [PMC free article] [PubMed] [Google Scholar]
- 5.Sullivan EV, Pfefferbaum A, Swan GE, Carmelli D. Heritability of hippocampal size in elderly twin men: equivalent influence from genes and environment. Hippocampus. 2001;11:754–762. doi: 10.1002/hipo.1091. [DOI] [PubMed] [Google Scholar]
- 6.Hibar DP, Adams HH, Jahanshad N, Chauhan G, Stein JL, Hofer E, Renteria ME, Bis JC, Arias-Vasquez A, Ikram MK, Desrivieres S, Vernooij MW, Abramovic L, Alhusaini S, Amin N, Andersson M, Arfanakis K, Aribisala BS, Armstrong NJ, Athanasiu L, Axelsson T, Beecham AH, Beiser A, Bernard M, Blanton SH, Bohlken MM, Boks MP, Bralten J, Brickman AM, Carmichael O, Chakravarty MM, Chen Q, Ching CR, Chouraki V, Cuellar-Partida G, Crivello F, Den Braber A, Doan NT, Ehrlich S, Giddaluru S, Goldman AL, Gottesman RF, Grimm O, Griswold ME, Guadalupe T, Gutman BA, Hass J, Haukvik UK, Hoehn D, Holmes AJ, Hoogman M, Janowitz D, Jia T, Jorgensen KN, Karbalai N, Kasperaviciute D, Kim S, Klein M, Kraemer B, Lee PH, Liewald DC, Lopez LM, Luciano M, Macare C, Marquand AF, Matarin M, Mather KA, Mattheisen M, McKay DR, Milaneschi Y, Munoz Maniega S, Nho K, Nugent AC, Nyquist P, Loohuis LM, Oosterlaan J, Papmeyer M, Pirpamer L, Putz B, Ramasamy A, Richards JS, Risacher SL, Roiz-Santianez R, Rommelse N, Ropele S, Rose EJ, Royle NA, Rundek T, Samann PG, Saremi A, Satizabal CL, Schmaal L, Schork AJ, Shen L, Shin J, Shumskaya E, Smith AV, Sprooten E, Strike LT, Teumer A, Tordesillas-Gutierrez D, Toro R, Trabzuni D, Trompet S, Vaidya D, Van der Grond J, Van der Lee SJ, Van der Meer D, Van Donkelaar MM, Van Eijk KR, Van Erp TG, Van Rooij D, Walton E, Westlye LT, Whelan CD, Windham BG, Winkler AM, Wittfeld K, Woldehawariat G, Wolf C, Wolfers T, Yanek LR, Yang J, Zijdenbos A, Zwiers MP, Agartz I, Almasy L, Ames D, Amouyel P, Andreassen OA, Arepalli S, Assareh AA, Barral S, Bastin ME, Becker DM, Becker JT, Bennett DA, Blangero J, van Bokhoven H, Boomsma DI, Brodaty H, Brouwer RM, Brunner HG, Buckner RL, Buitelaar JK, Bulayeva KB, Cahn W, Calhoun VD, Cannon DM, Cavalleri GL, Cheng CY, Cichon S, Cookson MR, Corvin A, Crespo-Facorro B, Curran JE, Czisch M, Dale AM, Davies GE, De Craen AJ, De Geus EJ, De Jager PL, De Zubicaray GI, Deary IJ, Debette S, DeCarli C, Delanty N, Depondt C, DeStefano A, Dillman A, Djurovic S, Donohoe G, Drevets WC, Duggirala R, Dyer TD, Enzinger C, Erk S, Espeseth T, Fedko IO, Fernandez G, Ferrucci L, Fisher SE, Fleischman DA, Ford I, Fornage M, Foroud TM, Fox PT, Francks C, Fukunaga M, Gibbs JR, Glahn DC, Gollub RL, Goring HH, Green RC, Gruber O, Gudnason V, Guelfi S, Haberg AK, Hansell NK, Hardy J, Hartman CA, Hashimoto R, Hegenscheid K, Heinz A, Le Hellard S, Hernandez DG, Heslenfeld DJ, Ho BC, Hoekstra PJ, Hoffmann W, Hofman A, Holsboer F, Homuth G, Hosten N, Hottenga JJ, Huentelman M, Pol HE, Ikeda M, Jack CR, Jr, Jenkinson M, Johnson R, Jonsson EG, Jukema JW, Kahn RS, Kanai R, Kloszewska I, Knopman DS, Kochunov P, Kwok JB, Lawrie SM, Lemaitre H, Liu X, Longo DL, Lopez OL, Lovestone S, Martinez O, Martinot JL, Mattay VS, McDonald C, McIntosh AM, McMahon FJ, McMahon KL, Mecocci P, Melle I, Meyer-Lindenberg A, Mohnke S, Montgomery GW, Morris DW, Mosley TH, Muhleisen TW, Muller-Myhsok B, Nalls MA, Nauck M, Nichols TE, Niessen WJ, Nothen MM, Nyberg L, Ohi K, Olvera RL, Ophoff RA, Pandolfo M, Paus T, Pausova Z, Penninx BW, Pike GB, Potkin SG, Psaty BM, Reppermund S, Rietschel M, Roffman JL, Romanczuk-Seiferth N, Rotter JI, Ryten M, Sacco RL, Sachdev PS, Saykin AJ, Schmidt R, Schmidt H, Schofield PR, Sigursson S, Simmons A, Singleton A, Sisodiya SM, Smith C, Smoller JW, Soininen H, Steen VM, Stott DJ, Sussmann JE, Thalamuthu A, Toga AW, Traynor BJ, Troncoso J, Tsolaki M, Tzourio C, Uitterlinden AG, Hernandez MC, Van der Brug M, van der Lugt A, van der Wee NJ, Van Haren NE, van ’t Ent D, Van Tol MJ, Vardarajan BN, Vellas B, Veltman DJ, Volzke H, Walter H, Wardlaw JM, Wassink TH, Weale ME, Weinberger DR, Weiner MW, Wen W, Westman E, White T, Wong TY, Wright CB, Zielke RH, Zonderman AB, Martin NG, Van Duijn CM, Wright MJ, Longstreth WT, Schumann G, Grabe HJ, Franke B, Launer LJ, Medland SE, Seshadri S, Thompson PM, Ikram MA. Novel genetic loci associated with hippocampal volume. Nat Commun. 2017;8:13624. doi: 10.1038/ncomms13624. [DOI] [PMC free article] [PubMed] [Google Scholar]
- 7.Kim HY, Gladyshev VN. Methionine sulfoxide reduction in mammals: characterization of methionine-R-sulfoxide reductases. Mol Biol Cell. 2004;15:1055–1064. doi: 10.1091/mbc.E03-08-0629. [DOI] [PMC free article] [PubMed] [Google Scholar]
- 8.Kim HY, Gladyshev VN. Characterization of mouse endoplasmic reticulum methionine-R-sulfoxide reductase. Biochem Biophys Res Commun. 2004;320:1277–1283. doi: 10.1016/j.bbrc.2004.06.078. [DOI] [PubMed] [Google Scholar]
- 9.Blessed G, Tomlinson BE, Roth M. The association between quantitative measures of dementia and of senile change in the cerebral grey matter of elderly subjects. Br J Psychiatry. 1968;114:797–811. doi: 10.1192/bjp.114.512.797. [DOI] [PubMed] [Google Scholar]
- 10.Hachinski VC, Iliff LD, Zilhka E, Du Boulay GH, McAllister VL, Marshall J, Russell RW, Symon L. Cerebral blood flow in dementia. Arch Neurol. 1975;32:632–637. doi: 10.1001/archneur.1975.00490510088009. [DOI] [PubMed] [Google Scholar]
- 11.Davis PB, White H, Price JL, McKeel D, Robins LN. Retrospective postmortem dementia assessment. Validation of a new clinical interview to assist neuropathologic study. Arch Neurol. 1991;48:613–617. doi: 10.1001/archneur.1991.00530180069019. [DOI] [PubMed] [Google Scholar]
- 12.Braak H, Braak E. Neuropathological stageing of Alzheimer-related changes. Acta Neuropathol. 1991;82:239–259. doi: 10.1007/BF00308809. [DOI] [PubMed] [Google Scholar]
- 13.Au R, Seshadri S, Knox K, Beiser A, Himali JJ, Cabral HJ, Auerbach S, Green RC, Wolf PA, McKee AC. The Framingham Brain Donation Program: neuropathology along the cognitive continuum. Curr Alzheimer Res. 2012;9:673–686. doi: 10.2174/156720512801322609. [DOI] [PMC free article] [PubMed] [Google Scholar]
- 14.Crary JF, Trojanowski JQ, Schneider JA, Abisambra JF, Abner EL, Alafuzoff I, Arnold SE, Attems J, Beach TG, Bigio EH, Cairns NJ, Dickson DW, Gearing M, Grinberg LT, Hof PR, Hyman BT, Jellinger K, Jicha GA, Kovacs GG, Knopman DS, Kofler J, Kukull WA, Mackenzie IR, Masliah E, McKee A, Montine TJ, Murray ME, Neltner JH, Santa-Maria I, Seeley WW, Serrano-Pozo A, Shelanski ML, Stein T, Takao M, Thal DR, Toledo JB, Troncoso JC, Vonsattel JP, White CL, 3rd, Wisniewski T, Woltjer RL, Yamada M, Nelson PT. Primary age-related tauopathy (PART): a common pathology associated with human aging. Acta Neuropathol. 2014;128:755–766. doi: 10.1007/s00401-014-1349-0. [DOI] [PMC free article] [PubMed] [Google Scholar]
- 15.Ahmed ZM, Yousaf R, Lee BC, Khan SN, Lee S, Lee K, Husnain T, Rehman AU, Bonneux S, Ansar M, Ahmad W, Leal SM, Gladyshev VN, Belyantseva IA, Van Camp G, Riazuddin S, Friedman TB, Riazuddin S. Functional null mutations of MSRB3 encoding methionine sulfoxide reductase are associated with human deafness DFNB74. Am J Hum Genet. 2011;88:19–29. doi: 10.1016/j.ajhg.2010.11.010. [DOI] [PMC free article] [PubMed] [Google Scholar]
- 16.Preibisch S, Saalfeld S, Tomancak P. Globally optimal stitching of tiled 3D microscopic image acquisitions. Bioinformatics. 2009;25:1463–1465. doi: 10.1093/bioinformatics/btp184. [DOI] [PMC free article] [PubMed] [Google Scholar]
- 17.Baschong W, Suetterlin R, Laeng RH. Control of autofluorescence of archival formaldehyde-fixed, paraffin-embedded tissue in confocal laser scanning microscopy (CLSM) J Histochem Cytochem. 2001;49:1565–1572. doi: 10.1177/002215540104901210. [DOI] [PubMed] [Google Scholar]
- 18.Xiong G, Zhang L, Mojsilovic-Petrovic J, Arroyo E, Elkind J, Kundu S, Johnson B, Smith CJ, Cohen NA, Grady SM, Cohen AS. GABA and glutamate are not colocalized in mossy fiber terminals of developing rodent hippocampus. Brain Res. 2012;1474:40–49. doi: 10.1016/j.brainres.2012.07.042. [DOI] [PMC free article] [PubMed] [Google Scholar]
- 19.Henze DA, Urban NN, Barrionuevo G. The multifarious hippocampal mossy fiber pathway: a review. Neuroscience. 2000;98:407–427. doi: 10.1016/s0306-4522(00)00146-9. [DOI] [PubMed] [Google Scholar]
- 20.Kerti-Szigeti K, Nusser Z. Similar GABAA receptor subunit composition in somatic and axon initial segment synapses of hippocampal pyramidal cells. Elife. 2016;5 doi: 10.7554/eLife.18426. [DOI] [PMC free article] [PubMed] [Google Scholar]
- 21.Lushnikova I, Skibo G, Muller D, Nikonenko I. Excitatory synaptic activity is associated with a rapid structural plasticity of inhibitory synapses on hippocampal CA1 pyramidal cells. Neuropharmacology. 2011;60:757–764. doi: 10.1016/j.neuropharm.2010.12.014. [DOI] [PubMed] [Google Scholar]
- 22.Wenzel HJ, Cole TB, Born DE, Schwartzkroin PA, Palmiter RD. Ultrastructural localization of zinc transporter-3 (ZnT-3) to synaptic vesicle membranes within mossy fiber boutons in the hippocampus of mouse and monkey. Proc Natl Acad Sci U S A. 1997;94:12676–12681. doi: 10.1073/pnas.94.23.12676. [DOI] [PMC free article] [PubMed] [Google Scholar]
- 23.Slomianka L. Neurons of origin of zinc-containing pathways and the distribution of zinc-containing boutons in the hippocampal region of the rat. Neuroscience. 1992;48:325–352. doi: 10.1016/0306-4522(92)90494-m. [DOI] [PubMed] [Google Scholar]
- 24.Kumar RA, Koc A, Cerny RL, Gladyshev VN. Reaction mechanism, evolutionary analysis, and role of zinc in Drosophila methionine-R-sulfoxide reductase. J Biol Chem. 2002;277:37527–37535. doi: 10.1074/jbc.M203496200. [DOI] [PubMed] [Google Scholar]
- 25.Scheff SW, Ansari MA, Mufson EJ. Oxidative stress and hippocampal synaptic protein levels in elderly cognitively intact individuals with Alzheimer’s disease pathology. Neurobiol Aging. 2016;42:1–12. doi: 10.1016/j.neurobiolaging.2016.02.030. [DOI] [PMC free article] [PubMed] [Google Scholar]
- 26.Nunomura A, Perry G, Aliev G, Hirai K, Takeda A, Balraj EK, Jones PK, Ghanbari H, Wataya T, Shimohama S, Chiba S, Atwood CS, Petersen RB, Smith MA. Oxidative damage is the earliest event in Alzheimer disease. J Neuropathol Exp Neurol. 2001;60:759–767. doi: 10.1093/jnen/60.8.759. [DOI] [PubMed] [Google Scholar]
- 27.Pratico D, Clark CM, Liun F, Rokach J, Lee VY, Trojanowski JQ. Increase of brain oxidative stress in mild cognitive impairment: a possible predictor of Alzheimer disease. Arch Neurol. 2002;59:972–976. doi: 10.1001/archneur.59.6.972. [DOI] [PubMed] [Google Scholar]
- 28.Chehaibi K, Trabelsi I, Mahdouani K, Slimane MN. Correlation of Oxidative Stress Parameters and Inflammatory Markers in Ischemic Stroke Patients. J Stroke Cerebrovasc Dis. 2016;25:2585–2593. doi: 10.1016/j.jstrokecerebrovasdis.2016.06.042. [DOI] [PubMed] [Google Scholar]
- 29.Nunomura A, Moreira PI, Castellani RJ, Lee HG, Zhu X, Smith MA, Perry G. Oxidative damage to RNA in aging and neurodegenerative disorders. Neurotox Res. 2012;22:231–248. doi: 10.1007/s12640-012-9331-x. [DOI] [PubMed] [Google Scholar]
Associated Data
This section collects any data citations, data availability statements, or supplementary materials included in this article.
Supplementary Materials
(A) MsrB3 antibody (1:40) labels somatic puncta in pyramidal neurons (arrows) in human CA1 region, and the labeling of adjacent section is blocked by incubating the antibody with 10X molar excess of the MsrB3 immunogen (B). (C) In human CA3 field, MsrB3-immunoreactivity, which highlights neuropil (asterisks) and pyramidal cytoplasm (arrows), is blocked with the immunoabsorption assay (D). (E) MsrB3 signal in leptomeningeal arteriolar walls (arrowheads) and choroid epithelium (arrows) is blocked in immunoabsorption assay as well (F). Scale bars = 50 μm.
(A) Boxes highlight three 20x fields capturing pyramidal layer of CA1 used for quantitative analysis in each section. # indicates temporal horn of the lateral ventricle. * indicates choroid plexus epithelium and vasculature, both strongly MsrB3-immunoreactive (-ir). Inset b marks 20x field shown in B. (B) Representative 20x field for CA1 image analysis. # indicates direction of ependymal surface. (C) CA1 pyramidal neurons with 1 or 2 somatic MsrB3-ir puncta were binned as “rare puncta” phenotype; CA1 pyramidal neurons with 5 or more MsrB3-ir somatic puncta were binned as “frequent puncta” phenotype in cell counts conducted in ImageJ software. Scale bar A = 600 μm, B = 50 μm, C = 25 μm.
IHC on consecutive sections identified overlapping IR for MTC02, MsrB3, and Calregulin in CA1 (A, B-D) and CA3 (A, E-G); the same cells in adjacent sections are indicated with same type of arrowheads. MsrB3-IR patterns changed from CA1 (somatic puncta, C) to CA3 (diffuse somatic (arrowheads) and patchy neuropil (asterisks) signals, F), while mitochondrial and ER marker (MTC02 B, E and Calregulin D, G) IR patterns were rather consistent. While antibodies for MTC02, MsrB3, and Calregulin show considerably overlapping signals in the cytoplasm of the choroid plexus epithelium (arrows), MsrB3 signal in blood vessel (BV) walls (asterisks) is more intense (H-J). Scale bar A = 200 μm, D,G = 50 μm, J = 40 μm.
In CA1 MsrB3-immunoreactive somatic puncta (arrows) were visualized away from Vesicle associated membrane protein 2 (VAMP2)- (A) highlighted cell contours. Vesicular glutamate transporter type 1 (VGLUT1) signal was weak in CA1 and did not overlap with MsrB3-immunoreactive somatic puncta (B, arrows). Scale bars = 30 μm.