

Abstract
Loop-mediated isothermal amplification (LAMP), coupled with reverse transcription (RT), has become a popular technique for detection of viral RNA due to several desirable characteristics for use in point-of-care or low-resource settings. The large number of primers in LAMP (six per target) leads to an increased likelihood of primer dimer interactions, and the inner primers in particular are prone to formation of stable hairpin structures due to their length (typically 40–45 bases). Although primer dimers and hairpin structures are known features to avoid in nucleic acid amplification techniques, there is little quantitative information in literature regarding the impact of these structures on LAMP or RT-LAMP assays. In this study, we examine the impact of primer dimers and hairpins on previously-published primer sets for dengue virus and yellow fever virus. We demonstrate that minor changes to the primers to eliminate amplifiable primer dimers and hairpins improves the performance of the assays when monitored in real time with intercalating dyes, and when monitoring a fluorescent endpoint using the QUASR technique. We also discuss the thermodynamic implications of these minor changes on the overall stability of amplifiable secondary structures, and we present a single thermodynamic parameter that can be correlated to the probability of non-specific amplification associated with LAMP primers.
Graphical abstract
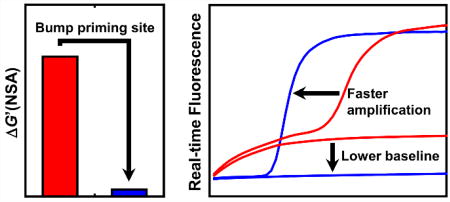
Bumping the priming sites for RT-LAMP based on thermodynamic predictions can dramatically reduce non-specific background amplification.
Introduction
The related techniques of LAMP1 and RT-LAMP2 are popular as an isothermal “PCR alternative” for molecular diagnostics, due to the relative simplicity of assay, and the high tolerance of the assay to crude samples3–5. As an isothermal technique, the power requirement for LAMP is lower than for PCR, and the tolerance to substances that inhibit PCR allows LAMP to be carried out with simplified sample prep. The technique synthesizes a large amount of double-stranded DNA amplicon, which allows amplification to be detected using a variety of simple visual techniques, including turbidity, color change indicators, or fluorescent dyes that track total DNA synthesis6–10. In addition, we and others have demonstrated target specific or probe-based detection schemes11–17, including the QUASR technique that relies upon interaction between a dye-labeled primer and a short quenching probe to give rise to bright, high-contrast endpoint signals in closed-tube reactions.
One of the drawbacks of the LAMP technique is the high complexity of primer design relative to PCR. Instead of a discrete amplicon bounded by a forward and reverse primer, LAMP features 4–6 primers targeting 6–8 separate regions. The large number of primers increases the likelihood of primer dimers. Two of the primers, the forward and backward inner primers (FIP and BIP) are composite primers complementary to two regions of the target; lengths of 40–45 bases are common. These long primers in particular are prone to formation of hairpin structures. While primer dimers and hairpins are known issues to avoid in any molecular diagnostic assay, it is not always clear what degree of dimerization or hairpin formation is problematic, nor is it clear from published literature what effect these structures have on LAMP assays.
We have observed that some LAMP primer sets display a slowly rising baseline when monitored in real time with LAMP-compatible fluorescent dyes such as SYTO 9 or SYTO 829, 11, 18. We hypothesize that this phenomenon is related to the formation of amplifiable primer dimers and hairpin structures, which in the presence of DNA polymerase leads to formation of double-stranded extension products, and also depletes the primers. The formation of double-stranded primer extension products leads to a fluorescent background, and contributes to poorer discrimination between positive and negative reactions when monitoring total DNA synthesis. The sequestration of primers into double-stranded products also reduces the efficiency of the assay by lowering the effective primer concentration, which in turn impacts the speed and potentially the sensitivity of the assay. In our previous work with LAMP, we have occasionally found published primer sets that display this phenomenon of a rising baseline. For example, in our group’s previous work, primers that we designed for Western equine encephalitis virus displayed a rising baseline, whereas primers we designed for St. Louis encephalitis virus using the same software and similar screening criteria did not19. This indicates to us that common primer design protocols are not sufficiently rigorous in screening out these structures. Note we consider this to be a separate phenomenon from the occasional “spontaneous amplification” (i.e. exponential amplification in no-template control reactions) that occurs sporadically with some LAMP primer sets, which anecdotal evidence suggests can arise from more complex interactions involving multiple primers, even in cases where amplicon contamination can be ruled out.
Some degree of hairpin formation in the FIP and BIP primers are not uncommon, and this may not always be a problem in LAMP. Particularly stable hairpin structures may have the effect of sequestering some fraction of the primer in an inactive form, but this does not necessarily lead to failure of the reaction, unless the hairpin happens to have a 3’ complementarity, which can form a self-amplifying structure. In the process of translating LAMP primer sets to the QUASR technique, we have found, however, that even primers with hairpins that have complementarity one or two bases away from the 3’ end can still self-amplify.
We present below a simple study demonstrating the impact of primer dimers, and the elimination thereof, on real-time monitoring of previously published primer sets for RT-LAMP detection of yellow fever virus (YFV)20 and dengue virus (DENV) serotypes 2 and 421. We also demonstrate that an unexpected self-amplifying hairpin required additional primer modifications to translate the QUASR technique for DENV serotypes 1 and 3. In each case, we applied the nearest-neighbor model to estimate the stability of all possible secondary structures of both the original and modified primers. Using the resulting stability parameters, we compute a single parameter that can be correlated to the probability of non-specific amplification for the original and modified primers.
Materials and Methods
RNA from Yellow Fever virus (YFV) 17D vaccine strain (Genbank: JX949181) was obtained from Dr. Lark Coffey at University of California-Davis, as described previously19. The YFV virus was quantified by plaque assay, and copy number was established by RT-qPCR, with comparison to a YFV standard obtained from ATCC, using a previously-described TaqMan primer/probe set targeting the NS5 region of the viral genome22. RNA from Dengue virus (DENV) serotypes 1–4 was prepared with Trizol reagent (Invitrogen) lysates from C636 cells infected by DENV at 3 day post infection. RNA samples were extracted according to manufacturer’s protocol and further purified using RNeasy kit (Qiagen). The following prototype strains were used: DENV1 Hawaii 1944 (Genbank: EU848545); DENV2 New Guinea C (Genbank: KM204118); DENV3 H87 (Genbank: KU050695); DENV4 H241 (Genbank: KR011349). DENV RNA was quantified by RT-qPCR using a previously-described pan-dengue TaqMan primer/probe set23. As standards we used quantitated RNA samples of DENV1 Hawaii 1944 and DENV4 H241 obtained from BEI Resources to generate standard curves (DENV2 and DENV3 were quantitated using the DENV1 standard curve, due to identical priming sites in the RT-qPCR assay). RT-qPCR quantitation was performed using the Luna Universal One-Step RT-qPCR Kit (New England Biolabs) following the manufacturer’s recommended protocol. RNA from Ebola virus (Mayinga strain) was obtained from BEI Resources.
Viral sequences for alignments were obtained from Genbank. Whole-genome alignments were performed using Muscle24, and visualized with Clustal X225. Hairpin analysis was performed using the mFold tool available from Integrated DNA Technologies (www.idtdna.com, Coralville, IA). Multiple primer dimer analysis was performed using the Multiple Prime Analyzer tool available online from Thermo Fisher.
RT-LAMP primers are based on sets for YFV and DENV originally published by other authors20, 21. A complete list of RT-LAMP primer sequences with our modifications is presented in supplementary information (Tables S1 and S2). All primers were synthesized by Integrated DNA Technologies. Unless otherwise stated, our standard reaction mixture for RT-LAMP comprised: 1× Isothermal amplification buffer (New England Biolabs) supplemented with MgSO4 to a final concentration of 8 mM Mg++; 1.4 mM each dNTP; 0.8 M betaine; primers (0.2 µM each F3 and B3; 1.6 µM each FIP and BIP; and 0.8 µM each LoopF and LoopB); 3.2 units Bst 2.0 WarmStart DNA polymerase (New England Biolabs) and 2.0 units of AMV Reverse Transcriptase (Life Science Advanced Technologies), and 1–2 µM of a LAMP-compatible intercalating dye (SYTO 9, SYTO 82, or SYTO 62, Thermo Fisher) in a 10 µL total reaction volume. All RT-LAMP assays were incubated at a temperature of 63 °C. Real-time monitoring of RT-LAMP reactions were performed using a Bio-Rad CFX 96 real-time PCR instrument, using the FAM, HEX, or Cy5 channels to monitor SYTO 9, SYTO 82, or SYTO 62 respectively. QUASR reaction endpoints were also monitored using the CFX 96 in the appropriate dye channel. Reactions utilizing QUASR were also supplemented with a 1.5× concentration of the appropriate quencher (e.g. 2.4 µM of a quencher corresponding to a dye-labeled BIP; 1.2 µM of quencher corresponding to a dye-labeled Loop primer; cf. Ball 2016). Endpoint images of QUASR reactions were captured using a ProteinSimple fluorescent gel imager. The operational scheme of QUASR has been discussed in detail before11 but briefly, we label one of the inner or loop primers with a fluorescent probe. A complementary shorter sequence with a quencher is introduced to the reaction to quench all the unincorporated labeled primers after the RT-LAMP. If the reaction mix contained the target sequence, the incorporated labeled primers are protected from quenching the end of the reaction, producing a bright fluorescent signal in the emission channel.
Thermodynamic calculations of stability of amplifiable secondary structures
The stability of base pair interactions in nucleic acid hybridization process strongly depends on the identity and orientation of neighboring base pairs. The nearest-neighbor (NN) model for nucleic acid thermodynamics has been successfully applied to predict the stability of secondary structures of DNA/RNA26, 27. The model estimates the change in Gibbs free energy (ΔG) of nucleic acid hybridization as a summation over the resulting base pair and adjacent base pair stacks, by using the nucleic acid stability matrix (consisting of 10 nearest-neighbor base pair energies). A similar stability matrix can be used to calculate the free energies of nucleic acid pairs with mismatches28. These energies include major molecular interactions such as stacking, hydrogen bonding, electrostatic interactions and configurational entropy loss and can be calculated by using the following expression:
Where ΔGhyb is the Gibbs free energy change of hybridization arising due to Watson–Crick base pairing, nucleotide mismatches, bulges, stem loop structures etc. ΔGinitiation is the change in Gibbs free energy to account for the differences between duplexes with terminal A-T vs terminal G-C pairs. i, j represent numbers ranging from 1 to 4 representing nucleic acid bases A, T, G and C. ΔG(NiNj/ N`iN`j) represents the standard free energy changes for possible nearest-neighbor pairs and ni,j is the number of occurrences of each nearest-neighbor pair (i,j). These ΔGhyb values were then used to calculate the stability of primer-target bond (primer binding to its perfect complementary strand on the target template), primer hairpin bonds (self-hybridized loop structures) and primer dimers.
In order to determine the likelihood of a primer sequence binding to the template strand, which undergoes extension reaction, we first need to calculate the Gibbs free energy change of the primer undergoing non-specific amplification via hairpin and dimer structures. For these calculations, we are counting the contributions of the individual primer interacting with itself (as either a hairpin or primer-dimer) and other primers. This allows us to isolate the effect of the minor changes made to the individual primer on amplification probabilities due to unfavorable interactions. An amplifiable secondary structure is defined as a secondary structure with at least 2 hybridized bonds on the 3’ end of the secondary structure. We assume that the stability of secondary structures has contributions from all hairpin and dimer structures. We can then normalize the Gibbs free energy contributions due to nonspecific amplification by the Gibbs free energy of perfect binding of the primer with its complimentary strand. This normalized ΔG’ can now be used as a figure of merit to determine the likelihood of a given primer set to exhibit nonspecific amplification. The Gibbs free energy change can also be related to a Boltzmann distribution based probability function (i.e. log(P) ∝ ΔG’(NSA)). Our analysis results in singular deterministic ΔG’(NSA) values. With this analysis we can calculate the contribution to ΔG’(NSA) due to individual primer self-interaction (minimum interaction case) and the global contribution of all primer interactions (max interaction case). An archive containing the MATLAB and C source files for performing this calculation is provided as supplementary information.
Results
Yellow fever virus primer dimers
We present first results from an RT-LAMP primer set targeting the NS1 region of YFV, published by Kwallah et al20, which we adapted to QUASR by labeling the forward Loop primer with Cy3. We observed that this primer set features a prominent elevated baseline when monitored by the intercalating dye SYTO 9. This was likely not evident to the original authors, in which the primer set was characterized by real-time turbidity monitoring, which may be less sensitive to low-level DNA synthesis than the intercalating dye. Upon checking the primer set with a multiple primer analyzer, we noticed that the FIP primer self-dimerizes across much of the F2 region with only two single-base gaps (Figure 1). With 4 bases of complementarity at the 3’ end, we expected this primer dimer to be readily extendible. To “rescue” this primer set, we “bump” the F2 region by 8 bases in the 5’ direction along the template, which eliminates the extendible self-dimer. The resultant modified set has significantly lower initial baseline and reduced background amplification, and faster time to positivity at the same concentration of template. The difference in baseline and time to positivity for the original and modified primers can be observed in the real-time amplification curves for YFV shown in Figure 2A. We note that the baseline starts at a higher level with the original primers compared to the modified primers, which could be due to a combination of significant base pairing of the FIP primer-dimer at the reaction temperature, and to substantial self-extension of the FIP primer-dimer during the initial temperature ramp prior to the first plate read step. The complete modified set is listed in Supplementary Table S1, including an option for QUASR endpoint detection achieved by labeling the forward loop primer.
Figure 1.

Predicted structures of amplifiable primer dimers and hairpin addressed in this study.
Figure 2.

Experimental real-time amplification curves showing the effect of FIP primer modifications to reduce the impact of primer dimer amplification for (A) YFV, (B) DENV2 and (C) DENV4. For each target, amplification curves are shown for the original primer set (red), or the primer set with modified FIP (blue). For each primer set, the experiments depict an equal number of no-template controls and positive controls, with the following amounts of viral RNA added as template. YFV: 7000 genome copies, n = 6; DENV2, 1100 genome copies, n = 3; DENV4, 1100 genome copies, n = 3. The graphs below the real-time curves show the Gibbs free energy change due to non-specific amplification (ΔG’(NSA)) for the original and modified primers, calculated considering either just the FIP primer (solid color bars) or all primers (hatched bars).
We applied the thermodynamic methods described above to compute ΔGhyb values of primer dimers and secondary structures, as well as to non-specific amplification. Supplementary Table S3 lists these parameters for the YFV, DENV2 and DENV4 FIP primers (Individual ΔGhyb values of secondary structures not shown). The ΔG’(NSA), proportional to the log of probability of non-specific amplification, is plotted in Figure 2, below the real-time curves. The parameter is calculated for just the FIP primer, or for the entire set. The modification to the FIP primer dramatically reduces this parameter both for the individual primer and for the complete set, corresponding with the reduction in background DNA synthesis.
To test whether the modification affected the limit of detection, we tested each primer set with 10 replicate reactions each at 4 template concentrations around the expected limit of detection (a 2-fold dilution series starting at 1 PFU = 700 genome copies per reaction). The results, summarized in Table 1, indicate that the modified primer set had improved probability of detection at low target concentrations, with approximately 50% probability of detection in the range of 90 to 350 template copies, compared to only 2 (of 30) positives within the same concentration range for the original primers. In addition, the reactions that became positive for the modified primer set (across all template concentrations) were significantly faster than the few reactions that became positive for the unmodified primer set (p = 0.016, t-test, two-tailed distribution).
Table 1.
Comparison of performance for YFV primers for replicate reactions at two-fold dilutions near the expected limit of detection (700 copies = 1 PFU).
| YFV copy number |
Original YFV NS1 primers | YFV NS1 Primers + modified FIP | ||
|---|---|---|---|---|
| Positive detection |
Times (min) | Positive detection |
Mean time (min) |
|
| 700 | 2 / 10 | 40, 53 | 8 / 10 | 16 ± 2 |
| 350 | 2 / 10 | 31, 36 | 5 / 10 | 17 ± 3 |
| 180 | 0 / 10 | N/A | 6 / 10 | 17 ± 2 |
| 90 | 0 / 10 | N/A | 5 / 10 | 17 ± 2 |
The original and new location of the F2 region is shown in Supplementary Figure S1, on a sequence alignment that includes representatives of seven main lineages of YFV29. To compensate for the lower GC content resulting from this “bump”, we added several bases at the 5’ end of the F2 region. In this case, we are limited by how far we can “bump” the F2 region by the location of the nearby F3 and LoopF regions; moving the F2 region further would require disrupting these primers. We note from the sequence alignment that the NS1 region is not completely conserved across all lineages of YFV, but the newly modified F2 is likely still good for the West African lineage (which includes the 17D vaccine strain that we used as our model for testing). We note that another study reports an RT-LAMP assay for the NS1 region of YFV, using degenerate primers to achieve broader coverage across multiple lineages including South American strains30.
Dengue virus primer dimers
Next, we present a case that we encountered when trying to develop a pan-serotype QUASR assay for dengue virus. The assay described by Lau et al targets the highly conserved 3’-untranslated region (3’-UTR) of DENV21, and utilizes four sets of primers, nominally one set for each serotype of DENV, which can be combined into a single mixture for pan-serotype detection of dengue. The individual sets are not entirely serotype-specific, due to significant similarity of some of the priming sites across serotypes. In the original publication, the reaction was monitored with a colorimetric indicator, hydroxynaphthol blue, which provides a nonspecific indicator of DNA synthesis. In attempting to translate this set for use with the QUASR technique, we began by monitoring the reactions in a real-time PCR machine using LAMP-compatible intercalating dyes (typically SYTO 9 or SYTO 82).
Upon testing the primer sets individually, we noticed that the DENV1 and DENV3 reactions had relatively flat baselines, whereas the DENV2 and DENV4 reactions had rising baselines, with the DENV4 particularly dramatic. As with YFV, we analyzed each DENV primer set for primer dimers, and noticed that both the DENV2 and DENV4 sets had FIP self-dimers with 4 bases of complementarity at the 3’ end (Figure 1). Although we would not expect a 4-base run to be very stable at the reaction temperature of 63 °C, these were the only dimers that appeared even slightly likely to lead to spontaneous amplification. We thus set to “bump” the F2 regions of the FIP primers of the DENV2 and DENV4 sets, within the constraints of keeping the primers within conserved regions, and without disrupting the other nearby primers. Ultimately we identified that “bumps” of 4 bases in the 5’ direction for DENV2 F2, and 2 or 3 bases in the 3’ direction for the DENV4 F2, would eliminate the amplifiable dimer structures, while remaining within the conserved regions of the viral genomes, and without leading to potentially problematic hairpin structures on the FIP. The modification for DENV2 is illustrated on a sequence alignment with representatives of 15 genotypes and sub-genotypes31 in Supplementary Figure S2, which illustrates the constraints of target conservation and location of other primers when making modifications.
The results of the DENV2 and DENV4 FIP modifications are shown in the real-time curves in Figure 2B and C, for those primers tested as individual sets (not part of the combined DENV pan-serotype quadruplex assay). As with YFV, we calculated the thermodynamic probability of non-specific amplification, and found that the bumped DENV2 and DENV4 primers that resulted in improved baseline corresponded to a reduced ΔG’(NSA) for the FIP primers as well as for the complete sets (plotted below the real-time curves in Figure 2).
We tested the original and modified DENV2 and DENV4 primer sets with 10 replicate reactions at 100 or 25 template copies of DENV2 or DENV4 RNA. Results are summarized in Table 2. The modified DENV2 assay yielded more positive detections and faster time to positivity when tested with 100 copies of DENV2 RNA compared to the original, although the difference in the number of positives is not statistically significant (p = 0.14, Fisher’s exact test). The modified DENV4 primers yield the same number of positives as the original. The slightly longer mean time to detection with large standard deviation is reflective of a cluster of assays with a faster time to positivity than the original set (13–14 minutes), plus two reactions that took significantly longer (30, 53 minutes). Inconsistent time to positivity is a common feature in RT-LAMP assays when using RNA template concentrations near the assay’s limit of detection. We observed this modified DENV set to have a low rate of spontaneous “false positive” amplification in extended incubations (1 of 52 no-template controls became positive at time >45 minutes), and we can not rule out that the positive result occurring at 53 minutes was not actually an instance of a non-specific amplification.
Table 2.
Comparison of performance for DENV2 and DENV4 primers tested as individual primer sets, for replicate reactions at two concentrations for either DENV2 or DENV4 RNA near the expected limit of detection. Reactions that turned positive beyond 45 minutes were not counted as positive. For reactions where only 1 or 2 replicates became positive, the actual times are listed rather than a mean and standard deviation.
| Original DENV2/DENV4 primers | Modified DENV2/DENV4 FIP | ||||
|---|---|---|---|---|---|
| Target | copies | Number positive |
Mean time | Number positive |
Mean time |
| DENV2 | 100 | 5 / 10 | 21 ± 6 | 9 / 10 | 15 ± 2 |
| 25 | 2 / 10 | 27, 36 | 1 / 10 | 21 | |
|
| |||||
| DENV4 | 100 | 6 / 10 | 19 ± 2 | 6 / 10 | 21 ± 12 |
| 25 | 2 / 10 | 16, 17 | 2 / 10 | 14, 14 | |
We also tested the modified DENV2 and DENV4 primer sets as part of a combined pan-serotype assay for DENV, at two concentrations for each serotype (200 copies and 50 copies) that were expected to be near the limit of detection; these results are presented in Supplementary Table S4. Within the context of the combined assay, we don’t observe a large difference in the number of detections between the original primers and the modified primers. At 200 copies of DENV4 RNA, the modified set gives faster detection than the original set (p = 0.017, t-test, two-tailed distribution). This appears to be the case as well at 50 copies of DENV4 RNA, although the result is less significant (p = 0.095, t-test, two-tailed distribution). Both combined assays include the original, unmodified primers for DENV1 and DENV3, and there is some complementarity of the primers across serotypes that could mitigate the dimer extension of the original DENV2 and DENV4 FIP primers.
Dengue virus BIP primer hairpin
In attempting to translate this set for use as a single pan-DENV QUASR assay, we noted that the 5’ end of all four BIP primers (the B1c region) was identical for the four serotypes, leading us to pursue labeling each of the BIP primers at the 5’ end with the same fluorophore (Cy5), and using a common quench probe for the QUASR technique. We also noticed that the BIP primer sequences reported for DENV1 and DENV3 are in fact identical, and can be considered as a common DENV1/3 BIP. In testing the primer sets individually, we noticed that, despite having identical 5’ ends, no-template control reactions with the DENV2 primer quenched cleanly (with very low residual fluorescence, as expected), whereas no-template control reactions with the DENV3 primers retained strong fluorescence (approximately 60% that of a positive control reaction).
Addressing the failure of the DENV1/3 BIP-Cy5 to quench cleanly, we performed follow-up experiments in which either the entire DENV3 QUASR primer set, or just the DENV1/3 BIP-Cy5, were tested in an amplification mixture with no template, and with or without enzyme. As shown in Figure 3, we found that without DNA polymerase, the DENV1/3 BIP-Cy5 primer quenches cleanly, indicating that the 5’ end is not initially blocked due to a hairpin structure. In reactions with DNA polymerase, the DENV1/3 BIP-Cy5 fails to quench, either when that primer is included alone, or as part of the complete DENV3 primer set. This indicates that the failure to quench is due to self-amplification, either due to a self-dimer or a self-amplifying hairpin structure that blocks the 5’ end from hybridization with the quencher. The multiple primer analyzer did not identify any problematic self-dimers involving the DENV1/3 BIP. We then conducted a detailed comparison of hairpin structures formed by the DENV2 BIP (which worked well), and the DENV1/3 BIP (which self-amplified). We used the mFold tool available from www.idtdna.com, and noted representative hairpin structures for each of the DENV BIP primers, using default parameters except an Mg++ concentration of 8 mM, and examining structures formed at 25 °C and near the reaction temperature of 65 °C. Both BIP primers can potentially form a variety of hairpin structures at 25 °C and 65 °C with some involvement of either 5’ end or the 3’ end. The main difference that we noticed between the two was that the DENV1/3 primer, while not having complete complementarity at the 3’ end, did have structures with a 3’ mismatch, and a non-canonical G:T basepair 1 base removed from the 3’ end, followed by several matches. We suspected that, however unfavorable, this structure must be at least partially amplifiable by the Bst DNA polymerase. By consulting sequence alignments covering several genotypes of DENV1 and DENV3, we identified several allowable “bumps” that would maintain conservation, while moving the complementarity further from the 3’ end of the hairpin. As the B2 region is situated close to the LoopB region, “bumps” to B2 in some cases necessitated corresponding “bumps” to LoopB. In the process we noticed that the LoopB primer for DENV1 corresponded to the LoopB primer for DENV3 “bumped” by 1 bases, and we thus settled on a new DENV1/3 BIP primer with B2 bumped by 2 bases, and a corresponding combined DENV1/3 LoopB, bumped by 1 base. The revised primer allows significantly improved quenching, as indicated in Figure 3B and 3C.
Figure 3.

Modification of DENV1/3 BIP prevents self-extension in QUASR. (A) Original DENV1/3 BIP-Cy5 was incubated with or without BIPc-10 quencher (no other primers) in RT-LAMP assay with enzyme (solid trace) or without enzyme (dashed trace), indicating that the primer self-extends in the presence of enzyme, inhibiting quenching upon cooling down. For comparison, a reaction with no quencher is shown (short dashes) illustrating the full (unquenched) fluorescence of the primer. (B) DENV3 QUASR with modified DENV1/3 BIP-Cy5 primer, positive control (104 copies DENV3 RNA), or no-template control, displaying the expected behavior (quenching of no-template control). (C) Endpoint fluorescence images of original and modified (“bumped”) DENV3 QUASR reactions in PCR tubes. Positive controls have 5000 copies DENV3 RNA as a template.
We also noted that upon fixing the DENV4 baseline issue by bumping F2, that the DENV4 BIP-Cy5 did not quench as fully as the modified DENV1/3 BIP-Cy5 or DENV2 BIP-Cy5. Again consulting our hairpin structures, we identified this may be due to a relatively stable hairpin at the 5’ end of the DENV4 BIP, which is not present in the other DENV BIPs. We noted that the DENV4 BIP was identical to the DENV2 BIP with the F2 “bumped” by 2 bases, and further that the DENV2 BIP (which we knew quenched well) was a perfect match for the DENV4 sequences on an alignment of several DENV4 genotypes. We thus chose to consolidate DENV2 and DENV4 into a single combined BIP. Our final DENV assay based upon modification of the Lau primers is provided in Supplemantary Table S2.
We present in Supplementary Table S5 our estimates of the limit of detection with 50% and 90% confidence (LOD50 and LOD90) with the fully modified YFV and DENV primer sets, based upon a probit analysis representing 168 reactions with the modified YFV set and 356 reactions with the DENV set (not counting no-template controls), focusing the largest number of replicates in the concentration range near the limit of detection. We note simply that it is difficult to directly compare our results with the detection limits reported by the original authors, which were not based upon probit analysis, and because the viral genomic RNA standards were not quantitated using identical methods. While we didn’t perform our own probit analysis with the original primers, the results reported in Tables 1, 2, and S4 focus around the expected limits of detection of the assays.
Our minor modifications to the priming sites were not expected to reduce the specificity of the primers or introduce cross-reactivity for other viruses. Nonetheless, we tested the specificity of both the modified YFV and modified DENV primers against a panel of viral genomic RNA targets, including other flaviviruses (West Nile virus, St. Louis encephalitis virus, Zika virus, Ilheus virus) as well as other febrile pathogens (Ebola virus, Marburg, Lassa virus, Junin virus, Machupo virus, Mopeia virus, chikungunya virus, Sindbis virus, Ross River virus, Venezuelan equine encephalitis virus TC-83) as well as Plasmodium falciparum parasites and 5% human whole blood. No cross-reactivity or off-target amplifications were observed.
Application of Thermodynamic Calculations to Other Primer Sets
To determine if our probability of non-specific application might have broader predictive value, we performed similar thermodynamic calculations to candidate primer sets that we developed for Ebola virus as part of an ongoing (unpublished) project. In this case, four candidate primer sets were identified using commercial primer design software (LAMP Designer, Premier Biosoft), in conjunction with sequence alignments of viral genomes to identify conserved target regions. The candidate primer sets passed all of the criteria used by the design software and were given quality ratings of ‘Best’ by the software’s metrics. Since the Ebola primers are part of an ongoing study, we refer to them merely with arbitrary designations (Set 1 through Set 4) without reporting the sequences or target regions. The candidate sets were tested empirically for a variety of properties, including speed of amplification, sensitivity for low copy-number detection, and propensity to false-positive amplification in no-template controls prior to moving forward with a single candidate set. We found that three of the four (Sets 2, 3, and 4) had rising baselines, similar to those observed for DENV2 and DENV4 described above (Supplementary Figure S3). Set 1, meanwhile, had a flat baseline, the fastest amplification, and (in separate testing) the best sensitivity and no tendency to produce false-positive amplification in no-template contols. As shown in Supplementary Figure S3, Set 1 also had the ΔG’(NSA) of the four sets. In this case, the ΔG’(NSA) parameter proved to be predictive of behaviors similar to what we observed for the YFV and DENV primer sets.
Discussion
RNA viruses like YFV and DENV are often characterized by a high degree of sequence variability, and managing the primer design constraints of LAMP while also matching the primers to highly conserved regions of the viral genome is challenging. In the case of the YFV primers of Kwallah20, the original primers appear to match most closely the West African lineage of YFV; the modification to FIP does not alter this specificity. Further modification to the primer set (inclusion of degenerate bases or alternate primers) would likely be necessary to achieve broader specificity with other lineages of YFV.
In the case of the DENV primer set, the original authors chose the 3’ untranslated region, which is overall well-conserved among all DENV lineages21. Based upon sequence alignments that we performed for all four serotypes, the authors rather masterfully located their primers within the regions that are highly conserved across the numerous genotypes and sub-genotypes within each DENV serotype. Fortunately, the small adjustments that were made here (2–4 bases in either direction) did not move the primers outside of the highly conserved parts of the 3’-UTR. While we have not performed exhaustive testing of specificity with the modified primers beyond the targets described above, we do expect (based on sequence alignments) that they will have similar specificity and breadth of coverage as the original primers. As noticed in our detailed examination of the primers, there is also some conservation in the priming sites across serotypes, which is likely responsible for our observation that the four primer sets presented by Lau et al are not strictly specific to the four serotypes, but do function effectively as a pan-Dengue primer set. By modification of the primer set for use with QUASR, we expect better signal-to-background in positive reactions, including in the presence of clinical sample matrices that can interfere with intercalating dye detection11, 12.
We demonstrate here that the phenomenon of steadily rising baseline during real-time monitoring of RT-LAMP, in three cases (published primer sets for YFV, DENV 2, and DENV 4) could be attributed to amplifiable primer dimers involving the F2 region of the FIP primer with as few as 4 consecutive bases of complementarity at the 3’ end. “Bumping” the corresponding regions of the FIP primer by anywhere from 2–8 bases to remove the 3’ complementarity, within the constraints of maintaining similar Tm for the F2 region, minimal disruption to nearby primers, and maintaining conservation of the priming site, resulted in eliminating the rising baseline. The modified primers also resulted in faster detection at similar primer concentration, and (for YFV) reduced the limit of detection, suggesting that eliminating the amplifiable primer dimers objectively improves the performance of the assay.
We also determined a BIP primer with a hairpin structure, even with a 3’ mismatch and a non-canonical G:T base pair could self-extend, resulting in slow consumption of the primer into a non-productive state, and interfering with QUASR detection. Similarly bumping the B2 region of this BIP primer eliminated the self-extension, and restored performance.
Our modifications were performed manually, and only simple checks were made (e.g. maintaining similar overall GC content, and if possible maintaining a G or C at the 3’ end; manual checking for hairpin formation in modified primers). We suggest that researchers seeking to design new primer sets for LAMP screen rigorously for primer dimers, and seek to eliminate any structures that have even as few as 4 bases of complementarity at the 3’ end. We note that not all LAMP primer design software packages are designed to allow manual adjustment of automatically designed sets, although our experience suggests that this would be a useful feature.
We identified a dimensionless parameter, ΔG’(NSA), related to the logarithm of a probability of non-specific amplification, with a basis in the thermodynamics of oligonucleotide hybridization, that in these instances was predictive of reduced non-specific DNA synthesis. In the examples presented here, the original FIP primers for YFV, DENV2, and DENV4 had ΔG’(NSA) > 0.2. After performing our modifications, this parameter was reduced to ≤ 0.05, and the rising baseline was suppressed. We further tested the utility of the parameter against our own de novo primer design efforts, and found that the parameter was predictive of rising baseline for an Ebola assay under development. Further analysis of this parameter to determine whether it is broadly applicable across many primer sets is warranted, and if so, to determine with greater precision what an acceptable upper limit for the parameter is. Computation of the ΔG’(NSA) parameter (and even the ability to optimize primer sets for this parameter) would be another useful feature for future software design. We further note there may be novel methods besides small shifts in the primer binding site to further reduce the probability of non-specific amplification. The feature of a rising baseline that we observe when monitoring with a fluorescent real-time dye may not affect the final appearance of an endpoint detection technique such as a color-change indicator or QUASR, and thus may not obscure the interpretation of the assay, but our results with real-time monitoring indicate that a rising baseline due to amplifiable primer dimers (as detected by a fluorescent intercalating dye) does correspond with a reduced rate of amplification, and (at least for YFV) with an increased limit of detection. We thus recommend that real-time monitoring be incorporated as a standard part of primer screening, even if the final intended application is to use an end-point technique.
Conclusion
Our experiments demonstrate that primer dimers and hairpin structures can degrade the speed and sensitivity of RT-LAMP (and presumably LAMP) reactions. Although it is generally surmised that these structures are detrimental in nucleic acid amplification reactions, most of the literature on the topic is specific to PCR, with little information on application to other techniques. We demonstrate that minor “bumps” or displacements of primers to move regions of self-complementarity away from the 3’ end of the primer dramatically reduces the rising baseline and improves the speed of the reaction, and in some cases may improve the sensitivity. We demonstrate that a simple thermodynamic parameter, ΔG’(NSA), could be useful in predicting harmful primer dimer or hairpin interactions. Further exploration of the general utility of this parameter is warranted, including its possible applicability to other isothermal amplification techniques.
Supplementary Material
Acknowledgments
This work was funded by the National Institute of Allergy and Infectious Disease (NIH:NIAID) Grant 1R21AI120973 (R. Meagher). We thank Dr. Cameron Ball for helpful comments on the manuscript. We acknowledge Dr. Lark Coffey and Dr. Sarah Wheeler (University of California-Davis) for RNA from YFV strain 17D, and other viral RNAs used for specificity testing. We also acknowledge receipt of additional RNA from DENV1 and DENV4 from BEI Resources. Sandia National Laboratories is a multimission laboratory managed and operated by National Technology and Engineering Solutions of Sandia LLC, a wholly owned subsidiary of Honeywell International Inc. for the U.S. Department of Energy’s National Nuclear Security Administration under contract DE-NA0003525.
References
- 1.Notomi T, Okayama H, Masubuchi H, Yonekawa T, Watanabe K, Amino N, Hase T. Nucleic acids research. 2000;28:e63–e63. doi: 10.1093/nar/28.12.e63. [DOI] [PMC free article] [PubMed] [Google Scholar]
- 2.Fukuta S, Iida T, Mizukami Y, Ishida A, Ueda J, Kanbe M, Ishimoto Y. Archives of Virology. 2003;148:1713–1720. doi: 10.1007/s00705-003-0134-5. [DOI] [PubMed] [Google Scholar]
- 3.Francois P, Tangomo M, Hibbs J, Bonetti EJ, Boehme CC, Notomi T, Perkins MD, Schrenzel J. FEMS Immunol Med Microbiol. 2011;62:41–48. doi: 10.1111/j.1574-695X.2011.00785.x. [DOI] [PubMed] [Google Scholar]
- 4.Njiru ZK. PLoS Neglected Tropical Diseases. 2012;6:e1572. doi: 10.1371/journal.pntd.0001572. [DOI] [PMC free article] [PubMed] [Google Scholar]
- 5.Jevtuševskaja J, Krõlov K, Tulp I, Langel Ü. Expert review of molecular diagnostics. 2017;17:403–410. doi: 10.1080/14737159.2017.1283218. [DOI] [PubMed] [Google Scholar]
- 6.Mori Y, Nagamine K, Tomita N, Notomi T. Biochemical and biophysical research communications. 2001;289:150–154. doi: 10.1006/bbrc.2001.5921. [DOI] [PubMed] [Google Scholar]
- 7.Tomita N, Mori Y, Kanda H, Notomi T. Nat Protoc. 2008;3:877–882. doi: 10.1038/nprot.2008.57. [DOI] [PubMed] [Google Scholar]
- 8.Goto M, Honda E, Ogura A, Nomoto A, Hanaki K. BioTechniques. 2009;46:167–172. doi: 10.2144/000113072. [DOI] [PubMed] [Google Scholar]
- 9.Ahmad F, Seyrig G, Tourlousse DM, Stedtfeld RD, Tiedje JM, Hashsham SA. Biomed Microdevices. 2011;13:929–937. doi: 10.1007/s10544-011-9562-2. [DOI] [PubMed] [Google Scholar]
- 10.Tanner NA, Zhang Y, Evans TC., Jr BioTechniques. 2015;58:59–68. doi: 10.2144/000114253. [DOI] [PubMed] [Google Scholar]
- 11.Ball CS, Light YK, Koh C-Y, Wheeler SS, Coffey LL, Meagher RJ. Analytical Chemistry. 2016;88:3562–3568. doi: 10.1021/acs.analchem.5b04054. [DOI] [PubMed] [Google Scholar]
- 12.Priye A, Bird SW, Light YK, Ball CS, Negrete OA, Meagher RJ. Scientific Reports. 2017;7:44778. doi: 10.1038/srep44778. [DOI] [PMC free article] [PubMed] [Google Scholar]
- 13.Curtis KA, Rudolph DL, Owen SM. J Med Virol. 2009;81:966–972. doi: 10.1002/jmv.21490. [DOI] [PubMed] [Google Scholar]
- 14.Rudolph DL, Sullivan V, Owen SM, Curtis KA. PLOS ONE. 2015;10:e0126609. doi: 10.1371/journal.pone.0126609. [DOI] [PMC free article] [PubMed] [Google Scholar]
- 15.Tanner NA, Zhang Y, Evans TC., Jr BioTechniques. 2012;53:81–89. doi: 10.2144/0000113902. [DOI] [PubMed] [Google Scholar]
- 16.Jiang YS, Bhadra S, Li B, Wu YR, Milligan JN, Ellington AD. Anal Chem. 2015;87:3314–3320. doi: 10.1021/ac504387c. [DOI] [PubMed] [Google Scholar]
- 17.Liu W, Huang S, Liu N, Dong D, Yang Z, Tang Y, Ma W, He X, Ao D, Xu Y. Scientific reports. 2017;7:40125. doi: 10.1038/srep40125. [DOI] [PMC free article] [PubMed] [Google Scholar]
- 18.Oscorbin IP, Belousova EA, Zakabunin AI, Boyarskikh UA, Filipenko ML. BioTechniques. 2016;61:20–25. doi: 10.2144/000114432. [DOI] [PubMed] [Google Scholar]
- 19.Wheeler SS, Ball CS, Langevin SA, Fang Y, Coffey LL, Meagher RJ. PLOS ONE. 2016;11:e0147962. doi: 10.1371/journal.pone.0147962. [DOI] [PMC free article] [PubMed] [Google Scholar]
- 20.Kwallah A, Inoue S, Muigai AW, Kubo T, Sang R, Morita K, Mwau M. J Virol Methods. 2013;193:23–27. doi: 10.1016/j.jviromet.2013.05.004. [DOI] [PubMed] [Google Scholar]
- 21.Lau Y-L, Lai M-Y, Teoh B-T, Abd-Jamil J, Johari J, Sam S-S, Tan K-K, AbuBakar S. PLOS ONE. 2015;10:e0138694. doi: 10.1371/journal.pone.0138694. [DOI] [PMC free article] [PubMed] [Google Scholar]
- 22.Liu J, Ochieng C, Wiersma S, Stroher U, Towner JS, Whitmer S, Nichol ST, Moore CC, Kersh GJ, Kato C, Sexton C, Petersen J, Massung R, Hercik C, Crump JA, Kibiki G, Maro A, Mujaga B, Gratz J, Jacob ST, Banura P, Scheld WM, Juma B, Onyango CO, Montgomery JM, Houpt E, Fields B. Journal of clinical microbiology. 2016;54:49–58. doi: 10.1128/JCM.02257-15. [DOI] [PMC free article] [PubMed] [Google Scholar]
- 23.Alm E, Lesko B, Lindegren G, Ahlm C, Söderholm S, Falk KI, Lagerqvist N. PLOS Neglected Tropical Diseases. 2014;8:e3416. doi: 10.1371/journal.pntd.0003416. [DOI] [PMC free article] [PubMed] [Google Scholar]
- 24.Edgar RC. Nucleic Acids Res. 2004;32:1792–1797. doi: 10.1093/nar/gkh340. [DOI] [PMC free article] [PubMed] [Google Scholar]
- 25.Larkin MA, Blackshields G, Brown NP, Chenna R, McGettigan PA, McWilliam H, Valentin F, Wallace IM, Wilm A, Lopez R, Thompson JD, Gibson TJ, Higgins DG. Bioinformatics (Oxford, England) 2007;23:2947–2948. doi: 10.1093/bioinformatics/btm404. [DOI] [PubMed] [Google Scholar]
- 26.SantaLucia J. Proceedings of the National Academy of Sciences. 1998;95:1460–1465. doi: 10.1073/pnas.95.4.1460. [DOI] [PMC free article] [PubMed] [Google Scholar]
- 27.Andronescu M, Condon A, Turner DH, Mathews DH. RNA Sequence, Structure, and Function: Computational and Bioinformatic Methods. 2014:45–70. [Google Scholar]
- 28.Peyret N, Seneviratne PA, Allawi HT, SantaLucia J. Biochemistry. 1999;38:3468–3477. doi: 10.1021/bi9825091. [DOI] [PubMed] [Google Scholar]
- 29.Beasley DW, McAuley AJ, Bente DA. Antiviral research. 2015;115:48–70. doi: 10.1016/j.antiviral.2014.12.010. [DOI] [PubMed] [Google Scholar]
- 30.Nunes MR, Vianez JL, Jr, Nunes KN, da Silva SP, Lima CP, Guzman H, Martins LC, Carvalho VL, Tesh RB, Vasconcelos PF. J Virol Methods. 2015;226:40–51. doi: 10.1016/j.jviromet.2015.10.003. [DOI] [PubMed] [Google Scholar]
- 31.Waman VP, Kolekar P, Ramtirthkar MR, Kale MM, Kulkarni-Kale U. PeerJ. 2016;4:e2326. doi: 10.7717/peerj.2326. [DOI] [PMC free article] [PubMed] [Google Scholar]
Associated Data
This section collects any data citations, data availability statements, or supplementary materials included in this article.