

Abstract
Using a community-based population cross-sectional study, we investigated the validity of an enzymatic method for glycated albumin (GA) measurements and evaluated its utility as a diagnostic tool for diabetes mellitus (DM). In total, 1,211 participants from the city of Harbin, People's Republic of China, were enrolled in the study. A receiver operating characteristic (ROC) analysis for GA, fasting plasma glucose (FPG) and haemoglobin A1c (HbA1c) measurements in diagnosed and undiagnosed DM were compared, based on a definition of DM using 1999 WHO criteria. We also estimated the correlation among GA, HbA1c and other clinical characteristics. Significant and positive correlations of fasting serum GA with FPG (r 50.8097) and HbA1c (r 50.8976) were found in participants enrolled in the study. ROC analysis for GA predicting undiagnosed DM with a cut-off point of 15.7% was similar to that of FPG and HbA1c. Therefore, our data indicate that GA is a potential tool for DM diagnosis.
Key Words: diabetes mellitus, glycated albumin, haemoglobin A1c, linear regression analysis, receiver operating characteristic curve
Introduction
Haemoglobin A1c (HbA1c) has been the mainstay in the determination of glycaemic control in the management of diabetes mellitus (DM) for 30 years, and has been used in many clinical long-term studies.1,2 The use of diagnostic markers has shown that early diagnosis and treatment also have the potential to prevent diabetic complications and cardiovascular disease.
However, HbA1c ceases to be a reliable glycaemic control index if the erythrocyte lifespan has become altered; the HbA1c value is also affected by variant haemoglobins (although not all HbA1c tests are affected by all variants).3 Glycated albumin (GA) is known to reflect short-term glycaemic levels, and could be a useful therapeutics monitor in DM because the half-life of albumin (17 days) is shorter than that of erythrocytes (28 days).4
Several studies5–7 have shown that GA is a more reliable DM monitor and a better marker of glycaemic control than is HbA1c in patients undergoing haemodialysis and in patients with fluctuating and poorly controlled type 2 DM. Moreover, serum GA is not affected by factors that affect haemoglobin metabolism.7 The International Expert Committee (IEC) recently proposed a new diagnostic criteria based on measurement of HbA1c.8
However, little attention has been paid to the utility of GA estimation compared with that of HbA1c in the diagnosis of DM. The GA assay is not widely available and is not standardised; thus, there is only very limited data to suggest that it would be useful as a diagnostic tool.
In this cross-sectional study, our aim was to establish the validity of GA as a measure of glycaemic control and to evaluate its utility as a diagnostic tool for DM in a community-based population.
Methods
Study subjects
We enrolled randomly selected residents of Harbin (one of the largest cities in north-east China. We randomly selected 1675 residents from 622 families) from four (Pingfang, Xiangfan, Nangang and Hulan) of the seven districts of Harbin and one additional city (Shuangcheng) between September 2009 and May 2010.
A total of 1,412 residents consented to participate in the study (response rate 84.3%). Of the 1,412 participants, 201 were excluded because they were being treated for DM, anaemia, thyroid disease, liver disease or nephropathy or were aged below 18, leaving 1,211 participants available for analysis (653 men and 558 women, mean age: 50.2 years, age range 19–87 years). All patients provided written informed consent before participation, and the study was approved by the Institutional Ethics Committee.
Biochemical measurements
Body height, body weight and blood pressure were measured, and the body mass index (BMI) calculated for each participant. After an eight-hour overnight fast, each participant had aliquots of whole venous blood, fresh serum and plasma samples (in sodium fluoride (NaF) anticoagulant tubes) taken for measurement of FPG and two hour plasma glucose levels (PG) using a standard 75 g oral glucose tolerance test (OGTT). Other biochemical tests were also performed (urea, creatinine, total protein, albumin, glutamic-oxaloacetic transaminase (ALT), glutamic-pyruvic transaminase (AST) and total cholesterol). Blood samples were assayed at the laboratory in The Fourth affiliated Hospital of Harbin Medical University.
Blood glucose concentrations were measured using a hexokinase/glucose-6-phosphate dehydrogenase method. Samples for HbA1c analysis were placed in EDTA tubes, kept cold until processing (within six hours) and measured using high-performance liquid chromatography (HPLC) in the Bio-Rad variant II (manufacturer's reference range: 4–6%). The HPLC was performed according to the standardised calibration from the National Glycohemoglobin Standardization Program (NGSP). HbA1c levels were converted to NGSP levels (%). The interassay coefficients of variation (CVs) were 1.85% and 1.34% for HbA1c at values 5.8% and 9.8%, respectively.
Other serum biochemical measurements were measured using standard commercial methods on a Hitachi 7180 Biochemistry Automatic Analyzer (Hitachi Instruments Service, Tokyo, Japan).
GA was measured by an enzymatic method using the Lucica® GA-L enzymatic kit assay (Asahi Kasei Pharma Corp., Tokyo, Japan) (manufacturer's reference range: 8–16%). The interassay CVs were 2.2% and 1.3% for GA of 16% and 44%, respectively, as determined using control serum samples. The diagnosis of DM was based on the 1999 WHO fasting PG (FPG) and/or oral glucose tolerance test (OGTT) criteria,9 with an FPG ≥7.0 mmol/l, and/or 2-h PG of ≥11.1mmol/l on an OGTT defining the presence of DM.
Statistical analysis
All data are shown as mean ± SD. For statistical analyses, the unpaired Student's t-test was used to compare groups. To analyse the effects of explanatory variables on GA level, stepwise multivariate regression analysis was performed, with GA as an objective variable; and with age and BMI as explanatory variables. Univariate regression analysis, as well as stepwise multivariate regression analysis, was performed with SAS 9 and SPSS 17.0. Correlation coefficients were calculated by simple regression analysis to analyse the correlations among GA, FPG, 2h-PG and HbA1c. A nominal p value <0.05 was considered statistically significant. The area under the receiver operating characteristic curve (ROC) analysis (AUC) for GA, HbA1c and FPG screening for undiagnosed DM were compared using MedCalc statistical software version 10.3, with p values <0.05 considered to be statistically significant for a two-sided test.
Results
Age, gender and BMI effects
No participants had a serum albumin concentration <35 g/l. No significant difference was observed for GA between genders, and mean HbA1c level and FPG were also similar between men and women. The univariate regression analysis demonstrated a significant positive correlation between age and GA. In this population, the mean BMI was 23.8 kg/m2 in men and 22.1 kg/m2 in women. Adjusted BMI (ABMI) adjusted correlation between age and GA level was not significant (p=0.194).
Correlation between GA and PG or HbA1c
There were significant and positive correlations of fasting serum GA with FPG (Figure 1a: r=0.8097, p<0.0001) and HbA1c (Figure 1b: r=0.8976, p<0.0001). Similarly, significant and positive correlations of GA were also found with PG (Figure 1c: r=0.6545, p<0.0001) 2 h after initiation of a 75 g OGTT, which did not differ significantly from that of HbA1c with FPG (r=0.8259, p<0.0001) and 2-h PG (r=0.7142, p<0.0001), based on the lack of significant differences in r-values. Regression analysis showed no correlation between GA and the other biochemistry measurements in our study. Thus, GA correlated better with FPG than with 2h-PG, whereas HbA1c showed similar correlations with both FPG and 2h-PG.
Fig 1.
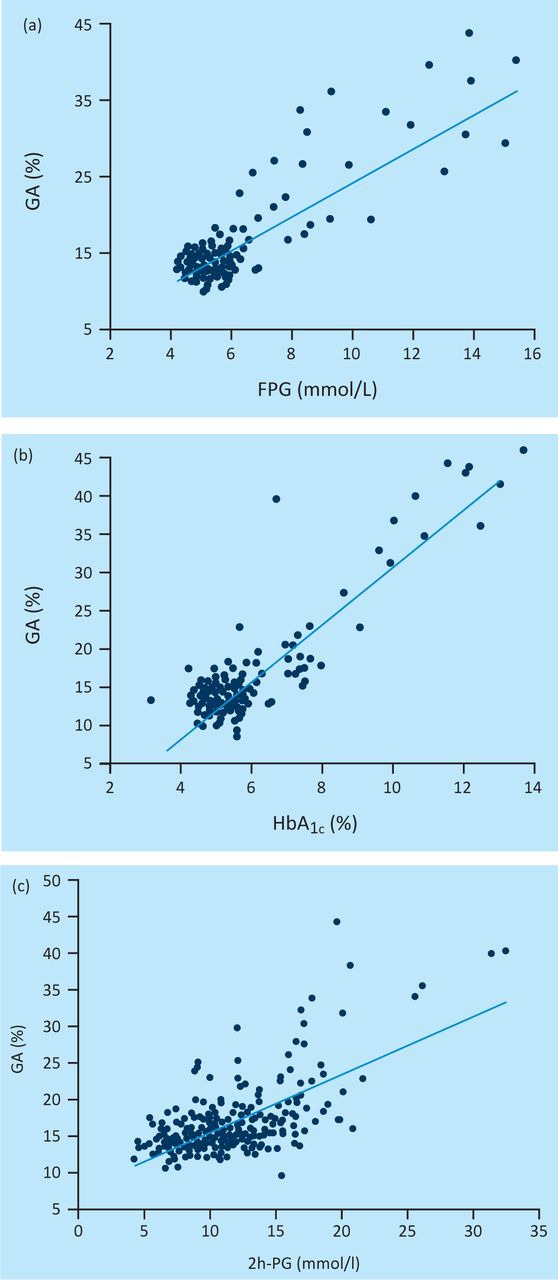
The regression analysis of (a) fasting serum glycated albumin (GA) with plasma glucose (PG), (b) fasting serum haemoglobin A1c (HBA1c) and (c) fasting serum 2h-PG.
Performance characteristics of GA for undiagnosed DM
Figure 2 shows the ROC analysis for GA predicting undiagnosed DM among 1,211 individuals. The AUC of the ROC curve for GA (0.861 (95% confidence interval (CI); 0.787–0.917)) with a cut-off point of 15.7% predicting undiagnosed DM was similar to that for FPG (0.882 (95% CI; 0.812–0.934)) and that of HbA1c (0.861 (95% CI; 0.812– 0.934)). According to the ROC analysis, the cut-off level for GA that best predicted DM was 15.7%, with a sensitivity of 73.3% and a specificity of 80.1%.
Fig 2.

Receiver operating characteristic (ROC) analysis of plasma glycated albumin (GA), fasting plasma glucose (PG) and haemoglobin A1c (HBA1c) for predicting undiagnosed diabetes mellitus (DM).
Discussion
In this cross-sectional study, although age correlated with the GA level as in other studies,10 this effect was lost when adjusted for BMI (p=0.194). The GA and FPG levels also were not influenced by gender, in contrast to other reports indicating that females have lower FPG levels than do males.10 Among this Chinese population, the data showed that GA levels were negatively influenced by BMI, confirming the results of other studies.11 Importantly, we examined the significance of GA as a diagnosis indicator of DM, correlating with FPG PG at the end of a two-hour 75-g OGTT. PG levels and 2h-PG after the initiation of the OGTT correlated with GA no less significantly than with HbA1c. GA was more highly correlated with FPG than with 2h-PG, whereas HbA1c showed similar correlations with both FPG and 2h-PG. Overall, we found highly positive correlations of GA levels with HbA1c (r=0.898) and FPG (r=0.810). Theses correlation coefficients are similar to those reported by previous studies.12
The ROC analysis showed that a GA level of 15.7% was best for discriminating patients with DM from those without, with a sensitivity of 73.3% and a specificity of 80.3%. The area under the ROC curve was 0.861. These data support the contention that GA is a reasonable marker for the diagnosis of DM in a medical evaluation. Although, in this respect, its performance was similar to the use of HbA1c, there are other advantages that could be gained from the more widespread use of GA measurements. For example, GA has potential advantages over HbA1c in some instances, because GA reflects the mean PG level over the preceding 2–3 weeks.13 Thus, it might be a better potential monitor of glycaemic control for patients with DM who suffer severe fluctuations in their glucose levels. It can also be used to confirm treatment effects when initiating or changing medication.
The Japan Society of Clinical Chemistry (JSCC) has reported its recommended method for GA measurement from serum.15 However, international standardisation for GA is clearly required if this assay is to become widely used. The Lucica® GA-L enzymatic kit assay that we used in this study has been automated for high throughput analysis, and is more suitable for such analysis than is HPLC or other liquid chromatography methods.
Limitations of our study include a relative inadequate sample size. In addition, our study was cross-sectional: in the future, longitudinal studies need to be carried out to investigate whether GA is a potential tool for predicting diabetic complications.
In conclusion, GA has the potential to be used as a measure of dysglycaemia for use in future research and clinical practice. Further investigations are needed to determine its worth as a robust monitor of glycaemic control and, thus, as means of diagnosing DM.
References
- 1.The Diabetes Control and Complications Trial Research Group. The relationship of glycemic exposure (HbA1c) to the risk of development and progression of retinopathy in the Diabetes Control and Complications Trial. Diabetes. 1995;44:968–83. doi: 10.2337/diabetes.44.8.968. [DOI] [PubMed] [Google Scholar]
- 2.UK Prospective Diabetes Study (UKPDS) Group. Intensive blood-glucose control with sulphonylureas or insulin compared with conventional treatment and risk of complications in patients with type 2 diabetes (UKPDS 33) Lancet. 1998;352:837–53. doi: 10.1016/S0140-6736(98)07019-6. [DOI] [PubMed] [Google Scholar]
- 3.Bry L. Chen PC. Sacks DB. Effects of hemoglobin variants and chemically modified derivatives on assays for glycohemoglobin. Clin Chem. 2001;47:153–63. [PubMed] [Google Scholar]
- 4.Kumeda Y. Inaba M. Shoj S, et al. Significant correlation of glycated albumin, but not glycated haemoglobin, with arterial stiffening in haemodialysis patients with type 2 diabetes. Clin Endocrinol. 2008;69:556–61. doi: 10.1111/j.1365-2265.2008.03202.x. [DOI] [PubMed] [Google Scholar]
- 5.Guthrow CE. Morris MA. Day JF, et al. Enhanced nonenzymatic glucosylation of human serum albumin in diabetes mellitus. Proc Natl Acad Sci USA. 1979;76:4258–61. doi: 10.1073/pnas.76.9.4258. [DOI] [PMC free article] [PubMed] [Google Scholar]
- 6.Koga M. Murai J. Saito H, et al. Glycated albumin and glycated hemoglobin are influenced differently by endogenous insulin secretion in patients with type 2 diabetes. Diabetes Care. 2010;33:270–2. doi: 10.2337/dc09-1002. [DOI] [PMC free article] [PubMed] [Google Scholar]
- 7.Suwa T. Ohta A. Matsui T, et al. Relationship between clinical markers of glycemia and glucose excursion evaluated by continuous glucose monitoring (CGM) Endocr J. 2010;57:135–40. doi: 10.1507/endocrj.K09E-234. [DOI] [PubMed] [Google Scholar]
- 8.Kilpatrick ES. Bloomgarden ZT. Zimmet PZ. International Expert Committee Report on the Role of the A1C Assay in the Diagnosis of Diabetes. Diabetes Care. 2009;32:1327–34. doi: 10.2337/dc09-1231. [DOI] [PMC free article] [PubMed] [Google Scholar]
- 9.Olabi B. Bhopal R. Diagnosis of diabetes using the oral glucose tolerance test. BMJ. 2009;339:b4354. doi: 10.1136/bmj.b4354. [DOI] [PubMed] [Google Scholar]
- 10.Furusyo N. Koga T. Ai M, et al. Utility of glycated albumin for the diagnosis of diabetes mellitus in a Japanese population study: results from the Kyushu and Okinawa Population Study (KOPS) Diabetologia. 2011;54:3028–36. doi: 10.1007/s00125-011-2310-6. [DOI] [PubMed] [Google Scholar]
- 11.Koga M. Matsumoto S. Saito H, et al. Body mass index negatively influences glycated albumin, but not glycated hemoglobin, in diabetic patients. Endocr J. 2006;53:387–91. doi: 10.1507/endocrj.K05-137. [DOI] [PubMed] [Google Scholar]
- 12.Takahashi S. Uchino H. Shimizu T, et al. Comparison of glycated albumin (GA) and glycated hemoglobin (HbA1c) in type 2 diabetic patients: usefulness of GA for evaluation of short-term changes in glycemic control. Endocr J. 2007;54:139–44. doi: 10.1507/endocrj.k06-103. [DOI] [PubMed] [Google Scholar]
- 13.Koenig RJ. Peterson CM. Jones RL, et al. Correlation of glucose regulation and hemoglobin A1c in diabetes mellitus. N Engl J Med. 1978;295:417–20. doi: 10.1056/NEJM197608192950804. [DOI] [PubMed] [Google Scholar]
- 14.Tominaga M. Eguchi H. Manaka H, et al. Impaired glucose tolerance is a risk factor for cardiovascular disease, but not impaired fasting glucose. The Funagata Diabetes Study. Diabetes Care. 1999;22:920–4. doi: 10.2337/diacare.22.6.920. [DOI] [PubMed] [Google Scholar]
- 15.Committee on Diabetes Mellitus Indices, Japan Society of Clinical Chemistry. Takei I, et al. JSCC recommended method for glycated albumin measurement in serum. Jpn J Clin Chem. 2008;37:178–91. [Google Scholar]