Abstract
This study aimed to ascertain the value of posters at medical meetings to presenters and delegates. The usefulness of posters to presenters at national and international meetings was evaluated by assessing the numbers of delegates visiting them and the reasons why they visited. Memorability of selected posters was assessed and factors influencing their appeal to expert delegates identified. At both the national and international meetings, very few delegates (<5%) visited posters. Only a minority read them and fewer asked useful questions. Recall of content was so poor that it prevented identification of factors improving their memorability. Factors increasing posters' visual appeal included their scientific content, pictures/graphs and limited use of words. Few delegates visit posters and those doing so recall little of their content. To engage their audience, researchers should design visually appealing posters by presenting high quality data in pictures or graphs without an excess of words.
Key Words: information dissemination, medical conferences, medical illustration, posters presentations, publications
Introduction
The purpose of poster presentations is to communicate the results of clinical and scientific research.1 Over the last decade the number of delegates, accepted abstracts and poster presentations at the Digestive Diseases Week (DDW) and British Society of Gastroenterology (BSG) meetings has risen.2 However, the value of posters to both presenters and delegates is uncertain. Although supporters of the medium claim that posters facilitate discussion between interested parties,3–5 as a result of previous experiences, it has been hypothesised that the value of poster sessions is overrated, that few delegates attend poster presentations and that their recall of contents is poor. This study aimed to identify features of posters that increase their visual appeal and memorability.
Methods
Three experiments were conducted to assess these hypotheses.
Experiment 1: Seven researchers presented posters in the plenary (n=1) and sessions covering neoplasia (2), inflammatory bowel disease (IBD) (2), endoscopy (1) and biliary disease (1) at the BSG meeting in 2001. During the 90-minute poster session a record was made of the number of people attending each poster and whether they glanced at the title, read it, asked a question or were visiting for primarily social reasons. Note was made if any question was useful to the presenter. The presenters were asked to remain neutral towards delegates, neither encouraging nor discouraging interaction.
Experiment 2: Five researchers presented posters in the IBD (n=1), gastrointestinal physiology (1), and molecular biology (3) sections at the BSG meeting in 2003. The same posters were then presented, by the same presenters at the DDW two months later. The outcomes were recorded as in Experiment 1.
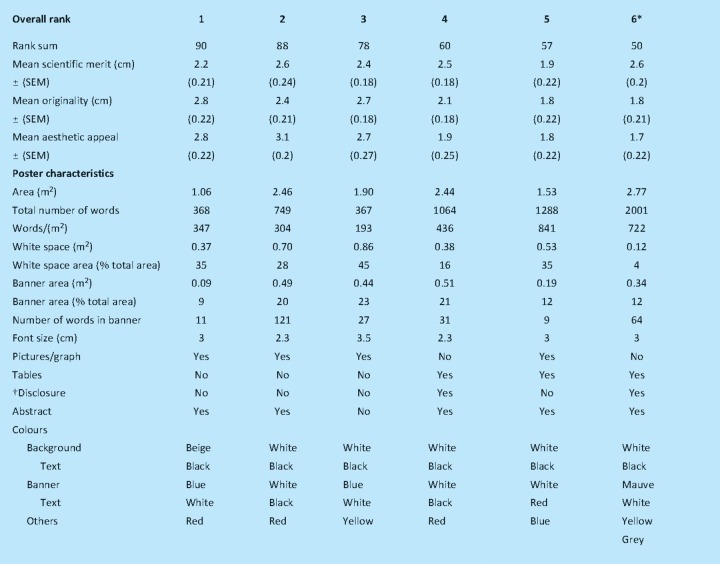
Experiment 3: Based on the abstract alone, six posters, including a poster of distinction, were selected from the IBD clinical section before the DDW meeting in 2009. In total, 26 UK-based clinical delegates with an interest in IBD were asked to score each poster for scientific merit, originality and aesthetic qualities on five-cm visual analogue scales. Photographs of each poster were examined using Digimizer™ software (version 3.6.1.0, Mariakerke, Belgium) and a range of poster characteristics recorded (see Table 1). Two weeks later, recall of study populations, experimental designs and conclusions of each of the posters of distinction, and the highest and lowest ranked posters, was assessed by cold-calling, using a six-point Likert scale.
Table 1.
Summary of poster characteristics. Each assessor's scores for scientific merit, originality and visual appeal were ranked. Overall rank was determined by the sum of the rank scores (1 denotes the group's favourite, and 6 the least preferred poster). *Denotes the poster that was awarded a distinction by the American Gastroenterology Association (AGA). The AGA request that poster presenters disclose any conflicts of interest.
Ethical considerations
Delegates known to the investigators were invited to take part in Experiment 3 before leaving the UK; they were not told about the later cold-calling. Permission for the photographs was obtained from the poster presenters.
Statistical methods
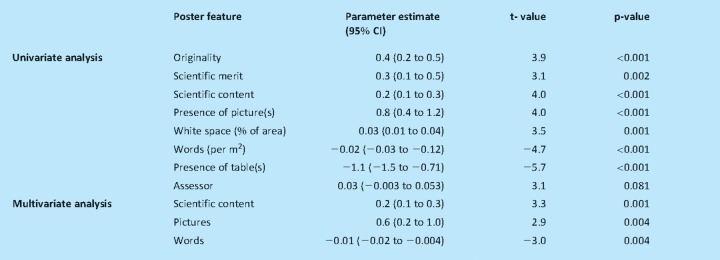
Analyses were conducted using SPSS (version 16, Chicago, Illinois) and Prism Software (version 4, San Diego, California). Two-tailed p-values <0.05 were considered significant. Fisher's exact test was used to compare proportions of delegates visiting each poster for each purpose. Differences in discrete visits between the BSG and DDW meetings were sought using Mann–Whitney U tests. Kruskal–Wallis tests were used to identify differences in recall scores. Although the number of posters assessed was not large, collectively across posters and assessors, the numbers of observations were normally distributed, with comparable variances, allowing for parametric analyses. Associations were sought using Pearson correlation coefficients between scientific merit, originality and visual appeal. Univariate regression analysis was undertaken to detect poster characteristics influencing aesthetic scores and to guide the order of entry into a multiple linear regression model (Table 2) incorporating forwards stepwise protocols to account for interacting and/or confounding variables.
Table 2.
Multivariate linear regression of poster features that influenced visual appeal. Univariate analysis was used to identify poster features that influenced visual appeal and to guide the order of entry into the multivariate model. The sums of scores for scientific merit and originality were combined in the model as scientific content. Checks were made on existing significant variables each time a further explanatory poster feature was identified to ensure that their presence in the model was still required.
Resultitles
Experiment 1
Of the 1,800 delegates, 13 (4–26) median (range) glanced at each poster, and 11 (5–18) scrutinised them; <5% of delegates read any of the posters. Only four (2–7) questions were asked at each poster. Of these, only two delegates (7% of all questioners) raised points useful to the presenters. Eight(4–19) delegates visited each poster primarily to socialise. More visits to female (37%) than male (22%) presenters were social (p=0.005), while more delegates visiting males' posters simply glanced at the poster (39% ν 15%, p=0.01). The purposes of visits were independent of the grade of presenter, the poster's location, or whether it was the plenary poster or not. More visits to the plenary poster were social (51% ν 20%, p=0.003).
Experiment 2
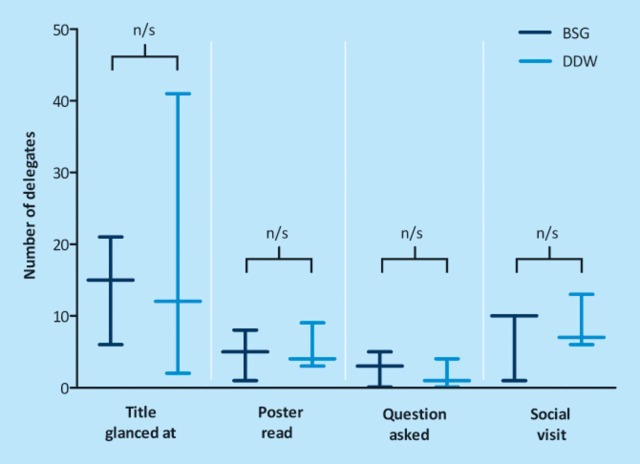
There were no differences in the number or purposes of visits between the BSG and DDW in 2003 (Fig 1). At the BSG, <1.5%, and at the DDW <0.3%, delegates read any of the posters. The total number of useful questions was 10 at the BSG and five at the DDW. More delegates read the posters at the 2001 (11 (5–18)) than the 2003 (5 (1–15)) BSG meeting (p<0.05).
Fig 1.
Comparison of visits to five posters presented at both the British Society of Gastroenterology (BSG) and the Digestive Diseases Week (DDW) meetings in 2003. Visits were classified according to the most interactive category fulfilled; for example, glancing at the title, followed by reading the poster and then asking a question, was classified as asking a question only. Data presented are medians and ranges, differences were sought using the Mann–Whitney U test (n/s denotes not significant).
Experiment 3
Delegates remembered very little when phoned about posters two weeks later. Recall of poster contents was equally poor for the poster of distinction (median 3.5 range (0–12), maximum 18), as for the delegates' highest (2.5 (0–11)) and lowest (2 (0–9)) ranked posters. Analyses of the data with any measure of recall ability as the primary outcome was therefore futile.
Aesthetic and originality scores were positively correlated (r=0.31, 95% confidence interval (CI) 0.15 to 0.44; p<0.0001), as were aesthetic and scientific merit scores (r=0.25, 95% CI 0.09 to 0.39; p=0.02). There was also a significant association between the variable derived by the sum of these scores, termed scientific content, and aesthetic score (r=0.31, 95% CI 0.16 to 0.45; p<0.0001) but this accounted for only 9.7% of the variation in aesthetic score.
Multivariate analysis confirmed that after adjusting for the number of words (per m2), and pictures, the aesthetic score was significantly influenced by the perceived scientific content (Table 2). Similarly, after adjusting for the other cited variables, the addition of a picture or graph increased the visual appeal, as did less overcrowding with words. The delegates favourite posters (ranked one and two) contained an average of 326 words per m2 compared with 782 for the posters ranked five and six (Table 1).
Discussion
Poster presentation should be a two-way process. For the presenter, work is potentially peer-reviewed by experts in their field. Conversely, for the delegate, posters should convey a concise overview of novel research. Only 45% presented abstracts reach full publication.6 Publication rates of abstracts submitted to the BSG seem to be falling, implying that for more and more research, poster presentations are the only opportunity to share research findings.2 Qualitative data report that about 75% of researchers believe posters to be useful, most citing visual appeal as the key determinant of success.3,5 Against this view, our surveys, like that of Salzl and colleagues,5 showed that few delegates visit posters during designated sessions and even fewer ask useful questions. A potential criticism of these findings is that the data were simply uninteresting to most delegates. However, the plenary poster, presumably chosen for its importance, attracted no more visitors than the others.
Even having been asked to scrutinise posters carefully, expert delegates recalled little of their contents two weeks later. There are several possible explanations for this. Firstly, delegates may not have been interested in the presented data. This seems unlikely as we selected posters specifically relevant to their interest in IBD. Furthermore, recall scores for the poster of distinction were no different from those of the other posters. Taking part in the study may have been distracting but delegates were asked to comment in detail on originality and scientific merit. Finally, it is likely that researchers routinely visiting posters at meetings select and focus on those of highest interest, presumably remembering their contents, but discarding what they do not need to recall.
It is clear that the perceived scientific merit and originality of posters correlates with visual appeal. Although a causal relationship is not certain, this implies that flawed science can be dressed up to improve its apparent scientific merit and that sloppy presentation, regardless of the quality of the work, detracts from it. Persuading delegates to stop and read posters is the first step towards interaction. The literature is awash with helpful, but mostly untested, anecdotal tips for preparing an eye-catching, easy to read, comprehensible poster.7–12 Poster features that are visually appealing have been identified. Overcrowding has a negative impact on visual appeal. The ideal number of words appears to be 300–400 per m2. Assessors also preferred graphs or pictures to tables but no clear messages about preferred colours emerged.
Conclusions
In view of the time and money invested in presenting posters at medical meetings, ways need to be devised to improve their value to presenters and delegates alike. Posters carry a potential which is not currently being realised.
Acknowledgements
All authors participated in study design, collection and analysis of data and approved the final proof. CLG performed the multivariate analysis. We gratefully acknowledge all the poster presenters and visiting delegates who took part. JRG's research was funded by National Association of Crohn's and Colitis and MW's by Broad Medical Research Programme.
References
- 1.Maugh TI. Poster sessions: a new look at scientific meetings. Science. 1974;184:1361. doi: 10.1126/science.184.4144.1361. [DOI] [PubMed] [Google Scholar]
- 2.Hopper AD, Atkinson RJ, Razak A, et al. Is medical research within the UK in decline? A study of publication rates from the British Society of Gastroenterology from 1994 to 2002. Clin Med. 2009;9:22–5. doi: 10.7861/clinmedicine.9-1-22. [DOI] [PMC free article] [PubMed] [Google Scholar]
- 3.Rowe N, Ilic D. What impact do posters have on academic knowledge transfer? A pilot survey on author attitudes and experiences. BMC Med Educ. 2009;9:71. doi: 10.1186/1472-6920-9-71. [DOI] [PMC free article] [PubMed] [Google Scholar]
- 4.Halligan P. Poster presentations: valuing all forms of evidence. Nurse Educ Pract. 2008;8:41–5. doi: 10.1016/j.nepr.2007.02.005. [DOI] [PubMed] [Google Scholar]
- 5.Salzl G, Golder S, Timmer A, et al. Poster exhibitions at national conferences: education or farce? Dtsch Arztebl Int. 2008;105:78–83. doi: 10.3238/arztebl.2008.0078. [DOI] [PMC free article] [PubMed] [Google Scholar]
- 6.Scherer RW, Langenberg P, von Elm E. Full publication of results initially presented in abstracts. Cochrane Database Syst Rev. 2007;(2):MR000005. doi: 10.1002/14651858.MR000005.pub3. [DOI] [PubMed] [Google Scholar]
- 7.Briggs DJ. A practical guide to designing a poster for presentation. Nurs Stand. 2009;23:35–9. doi: 10.7748/ns2009.04.23.34.35.c6954. [DOI] [PubMed] [Google Scholar]
- 8.Hamilton CW. At a glance: a stepwise approach to successful poster presentations. Chest. 2008;134:457–9. doi: 10.1378/chest.08-1078. [DOI] [PubMed] [Google Scholar]
- 9.Boullata JI, Mancuso CE. A ‘how-to’ guide in preparing abstracts and poster presentations. Nutr Clin Pract. 2007;22:641–6. doi: 10.1177/0115426507022006641. [DOI] [PubMed] [Google Scholar]
- 10.Shelledy DC. How to make an effective poster. Respir Care. 2004;49:1213–6. [PubMed] [Google Scholar]
- 11.Campbell RS. How to present, summarize, and defend your poster at the meeting. Respir Care. 2004;49:1217–21. [PubMed] [Google Scholar]
- 12.Willett LL, Paranjape A, Estrada C. Identifying key components for an effective case report poster: an observational study. J Gen Intern Med. 2009;24:393–7. doi: 10.1007/s11606-008-0860-1. [DOI] [PMC free article] [PubMed] [Google Scholar]


