

ABSTRACT
Sofosbuvir and ribavirin exert their anti-hepatitis C virus (anti-HCV) activity following metabolic activation in the liver. However, intrahepatic concentrations of the pharmacologically active nucleotide metabolites in humans are poorly characterized due to the inaccessibility of tissue and technical challenges with measuring nucleotide levels. A clinical study assessing the efficacy of sofosbuvir and ribavirin administered prior to liver transplantation to prevent HCV recurrence provided a unique opportunity to quantify nucleotide concentrations in human liver. We analyzed nucleotides using high-performance liquid chromatography coupled to tandem mass spectrometry in liver tissue from 30 HCV-infected patients with hepatocellular carcinoma who were administered sofosbuvir (400 mg/day) and ribavirin (1,000 to 1,200 mg/day) for 3 to 52 weeks prior to liver transplantation. Median total hepatic metabolite concentrations (the sum of nucleoside and mono-, di-, and triphosphates) were 77.1 μM for sofosbuvir and 361 μM for ribavirin in patients on therapy at the time of transplantation. Ribavirin and sofosbuvir efficiently loaded the liver, with total hepatic metabolite concentrations exceeding maximal levels in plasma by approximately 30-fold. Ribavirin metabolite levels suggest that its monophosphate is in great excess of its inhibition constant for IMP dehydrogenase and that its triphosphate is approaching the binding constant for incorporation by the HCV NS5B RNA-dependent RNA polymerase. In accordance with the potent antiviral activity of sofosbuvir, these results demonstrate that the liver triphosphate levels achieved following sofosbuvir administration greatly exceed the inhibition constant for HCV NS5B. In conclusion, this study expands the quantitative understanding of the pharmacology of sofosbuvir and ribavirin by establishing efficient hepatic delivery in the clinic. (This study has been registered at ClinicalTrials.gov under identifier NCT01559844.)
KEYWORDS: direct-acting antiviral, transplantation, nucleoside analog, pharmacokinetics, mass spectrometry, prodrug
INTRODUCTION
Nucleoside analogs have represented an important advance in hepatitis C virus (HCV) therapy. Activity across genotypes and a high barrier to resistance have played an important role in their success. The addition of ribavirin, a nucleoside analog, to interferon therapy increased sustained virologic response (SVR) rates from percentages in the teens to nearly half of patients following 48 weeks of therapy (1, 2). This advantage extended to historically difficult-to-treat patients, including those with genotype 1, high viral loads, and fibrosis (reviewed by Pianko and McHutchison [3]). The addition of sofosbuvir—a monophosphate prodrug of a uridine nucleoside analog, GS-331007—represented a breakthrough, allowing for the approval of the first interferon-free regimen of sofosbuvir and ribavirin for genotypes 2 and 3 and paving the way for all direct-acting antiviral therapies without interferon and ribavirin (4, 5; reviewed by Lawitz et al. [6]). Today, sofosbuvir is often used in the absence of ribavirin and in combination with other direct-acting antiviral agents, offering SVR rates of >90% across genotypes in as few as 8 weeks of therapy (7, 8).
The concentration of a drug in plasma that is not bound to plasma proteins is commonly equated with inhibitory concentrations in tissues. However, markedly different tissue-to-plasma ratios can be observed for drugs that have low membrane permeability, that are substrates for membrane transporters, or that are metabolically activated in cells. For example, the hepatic concentration of the hepatitis C protease inhibitor vaniprevir, which is concentrated in the liver through transport by organic anion-transporting polypeptides, is 20 to 280 times the concentration observed in plasma (9). Assessing tissue pharmacokinetics is of particular importance for nucleoside analogs and their prodrugs because of their common interaction with transporters and their reliance on intracellular phosphorylation to form pharmacologically active metabolites.
Sofosbuvir and ribavirin undergo multistep processes in forming pharmacologically active nucleotide metabolites in the liver (Fig. 1). After entering hepatocytes, sofosbuvir is metabolized by carboxylesterase 1 (CES1) cleavage to form metabolite X (10). Efficient metabolism by CES1 results in high first-pass hepatic extraction of sofosbuvir (likely >70%). Subsequent phosphoramidase cleavage releases the monophosphate metabolite. The GS-331007 monophosphate can either be dephosphorylated to form the nucleoside metabolite, which is eliminated, or be sequentially phosphorylated to form the pharmacologically active triphosphate metabolite, which acts as an alternate substrate and, ultimately, as a nonobligate chain terminator of the HCV NS5B polymerase (11).
FIG 1.

Monitored plasma and intrahepatic metabolites. After entry into the cell, sofosbuvir is cleaved by carboxylesterase 1 (CES1) to form metabolite X. Subsequent cleavage of the phosphoramidate bond results in the formation of GS-331007 monophosphate (MP), which can be dephosphorylated to form GS-331007 or sequentially phosphorylated to form the pharmacologically active metabolite GS-331007 triphosphate (TP). Ribavirin is primarily taken up into hepatocytes by nucleoside transporters and is rapidly phosphorylated to form its pharmacologically active nucleotide metabolites.
The distribution of ribavirin in tissues, including its uptake into the liver, is largely defined by the expression of nucleoside transporters. In particular, equilibrative nucleoside transporter 1 (ENT1; encoded by the SLC29A1 gene) has been shown to facilitate the uptake of ribavirin into erythrocytes (12). Once inside cells, ribavirin is rapidly phosphorylated and trapped as nucleotide metabolites. Ribavirin has broad-spectrum antiviral activity and is thought to inhibit HCV by causing lethal mutagenesis following phosphorylation to its triphosphate form and incorporation into the growing viral transcript by the HCV NS5B polymerase (13, 14). The monophosphate metabolite of ribavirin is also a potent inhibitor of IMP dehydrogenase, a key enzyme in the formation of guanosine nucleotides, which also may play a role in its pharmacology (15).
Little is known about the intrahepatic concentrations of sofosbuvir and ribavirin triphosphate metabolites in humans, because of the need for hepatic tissue collection and challenging analytical methods. One could imagine that animal data might be informative in predicting liver triphosphate levels. However, reported concentrations of hepatic triphosphate levels measured in rat, dog, and monkey following oral administration of sofosbuvir differ widely, with relatively low levels observed in rat and monkey and high levels observed in dog (16). For example, levels in the liver were nearly 200-fold higher in beagle dog than in cynomolgus monkey following oral dosing, at 50 mg/kg of body weight, of the diastereomeric mixture containing sofosbuvir. It is not clear which nonclinical species has hepatic concentrations most predictive of those in humans. In addition, clinically, cirrhosis and decompensation are associated with a lower rate of SVR to direct-acting antiviral therapy (17, 18), and there has been speculation that in the presence of portal hypertension, there may be areas of the liver to which the drug is inadequately delivered.
To gain a better understanding of the intrahepatic pharmacokinetics of sofosbuvir and ribavirin in patients with cirrhosis (Child class A and B), we quantified nucleotide levels in liver tissue sections from HCV-infected patients treated for as long as 52 weeks with sofosbuvir and ribavirin prior to liver transplantation in an open-label study. Additionally, freshly isolated primary human hepatocytes were incubated in vitro with sofosbuvir and ribavirin for determination of the relative proportions of intracellular metabolites in order to help interpret the hepatic metabolite concentrations measured in the clinical study.
(The initial results from this study, including results for a subset of the patients, were presented at the 64th Annual Meeting of the American Association for the Study of Liver Diseases, Washington, DC, 1 to 5 November 2013.)
RESULTS
Patient population.
Among the 30 patients with liver samples, the median age was 59 years, and the majority were male (77%) and white (83%) (Table 1). Twenty-one patients (70%) had HCV genotype 1 infection (11 patients with genotype 1a and 10 with 1b). The median duration of sofosbuvir and ribavirin treatment was 18 weeks (range, 3 to 52 weeks). Three patients completed 24 weeks of treatment and then restarted treatment, completing as many as 12 further weeks. Six patients received continuous treatment beyond 24 weeks and up to an additional 28 weeks. Twenty-three patients underwent sofosbuvir and ribavirin treatment until 1 to 2 days before liver transplantation, while 7 patients completed and stopped treatment 5 to 160 days prior to transplantation.
TABLE 1.
Patient demographics and baseline characteristics
| Characteristica | Value for patients (n = 30) |
|---|---|
| Age (yr) | 59 (50–73) |
| Male | 23 (77) |
| Race | |
| White | 25 (83) |
| Black | 3 (10) |
| Hispanic | 2 (7) |
| Treatment duration (wks) | 18 (3–52)b |
| Genotype | |
| 1a | 11 (37) |
| 1b | 10 (33) |
| 2a | 1 (3) |
| 2b | 3 (10) |
| 3a | 4 (13) |
| 4a | 1 (3) |
| BMI (kg/m2) | 28 (20–59) |
Values for continuous variables are given as medians (ranges). Values for categorical variables are given as numbers (percentages) of patients with the characteristic. BMI, body mass index.
Three patients completed 24 weeks of treatment then restarted treatment, completing up to 24 further weeks. Six patients received continuous treatment beyond 24 weeks and up to 52 weeks.
Plasma pharmacokinetics.
To get a sense of whether the pharmacokinetics of sofosbuvir and ribavirin in patients who had liver metabolite levels determined in this study were consistent with what has been reported previously, sparse plasma sampling was conducted during study visits. Pharmacokinetic parameters for the sofosbuvir metabolite GS-331007 and ribavirin were estimated by plotting the data from across study visits based on the time the sample was collected postdose and fitting the data to a noncompartmental model (see Fig. S1 in the supplemental material). For GS-331007, the maximum concentration in plasma (Cmax) and the plasma exposure over 24 h (area under the concentration-time curve from 0 to 24 h [AUC0–24]) were 620 ng/ml and 8,400 ng · h/ml, respectively (based on 58 measurements of concentrations in plasma). The ribavirin Cmax and AUC0–24 were 2,500 ng/ml and 51,000 ng · h/ml, respectively (based on 81 measurements of concentrations in plasma). The results suggested plasma half-lives (t1/2) for GS-331007 and ribavirin that were consistent with the values provided in the prescribing information (27 and 120 to 170 h, respectively). Plasma samples were also collected at the time of transplantation and generally indicated whether the subject was on treatment at the time of sample collection. Participants who were on therapy at the time of transplantation had higher levels of GS-331007 and ribavirin in plasma than those who had stopped, except for a case of suspected nonadherence, which is further discussed below. These results are consistent with the plasma pharmacokinetics of sofosbuvir (Cmax, 582 ng/ml; AUC0–24, 7,120 ng · h/ml) and ribavirin (Cmax, 2,748 ng/ml; AUC0–24, 50,722 ng · h/ml) reported for HCV-infected subjects (19, 20).
Metabolites in liver sections.
The structures of monitored intracellular metabolites are summarized in Fig. 1. Low-flow, ion-pairing liquid chromatography-tandem mass spectrometry (LC–MS-MS) was used to separate and detect the metabolites of sofosbuvir (Fig. 2) and ribavirin (see Fig. S2 in the supplemental material). Total levels of sofosbuvir and ribavirin nucleoside and nucleotide metabolites were high in liver tissue. Median total concentrations (sum of nucleoside and mono-, di-, and triphosphates) observed in liver sections in patients on sofosbuvir and ribavirin at the time of transplantation (n = 23) were 77.1 μM (range, 4.10 to 252 μM) for sofosbuvir and 361 μM (range, 90.6 to 1,800 μM) for ribavirin (Fig. 3). For sofosbuvir, mostly submicromolar levels of metabolite X were detected (median, 0.16 μM [minimum, 0.007 μM; maximum, 5.08 μM]). Levels of metabolites in the liver were unaffected by the baseline model for end-stage liver disease (MELD) or creatinine clearance (CrCl) (see Fig. S3 in the supplemental material). The concentrations of intracellular metabolites were also similar for males and females (see Fig. S4 in the supplemental material).
FIG 2.

LC–MS-MS chromatograms for sofosbuvir metabolites. Shown is the separation of intracellular metabolites GS-331007 (a), GS-331007 monophosphate (MP) (b), metabolite X (c), GS-331007 diphosphate (DP) (d), GS-331007 triphosphate (TP) (e), and the internal standard chloro-ATP (f) using reverse-phase ion-pairing chromatography and negative-mode MS-MS analysis. The retention times and mass-to-charge ratios (m/z) for the parent and daughter ions of each analyte are indicated. A liver sample from a representative patient was analyzed.
FIG 3.

Median concentrations of sofosbuvir and ribavirin metabolites in human liver sections after 3 to 52 weeks of treatment with sofosbuvir and ribavirin. Concentrations of each individual metabolite and total metabolites are shown for sofosbuvir (a and c, respectively) and ribavirin (b and d, respectively). Results for patients who had been off therapy for more than 5 days (□), those with detectable HCV at the time of transplantation (△), those who relapsed posttransplantation (○), and those who had pTVR (●) are indicated. Results for one subject who had been off therapy for 5 days and also had detectable HCV at the time of transplantation are indicated by asterisks. The five patients with the lowest levels of sofosbuvir-related metabolites stopped therapy ≥3 weeks before transplantation. Lines indicate median concentrations of sofosbuvir (70.3 μM; range, 0.382 to 252 μM) and ribavirin (329 μM; range, 10.1 to 1,800 μM) in the 30 patients.
Of the eight patients with total sofosbuvir levels of <20 μM, two had completed treatment approximately 3 weeks prior to liver transplantation, while three others had been off treatment for 5 to 23 weeks. One patient, who was listed as on therapy, had low levels of total sofosbuvir metabolites in the liver (16.4 μM) and low levels of GS-331007 in plasma (37.9 ng/ml) at the time of transplantation, suggesting nonadherence to treatment. This patient did achieve a posttransplantation virologic response (pTVR). In the total study population, including those who had been off therapy for >5 days (n = 30), the median (range) total concentrations of sofosbuvir in the liver were 70.3 μM (0.382 μM to 252 μM) and those of ribavirin were 329 μM (10.1 μM to 1,800 μM). Ribavirin levels did not drop to the extent that sofosbuvir levels did in patients who had been off treatment prior to liver transplantation, a finding consistent with the fact that ribavirin and its phosphorylated metabolites have half-lives of approximately 9 to 14 days in plasma, serum, red blood cells (RBC), and peripheral blood mononuclear cells (PBMC) (21, 22).
Levels of endogenous adenosine nucleotide were monitored to assess the level of postcollection dephosphorylation. The absolute ATP levels (median, 360 μM) and the ratio of ATP to the sum of AMP and ADP (median, 0.2) (Fig. 4) were approximately 10-fold lower than previously reported values (3,100 μM and 2, respectively) (23). The low levels of ATP and the low ratio of adenosine nucleotides are also in contrast to our experience with cell culture in vitro and with cells and tissues collected during pharmacokinetic studies, where sample handling could be better controlled (24–27). These results suggest that despite rapid freezing, dephosphorylation could not be totally prevented in this setting.
FIG 4.
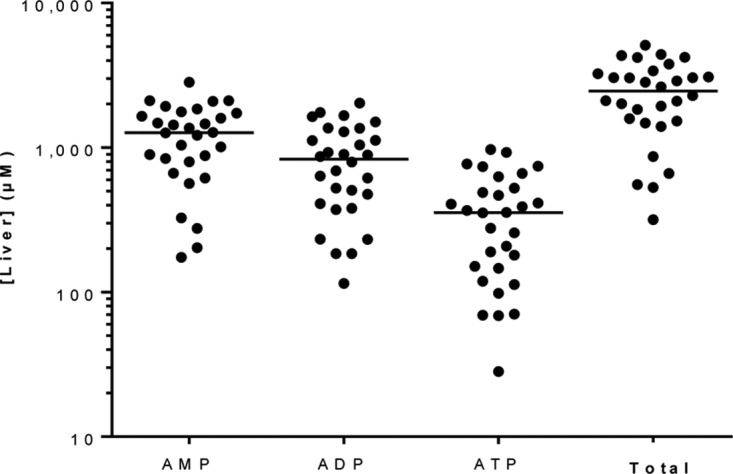
Endogenous adenosine nucleotide concentrations in human liver sections. ATP concentrations (median, 360 μM) and the ratio of ATP to the sum of AMP and ADP (0.2) were approximately 10-fold lower than those reported in the literature (3,100 μM and 2, respectively) (23), suggesting postcollection dephosphorylation of the samples. Lines represent the median concentrations in liver sections collected from 30 patients.
In vitro hepatocyte incubations.
Given the evidence for variable dephosphorylation in the clinical samples, in vitro studies were initiated to allow for a quantitative understanding of the relative distribution of the individual metabolites and levels of the pharmacologically active triphosphate metabolites. Sofosbuvir and ribavirin were efficiently metabolized in primary human hepatocytes incubated in vitro (Fig. 5). Incubation concentrations were selected to be at or somewhat above the respective plasma Cmax to model concentrations that might be present in the portal vein prior to first-pass hepatic extraction. We found linear and proportional hepatocyte loading of all metabolites between 1 and 10 μM sofosbuvir, allowing for results from incubations of different concentrations carried out for separate donors to be normalized. After incubation of sofosbuvir for 1 h, followed by removal of extracellular compound, the intermediate metabolite X was rapidly formed intracellularly. In accordance with the low levels observed in clinical liver samples and the typical timing of liver transplantation after the last dose, metabolite X levels were transient and had decreased to low levels by 24 h. Concomitantly with the decline of this intermediate metabolite, nucleotide metabolites, including the pharmacologically active GS-331007 triphosphate, were observed. Ribavirin was rapidly activated through sequential phosphorylation, resulting in the presence of intracellular ribavirin monophosphate, diphosphate, and triphosphate. Activation was efficient, with the triphosphates accounting for 64% and 79% of nucleotide metabolites of sofosbuvir and ribavirin, respectively. Once formed, the triphosphate metabolite of sofosbuvir persisted with a half-life of >24 h. Ribavirin triphosphate had a short initial half-life of approximately 4 h, followed by a longer terminal elimination phase of >24 h. As with the clinical samples, there was no evidence for a difference in the metabolism of sofosbuvir based on gender; similar maximal levels of GS-331007 triphosphate were observed in cells isolated from males and females (Fig. S4a in the supplemental material).
FIG 5.

In vitro metabolism of sofosbuvir (left) and ribavirin (right) in primary human hepatocytes. Following a 2-h pulse incubation, the drug-containing medium was removed and was replaced with fresh medium without drug. Incubation with sofosbuvir led to the rapid appearance of metabolite X, which egressed following removal of the drug from the medium, allowing more-persistent exposure to the pharmacologically active triphosphate. Ribavirin was concentrated in cells and rapidly metabolized to its triphosphate metabolite. At 24 h, the triphosphate metabolites accounted for approximately 70% of the total intracellular metabolites for both sofosbuvir and ribavirin. Based on the observation of dose linearity, incubations of 1, 5, and 10 μM sofosbuvir were dose-normalized to 1 μM. The pulse incubation concentration for ribavirin was 100 μM. Results are means ± standard deviations for cells from 14 (sofosbuvir) or 2 (ribavirin) donors, with results at each time point taken from duplicate incubations.
Treatment outcome.
The overall results for the 46 patients who received liver transplants in the study have been reported previously (28); 70% of patients achieved a pTVR and did not relapse within 12 weeks after transplantation. As summarized in Fig. 3, 2 of the 30 patients who were assessed for liver pharmacokinetics had detectable HCV at the time of transplantation. Of the remaining 28 patients, 5 relapsed posttransplantation, resulting in a pTVR of 82% (23/28). Median total levels of GS-331007 (72.8 μM versus 58.1 μM) and ribavirin (256 μM versus 503 μM) in the liver were similar in patients who achieved pTVR and those who relapsed.
DISCUSSION
This study assessed the levels of sofosbuvir and ribavirin metabolites in the livers of more than half of the subjects in study P7997-2025 (ClinicalTrials registration no. NCT01559844). The results are likely relevant beyond pretransplant therapy, since these patients had compensated liver disease and maintained renal function. The plasma pharmacokinetic analysis reported here showed findings similar to those observed in the broader HCV treatment population, including those without liver cirrhosis. Comparison of maximal plasma nucleoside levels (GS-331007 Cmax, 620 ng/ml, or 2.4 μM; ribavirin Cmax, 2,500 ng/ml, or 10.2 μM) with total levels in the liver (77.1 μM sofosbuvir and 361 μM ribavirin) results in an estimated liver/plasma ratio of approximately 30-fold for each. The delivery of these drugs to the liver reflects trapping of polar phosphorylated metabolites for both drugs, prodrug activation for sofosbuvir, and nucleoside transport for ribavirin.
The efficient delivery to the liver observed in this study helps to provide a better understanding of the pharmacology of sofosbuvir and ribavirin. The total levels of sofosbuvir metabolites in the livers of patients currently on therapy (77.1 μM) and the estimated triphosphate concentrations based on the proportions of intracellular metabolites observed in vitro (∼50 μM) greatly exceed the inhibition constant (Ki) for the HCV NS5B RNA-dependent RNA polymerase (0.42 μM) (11). The extremely high intracellular levels of ribavirin and its metabolites support the view that ribavirin has a pleotropic effect on viral replication, including inhibition of IMP dehydrogenase by the monophosphate metabolite and incorporation of the triphosphate metabolite into the viral genome to result in lethal mutagenesis. Even the small proportion of total intracellular ribavirin suggested to be in the monophosphate form based on our in vitro primary hepatocyte metabolism studies would greatly exceed the reported Ki of 250 nM for IMP dehydrogenase (29). The estimated levels of ribavirin triphosphate also approach the reported binding constant (Kd) of 500 to 700 μM for incorporation as an ATP or GTP analog by HCV NS5B (13).
In a previous study of sofosbuvir pharmacokinetics in HCV-infected patients, Rower et al. (30) assessed intracellular metabolite levels in PBMC and RBC from 45 patients and in liver samples from 2 patients undergoing orthotopic cadaveric liver transplantation while receiving sofosbuvir therapy. In contrast to our results, the average total concentration of the monitored metabolites (GS-331007 monophosphate, diphosphate, and triphosphate) in the livers of the 2 patients was 0.53 μM (average, 1,500 fmol/106 cells, assuming that the intracellular volume of a hepatocyte is 2.85 pl [31]). GS-331007 monophosphate was the dominant intracellular metabolite detected, providing evidence for marked postcollection dephosphorylation of the samples. Since GS-331007 was not monitored, it is possible that the samples were further dephosphorylated than in our study, resulting in a disproportionate amount of the total intracellular material degrading to unmonitored nucleoside. To avoid dephosphorylation, we streamlined sample collection procedures and specified freezing within 5 min, which may have increased the relative integrity of the tissue. In the study of Rower et al., PBMC samples contained predominantly triphosphates, suggesting a relative lack of dephosphorylation during the handling of samples of this cell type (30). Levels of GS-331007 triphosphate within PBMC were approximately 4 μM (859 fmol/106 cells, assuming an intracellular volume of 0.2 pl). The higher levels in PBMC than in liver reported by Rower et al. are not consistent with the high first-pass hepatic extraction and efficient liver metabolism established for sofosbuvir. Reported concentrations in RBC were extremely low and inconsistently detectable in the study (<30 nM [2.9 fmol/106 cells, assuming an intracellular volume of 0.1 pl]) (30). While PBMC were not collected in the current study, comparison of the sofosbuvir metabolite levels in PBMC determined in the prior study to the levels in liver determined here suggests >10-fold-higher levels in liver.
The intracellular pharmacokinetic profile of ribavirin in PBMC and RBC of HCV-infected patients has also been reported previously (22). Total concentrations of ribavirin monophosphate, diphosphate, and triphosphate reached a remarkable 1,500 μM at steady state in RBC, in accordance with RBC having high levels of ENT1. Levels of ribavirin in PBMC were approximately 10-fold lower. In both cell types, there was evidence for efficient phosphorylation; triphosphate was the predominant intracellular metabolite. Unfortunately, this study did not include PBMC or RBC collection to allow for in-study comparison of relative intracellular levels. Taken together with the results of our study, these prior results suggest that the intracellular concentration of ribavirin nucleotide metabolites is highest in RBC, followed by hepatocytes and then PBMC. Our observation of efficient ribavirin activation in isolated hepatocytes in vitro and high intracellular levels in liver samples from HCV-infected patients is consistent with previously reported high levels of ENT1 expressed in liver (32).
This study has limitations related to the instability of the metabolites and the unpredictable timing of liver transplantation. While care was taken to freeze samples within 5 min of collection, variable levels of dephosphorylation were apparent in the samples both from the distribution of endogenous adenosine nucleotides and the nucleotide analogs studied. Unfortunately, this does not allow for a firm conclusion about the in vivo distribution of different metabolites. The in vitro studies we have completed in primary human cells suggest that a majority of the intracellular metabolites were in triphosphate form. Liver samples were also taken at different times postdose and, in some cases, days or weeks after the discontinuation of therapy. Therefore, the circumstances of the study did not allow for assessment of an accurate intrahepatic pharmacokinetic profile over the dosing interval. The variable timing of sample collection likely did not affect our assessment of steady-state concentrations due to the exceptionally long half-life of ribavirin in blood (up to 14 days) and the long intracellular half-life of the triphosphate metabolite of sofosbuvir in liver (>24 h). Additionally, we are limited in our ability to correlate metabolite concentrations with treatment response or efficacy, because patients received treatment for various lengths of time, with some not completing treatment of sufficient duration prior to transplantation and others having an SVR and discontinuing therapy prior to transplantation.
In conclusion, our results confirm that orally administered doses of sofosbuvir and ribavirin used in clinical practice efficiently load the liver. In particular, the levels of the pharmacologically active triphosphate metabolite of sofosbuvir are in great excess of its inhibition constant for the HCV NS5B polymerase. These results underscore the importance of in vivo intracellular analyses to more accurately assess the pharmacology of drugs at their target sites.
MATERIALS AND METHODS
Patients.
Patients in this analysis were enrolled in an international phase 2 open-label study of sofosbuvir and ribavirin for preventing the recurrence of HCV infection after liver transplantation (study P7977-2025). The study methods have been described previously (28). Briefly, patients were ≥18 years old, had a body mass index (BMI) of ≥18 kg/m2, and had infection with HCV of any genotype, with an HCV RNA level of >104 IU/ml. Patients were HCV treatment naïve or experienced. Patients had hepatocellular carcinoma meeting the Milan criteria (33) and were on the waiting list for liver transplantation from a deceased donor, with an anticipated time of <1 year until transplantation. Patients had a biological model for end-stage liver disease (MELD) score of <22 and a Child-Turcotte-Pugh score of ≤7 and were eligible for a MELD exception as per the policy of the United Network for Organ Sharing. Patients with renal impairment (creatinine clearance [CrCl], <60 ml/min, estimated using the Cockcroft-Gault equation) were excluded from the study.
Study design.
Sofosbuvir (Gilead Sciences, Foster City, CA) at 400 mg was administered once daily, along with ribavirin (Ribasphere; Kadmon, Warrendale, PA) administered twice daily and dosed according to body weight (1,000 mg/day for patients weighing <75 kg and 1,200 mg/day for those weighing ≥75 kg). In the original study protocol, treatment was to last either 24 weeks or until the time of transplantation, whichever occurred first. In a subsequent amendment, all patients who had not reached 24 weeks of treatment at the time of the amendment were allowed to continue treatment uninterrupted to 52 weeks or transplantation, or those who had completed 24 weeks were retreated for as long as an additional 24 weeks. For patients receiving treatment at the time of transplantation, dosing was to be discontinued within 24 h before transplantation.
The study protocol was approved by the review board or ethics committee of each institution prior to study initiation. The study was conducted in accordance with the good clinical practice guidelines of the International Conference on Harmonization and the Declaration of Helsinki.
Clinical sample collection and preparation.
Sparse pharmacokinetic sampling was completed. A single blood sample was drawn into K2-EDTA tubes from patients during study visits at weeks 1, 4, 8, 12, and 24 and at the time of liver transplantation. Plasma was separated by centrifugation and was stored frozen until analysis.
Livers were collected during transplantation from 30 consenting patients of the 63 enrolled in the study. In order to avoid dephosphorylation of the liver samples, livers were blotted dry; small sections (∼1 cm3) of liver were taken, avoiding cancerous tissue; and sections were immediately flash-frozen in liquid nitrogen (within approximately 5 min of organ removal). In order to expedite sample collection, the anatomical region of the liver from which the section was collected was not specified in the protocol. Duplicate samples were collected to allow for reanalysis if necessary. The frozen sections were later processed for analysis. Sample collection procedures were adapted from prior studies conducted on animals (24).
In vitro hepatocyte incubations.
Primary human hepatocytes from 16 donors were obtained from BioreclamationIVT (Baltimore, MD) or Life Technologies (acquired by Thermo Fisher Scientific). Hepatocytes were isolated from livers from donors negative for human immunodeficiency virus, hepatitis B virus, and HCV. The demographics of the 14 donors used for studies with sofosbuvir are summarized in Table S1 in the supplemental material. The hepatocytes were incubated with sofosbuvir (1, 5, or 10 μM) or ribavirin (100 μM) for 2 h and were then incubated in drug-free medium, with serial sampling over 24 h. Following the removal of extracellular medium at select time points, cells were washed twice with 2 ml of ice-cold 0.9% normal saline and were scraped into 0.5 ml ice-cold 70% methanol containing 100 nM 2-chloro-ATP (Sigma-Aldrich, St. Louis, MO) as an internal standard. Nucleotides were extracted by storing samples overnight at −20°C. Samples were then centrifuged at 15,000 × g for 15 min, and supernatants were transferred to fresh tubes for drying in a miVac Duo concentrator (Genevac, Gardiner, NY). Dried samples were reconstituted in 3 mM ammonium formate (pH 5.0) with 10 mM dimethyl hexyl amine (DMHA) in water for analysis.
Analytical methods.
Plasma samples were analyzed by liquid chromatography coupled to triple quadrupole tandem mass spectrometry (LC–MS-MS) using validated methods for GS-331007 and ribavirin in adherence to good laboratory practice. Plasma was analyzed by QPS Holdings LLC (Newark, DE). GS-331007 was analyzed in turbo spray ionization (TSI)-negative multiple reaction monitoring (MRM) mode following separation using an Aquasil C18 column (particle size, 5 μm; length, 100 mm; inside diameter, 2.1 mm; Thermo Electron, Fisher Scientific, Waltham, MA), a linear gradient from 25 mM ammonium formate in water to methanol-formic acid (100:0.1, vol/vol) over 6.5 min, and a flow rate of 300 μl/min. Ribavirin was analyzed in TSI-positive MRM mode following separation using a Luna PFP(2) column (particle size, 5 μm; pore size, 100 Å, length, 50 mm; inside diameter, 2.00 mm; Phenomenex, Torrance, CA), a linear gradient from water-1 M ammonium acetate-formic acid (100:2:0.1, vol/vol/vol) to acetonitrile-water-1 M ammonium acetate-formic acid (80:20:2:0.1, vol/vol/vol/vol) over 3.4 min, and a flow rate of 400 μl/min. Stable isotope-labeled internal standards were used to correct for sample processing and matrix effects. To ensure precision and accuracy, samples were quantified using calibration curves including 8 to 9 points and 4 to 5 quality control standards prepared in human plasma from untreated healthy donors. Pharmacokinetic parameters were estimated using noncompartmental modeling using Phoenix WinNonlin (Certara, Princeton, NJ).
Liver samples were analyzed by LC–MS-MS by adapting methods previously applied to other nucleotide analogs (24, 25). In brief, nucleoside and nucleotide metabolites were separated by low-flow, reverse-phase, DMHA ion-pairing chromatography. Intracellular ribavirin metabolites (ribavirin and ribavirin mono-, di-, and triphosphates) were monitored in TSI-positive MRM mode using a DMHA adduct as a daughter ion for ribavirin and its di- and triphosphorylated metabolites. Intracellular sofosbuvir metabolites (GS-331007, GS-331007 monophosphate, GS-331007 diphosphate, GS-331007 triphosphate, and metabolite X) were monitored in TSI-negative MRM mode. The quantitative analytical method included an 8-point calibration curve (r2, >0.98 for the monophosphate metabolite and >0.99 for all other metabolites), spanning >3 orders of magnitude in concentration. Quality control samples were run at the beginning and end of each analytical run to ensure precision and accuracy. While it was not feasible to obtain stable isotope-labeled internal standards for the nine metabolites being monitored, chloro-ATP was used to correct for sample processing and standard curves, and quality control samples were prepared in a human liver section from a donor not on therapy, obtained from Life Technologies. Minimal matrix effect has been observed in comparing liver extracts to samples prepared in buffer (data not shown). The natural adenosine nucleotides AMP, ADP, and ATP were quantitated using standard curves of the respective stable-isotope-labeled nucleotides as described previously (26). Lower limits of quantitation (LLOQ) in liver samples were 0.008 μM for GS-331007 and metabolite X, 0.072 μM for GS-331007 mono-, di-, and triphosphates, 1.3 μM for ribavirin, 0.43 μM for ribavirin mono-, di-, and triphosphates, and 2.74 μM for stable-isotope-labeled AMP, ADP, and ATP. Samples from primary hepatocyte incubations conducted in vitro were analyzed by similar analytical methods.
In order to determine intracellular concentrations, frozen liver sections were weighed prior to homogenization. Metabolites were extracted using an Omni Tip homogenizing kit as described previously (27). In brief, samples were homogenized in ice-cold buffer containing chloro-ATP as an internal standard, evaporated to dryness, and reconstituted in 1 mM ammonium phosphate (pH 7) prior to LC–MS-MS analysis. Tissue weights were converted to intracellular volume using the ratio of liver weight to an intracellular hepatocyte volume of 1.4 g/ml (34).
Supplementary Material
ACKNOWLEDGMENTS
We thank the patients and their families as well as the study site personnel. Jennifer King of August Editorial helped draft the manuscript.
Funding for this study was provided by Gilead Sciences, Inc.
Michael P. Curry has received research grants from Gilead Sciences, Conatus, and Mallinckrodt and has served as a consultant for Gilead, Bristol-Myers-Squibb, and AbbVie. Nezam Afdhal has received research support from Gilead Sciences, Abbott, Bristol-Myers-Squibb, GlaxoSmithKline, Merck & Co., and Vertex Pharmaceuticals; has served as a consultant or advisory board member for Gilead Sciences, Boehringer Ingelheim, Echosens, GlaxoSmithKline, Kadmon, Ligand, Medgenics, Merck & Co., Novartis, Spring Bank, and Vertex Pharmaceuticals; and holds stock options with Spring Bank and Medgenics. The following authors are employees of Gilead Sciences and hold stock interest in the company: Darius Babusis, Brian Kirby, Yeojin Park, Eisuke Murakami, Ting Wang, Anita Mathias, John G. McHutchison, and Adrian S. Ray.
Footnotes
Supplemental material for this article may be found at https://doi.org/10.1128/AAC.02587-17.
REFERENCES
- 1.McHutchison JG, Gordon SC, Schiff ER, Shiffman ML, Lee WM, Rustgi VK, Goodman ZD, Ling MH, Cort S, Albrecht JK. 1998. Interferon alfa-2b alone or in combination with ribavirin as initial treatment for chronic hepatitis C. Hepatitis Interventional Therapy Group. N Engl J Med 339:1485–1492. [DOI] [PubMed] [Google Scholar]
- 2.Poynard T, Marcellin P, Lee SS, Niederau C, Minuk GS, Ideo G, Bain V, Heathcote J, Zeuzem S, Trepo C, Albrecht J. 1998. Randomised trial of interferon α2b plus ribavirin for 48 weeks or for 24 weeks versus interferon α2b plus placebo for 48 weeks for treatment of chronic infection with hepatitis C virus. International Hepatitis Interventional Therapy Group (IHIT). Lancet 352:1426–1432. [DOI] [PubMed] [Google Scholar]
- 3.Pianko S, McHutchison JG. 2000. Treatment of hepatitis C with interferon and ribavirin. J Gastroenterol Hepatol 15:581–586. doi: 10.1046/j.1440-1746.2000.02082.x. [DOI] [PubMed] [Google Scholar]
- 4.Jacobson IM, Gordon SC, Kowdley KV, Yoshida EM, Rodriguez-Torres M, Sulkowski MS, Shiffman ML, Lawitz E, Everson G, Bennett M, Schiff E, Al-Assi MT, Subramanian GM, An D, Lin M, McNally J, Brainard D, Symonds WT, McHutchison JG, Patel K, Feld J, Pianko S, Nelson DR, POSITRON Study FUSION Study. 2013. Sofosbuvir for hepatitis C genotype 2 or 3 in patients without treatment options. N Engl J Med 368:1867–1877. doi: 10.1056/NEJMoa1214854. [DOI] [PubMed] [Google Scholar]
- 5.Lawitz E, Mangia A, Wyles D, Rodriguez-Torres M, Hassanein T, Gordon SC, Schultz M, Davis MN, Kayali Z, Reddy KR, Jacobson IM, Kowdley KV, Nyberg L, Subramanian GM, Hyland RH, Arterburn S, Jiang D, McNally J, Brainard D, Symonds WT, McHutchison JG, Sheikh AM, Younossi Z, Gane EJ. 2013. Sofosbuvir for previously untreated chronic hepatitis C infection. N Engl J Med 368:1878–1887. doi: 10.1056/NEJMoa1214853. [DOI] [PubMed] [Google Scholar]
- 6.Lawitz E, Jacobson IM, Nelson DR, Zeuzem S, Sulkowski MS, Esteban R, Brainard D, McNally J, Symonds WT, McHutchison JG, Dieterich D, Gane E. 2015. Development of sofosbuvir for the treatment of hepatitis C virus infection. Ann N Y Acad Sci 1358:56–67. doi: 10.1111/nyas.12832. [DOI] [PubMed] [Google Scholar]
- 7.Kardashian AA, Pockros PJ. 2017. Novel emerging treatments for hepatitis C infection: a fast-moving pipeline. Therap Adv Gastroenterol 10:277–282. doi: 10.1177/1756283X16683875. [DOI] [PMC free article] [PubMed] [Google Scholar]
- 8.Kowdley KV, Sundaram V, Jeon CY, Qureshi K, Latt NL, Sahota A, Lott S, Curry MP, Tsai N, Chaiyakunapruk N, Lee Y, Petersen J, Buggisch P. 2017. Eight weeks of ledipasvir/sofosbuvir is effective for selected patients with genotype 1 hepatitis C virus infection. Hepatology 65:1094–1103. doi: 10.1002/hep.29005. [DOI] [PubMed] [Google Scholar]
- 9.Wright DH, Caro L, Cerra M, Panorchan P, Du L, Anderson M, Potthoff A, Nachbar RB, Wagner J, Manns MP, Talal AH. 2015. Liver-to-plasma vaniprevir (MK-7009) concentration ratios in HCV-infected patients. Antivir Ther (Lond) 20:843–848. doi: 10.3851/IMP2958. [DOI] [PMC free article] [PubMed] [Google Scholar]
- 10.Murakami E, Tolstykh T, Bao H, Niu C, Steuer HMM, Bao D, Chang W, Espiritu C, Bansal S, Lam AM, Otto MJ, Sofia MJ, Furman PA. 2010. Mechanism of activation of PSI-7851 and its diastereoisomer PSI-7977. J Biol Chem 285:34337–34347. doi: 10.1074/jbc.M110.161802. [DOI] [PMC free article] [PubMed] [Google Scholar]
- 11.Murakami E, Niu C, Bao H, Micolochick Steuer HM, Whitaker T, Nachman T, Sofia MA, Wang P, Otto MJ, Furman PA. 2008. The mechanism of action of β-d-2′-deoxy-2′-fluoro-2′-C-methylcytidine involves a second metabolic pathway leading to β-d-2′-deoxy-2′-fluoro-2′-C-methyluridine 5′-triphosphate, a potent inhibitor of the hepatitis C virus RNA-dependent RNA polymerase. Antimicrob Agents Chemother 52:458–464. doi: 10.1128/AAC.01184-07. [DOI] [PMC free article] [PubMed] [Google Scholar]
- 12.Endres CJ, Moss AM, Ke B, Govindarajan R, Choi D-S, Messing RO, Unadkat JD. 2009. The role of the equilibrative nucleoside transporter 1 (ENT1) in transport and metabolism of ribavirin by human and wild-type or Ent1−/− mouse erythrocytes. J Pharmacol Exp Ther 329:387–398. doi: 10.1124/jpet.108.145854. [DOI] [PMC free article] [PubMed] [Google Scholar]
- 13.Crotty S, Maag D, Arnold JJ, Zhong W, Lau JY, Hong Z, Andino R, Cameron CE. 2000. The broad-spectrum antiviral ribonucleoside ribavirin is an RNA virus mutagen. Nat Med 6:1375–1379. doi: 10.1038/82191. [DOI] [PubMed] [Google Scholar]
- 14.Maag D, Castro C, Hong Z, Cameron CE. 2001. Hepatitis C virus RNA-dependent RNA polymerase (NS5B) as a mediator of the antiviral activity of ribavirin. J Biol Chem 276:46094–46098. doi: 10.1074/jbc.C100349200. [DOI] [PubMed] [Google Scholar]
- 15.Reyes GR. 2001. Ribavirin: recent insights into antiviral mechanisms of action. Curr Opin Drug Discov Devel 4:651–656. [PubMed] [Google Scholar]
- 16.Sofia MJ, Bao D, Chang W, Du J, Nagarathnam D, Rachakonda S, Reddy PG, Ross BS, Wang P, Zhang H-R, Bansal S, Espiritu C, Keilman M, Lam AM, Steuer HMM, Niu C, Otto MJ, Furman PA. 2010. Discovery of a β-d-2′-deoxy-2′-α-fluoro-2′-β-C-methyluridine nucleotide prodrug (PSI-7977) for the treatment of hepatitis C virus. J Med Chem 53:7202–7218. doi: 10.1021/jm100863x. [DOI] [PubMed] [Google Scholar]
- 17.Afdhal N, Reddy KR, Nelson DR, Lawitz E, Gordon SC, Schiff E, Nahass R, Ghalib R, Gitlin N, Herring R, Lalezari J, Younes ZH, Pockros PJ, Di Bisceglie AM, Arora S, Subramanian GM, Zhu Y, Dvory-Sobol H, Yang JC, Pang PS, Symonds WT, McHutchison JG, Muir AJ, Sulkowski M, Kwo P. 2014. Ledipasvir and sofosbuvir for previously treated HCV genotype 1 infection. N Engl J Med 370:1483–1493. doi: 10.1056/NEJMoa1316366. [DOI] [PubMed] [Google Scholar]
- 18.Charlton M, Everson GT, Flamm SL, Kumar P, Landis C, Brown RS Jr, Fried MW, Terrault NA, O'Leary JG, Vargas HE, Kuo A, Schiff E, Sulkowski MS, Gilroy R, Watt KD, Brown K, Kwo P, Pungpapong S, Korenblat KM, Muir AJ, Teperman L, Fontana RJ, Denning J, Arterburn S, Dvory-Sobol H, Brandt-Sarif T, Pang PS, McHutchison JG, Reddy KR, Afdhal N. 2015. Ledipasvir and sofosbuvir plus ribavirin for hepatitis C virus infection in patients with advanced liver disease. Gastroenterology 149:649–659. doi: 10.1053/j.gastro.2015.05.010. [DOI] [PubMed] [Google Scholar]
- 19.Kirby BJ, Symonds WT, Kearney BP, Mathias AA. 2015. Pharmacokinetic, pharmacodynamic, and drug-interaction profile of the hepatitis C virus NS5B polymerase inhibitor sofosbuvir. Clin Pharmacokinet 54:677–690. doi: 10.1007/s40262-015-0261-7. [DOI] [PubMed] [Google Scholar]
- 20.Hoffmann-La Roche. August 2011, revision date. Copegus: highlights of prescribing information. Hoffmann-La Roche, Basel, Switzerland: https://www.accessdata.fda.gov/drugsatfda_docs/label/2011/021511s023lbl.pdf. [Google Scholar]
- 21.Wu LS, Rower JE, Burton JR, Anderson PL, Hammond KP, Baouchi-Mokrane F, Everson GT, Urban TJ, D'Argenio DZ, Kiser JJ. 2015. Population pharmacokinetic modeling of plasma and intracellular ribavirin concentrations in patients with chronic hepatitis C virus infection. Antimicrob Agents Chemother 59:2179–2188. doi: 10.1128/AAC.04618-14. [DOI] [PMC free article] [PubMed] [Google Scholar]
- 22.Rower JE, Meissner EG, Jimmerson LC, Osinusi A, Sims Z, Petersen T, Bushman LR, Wolfe P, McHutchison JG, Kottilil S, Kiser JJ. 2015. Serum and cellular ribavirin pharmacokinetic and concentration-effect analysis in HCV patients receiving sofosbuvir plus ribavirin. J Antimicrob Chemother 70:2322–2329. doi: 10.1093/jac/dkv122. [DOI] [PMC free article] [PubMed] [Google Scholar]
- 23.Traut TW. 1994. Physiological concentrations of purines and pyrimidines. Mol Cell Biochem 140:1–22. doi: 10.1007/BF00928361. [DOI] [PubMed] [Google Scholar]
- 24.Murakami E, Wang T, Babusis D, Lepist E-I, Sauer D, Park Y, Vela JE, Shih R, Birkus G, Stefanidis D, Kim CU, Cho A, Ray AS. 2014. Metabolism and pharmacokinetics of the anti-hepatitis C virus nucleotide prodrug GS-6620. Antimicrob Agents Chemother 58:1943–1951. doi: 10.1128/AAC.02350-13. [DOI] [PMC free article] [PubMed] [Google Scholar]
- 25.Hawkins T, Veikley W, Durand-Gasselin L, Babusis D, Reddy YS, Flaherty JF, Ray AS. 2011. Intracellular nucleotide levels during coadministration of tenofovir disoproxil fumarate and didanosine in HIV-1-infected patients. Antimicrob Agents Chemother 55:1549–1555. doi: 10.1128/AAC.00910-10. [DOI] [PMC free article] [PubMed] [Google Scholar]
- 26.Vela JE, Miller MD, Rhodes GR, Ray AS. 2008. Effect of nucleoside and nucleotide reverse transcriptase inhibitors of HIV on endogenous nucleotide pools. Antivir Ther (Lond) 13:789–797. [PubMed] [Google Scholar]
- 27.Murakami E, Wang T, Park Y, Hao J, Lepist EI, Babusis D, Ray AS. 2015. Implications of efficient hepatic delivery by tenofovir alafenamide (GS-7340) for hepatitis B virus therapy. Antimicrob Agents Chemother 59:3563–3569. doi: 10.1128/AAC.00128-15. [DOI] [PMC free article] [PubMed] [Google Scholar]
- 28.Curry MP, Forns X, Chung RT, Terrault NA, Brown R, Fenkel JM, Gordon F, O'Leary J, Kuo A, Schiano T, Everson G, Schiff E, Befeler A, Gane E, Saab S, McHutchison JG, Subramanian GM, Symonds WT, Denning J, McNair L, Arterburn S, Svarovskaia E, Moonka D, Afdhal N. 2015. Sofosbuvir and ribavirin prevent recurrence of HCV infection after liver transplantation: an open-label study. Gastroenterology 148:100–107. doi: 10.1053/j.gastro.2014.09.023. [DOI] [PubMed] [Google Scholar]
- 29.Streeter DG, Witkowski JT, Khare GP, Sidwell RW, Bauer RJ, Robins RK, Simon LN. 1973. Mechanism of action of 1–d-ribofuranosyl-1,2,4-triazole-3-carboxamide (Virazole), a new broad-spectrum antiviral agent. Proc Natl Acad Sci U S A 70:1174–1178. [DOI] [PMC free article] [PubMed] [Google Scholar]
- 30.Rower JE, Jimmerson LC, Chen X, Zheng J-H, Hodara A, Bushman LR, Anderson PL, Kiser JJ. 2015. Validation and application of a liquid chromatography-tandem mass spectrometry method to determine the concentrations of sofosbuvir anabolites in cells. Antimicrob Agents Chemother 59:7671–7679. doi: 10.1128/AAC.01693-15. [DOI] [PMC free article] [PubMed] [Google Scholar]
- 31.Duarte MI, Andrade HF Jr, Mariano ON, Corbett CE, Sesso A. 1989. Baseline volume data of human liver parenchymal cell. J Submicrosc Cytol Pathol 21:275–279. [PubMed] [Google Scholar]
- 32.Fukuchi Y, Furihata T, Hashizume M, Iikura M, Chiba K. 2010. Characterization of ribavirin uptake systems in human hepatocytes. J Hepatol 52:486–492. doi: 10.1016/j.jhep.2010.01.011. [DOI] [PubMed] [Google Scholar]
- 33.Mazzaferro V, Regalia E, Doci R, Andreola S, Pulvirenti A, Bozzetti F, Montalto F, Ammatuna M, Morabito A, Gennari L. 1996. Liver transplantation for the treatment of small hepatocellular carcinomas in patients with cirrhosis. N Engl J Med 334:693–699. doi: 10.1056/NEJM199603143341104. [DOI] [PubMed] [Google Scholar]
- 34.Colet JM, Makos JD, Malloy CR, Sherry AD. 1998. Determination of the intracellular sodium concentration in perfused mouse liver by 31P and 23Na magnetic resonance spectroscopy. Magn Reson Med 39:155–159. doi: 10.1002/mrm.1910390122. [DOI] [PubMed] [Google Scholar]
Associated Data
This section collects any data citations, data availability statements, or supplementary materials included in this article.