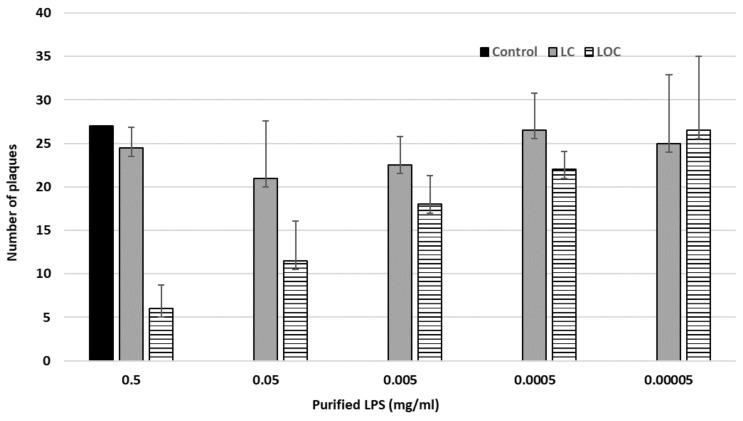
Figure 7.
Inhibition assay of the phage fPS-7 with the purified LPS derived from wild type Ye O:3 strain 6471/76 and from the rough derivative YeO3-R1. The values shown represent the average of two independent experiments. The black bars (the control) represent the number of plaques shown when plating fPS-7 on the host bacteria without addition of lipopolysaccharide (LPS). The grey bars (LC) represent the number of plaques appeared when plating the mixture of fPS-7 with the purified LC on the permissive host, which showed an average number of plaques of 21 to 26.5 (relative to the host which was around 28). A clear drop in the number of plaques is shown on the LOC bars; the least number of plaques is seen with the undiluted LOC preparation and the dose response is demonstrated upon the dilution of the LOC. Error bars represent the standard deviations of the means of number of plaques obtained from the phage assay.

