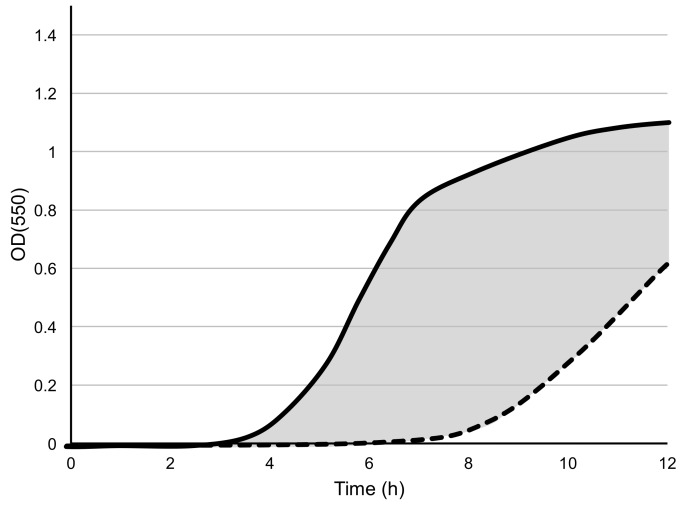
Figure 1.
An illustration of the liquid assay score is derived by Equation (2). The equation calculates the area (grey) between the positive control (solid line) and the phage-inoculated culture (dashed line) and expresses this as a percentage of the total area under the positive control curve. No inhibition of bacterial growth (solid and dashed lines overlap) results in a score of zero and completes the absence of growth in the phage-inoculated culture (dashed line follows X-axis) would result in a score of 100.

