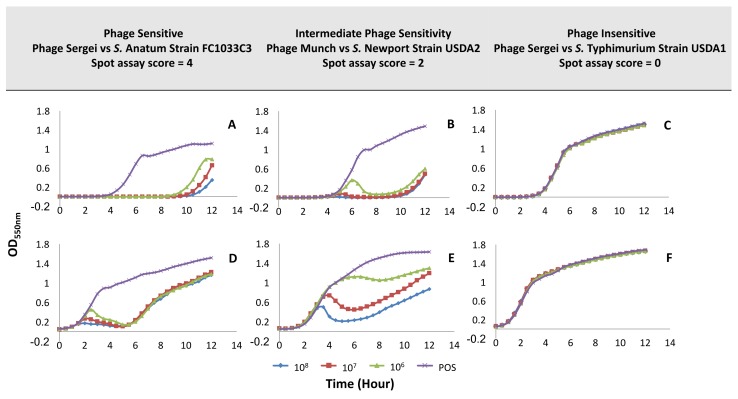
Figure 3.
Sample growth curves illustrating different phage sensitivity phenotypes in the low- and high-inoculum experimental setups. The X-axis indicates the OD550nm and the Y-axis represents the time in hours. Panels (A–C): experiments run with the low bacterial inoculum condition (~105 CFU/mL); panels (D–F): experiments run with the high bacterial inoculum condition (~108 CFU/mL). Both conditions were challenged with phage at 108 PFU/mL, 107 PFU/mL, and 106 PFU/mL; POS: positive culture control with no phage. Phage-host pairs were selected based on their scores from the spot host range assay, which was shown in Figure 1.

