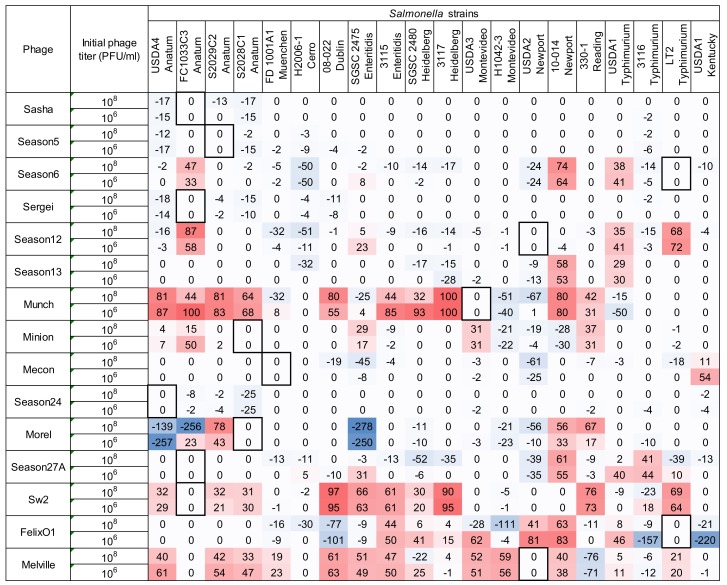
Figure 5.
Agreement levels between two host range methods. Equation (3) was used to determine agreement levels between two host range methods. One spot assay score representing one bacteria-phage combination (see Figure 1) was compared to two liquid assay scores at two different phage concentrations (see Figure 3) to determine if one phage concentration in the liquid assay yielded a difference in agreement levels. Values closer to zero indicate greater agreement between the two methods and values closer to 100 indicate disagreement. Negative values indicate greater bacterial sensitivity to phages observed in the liquid assay and positive values indicate greater sensitivity observed in the spot assay. Color intensity indicates greater divergence from zero in either direction, with blue shades indicating negative values and red shades indicating positive values. Boxed cells indicate the initial isolation and propagation host of the phage.

